
Market Foundations
1. What you'll learn and why it matters
Before you draw a single trendline or read a balance sheet, you need to know what you are actually buying, who stands on the other side of your order, what happens to your money between clicking "Buy" and seeing shares in your demat account, and what the whole thing costs. This chapter is the plumbing. It is not glamorous, but every later chapter assumes it.
By the end you will be able to:
- Explain why idle cash loses value, and compare asset classes using real 10-year Indian data (Nifty, a Nifty ETF, a gold ETF and a fixed deposit).
- Calculate absolute return, annualised return and CAGR, and know which one to use.
- Name every institution involved in a trade (SEBI, NSE/BSE, NSE Clearing/ICCL, NSDL/CDSL, your broker and DP) and say what each one does.
- Follow an IPO from DRHP to listing day, using two real 2025 IPOs that listed very differently.
- Explain how the Nifty 50 and Bank Nifty are built, and estimate how much a heavyweight stock moves the index.
- Place the right order type (limit, SL, SL-M, GTT, AMO) with the right product type (CNC, MIS, NRML, MTF), and know when a stop-loss can fail.
- Read a quote and the market-depth window, and know the current session timings and circuit-limit rules.
- Handle dividends, bonuses, splits, rights, buybacks and demergers, including how they distort price data.
- Work out the full cost of a delivery trade at current (October 2026) charges.
Swing traders (days to weeks) live on order types, gaps, stop-losses, circuit limits and costs. Positional and long-term investors need corporate actions, CAGR, benchmarks and the index you will be measured against. Futures traders (Chapter 9) need the clearing and margin system, NRML positions and session timings. All three need to understand that drawdowns are normal: the Nifty is down 14% from its high as this chapter is written.
2. Why invest: inflation, compounding, asset classes
2.1 Idle money shrinks
Prices of goods and services rise over time. This is inflation. India's CPI inflation was 4.82% year-on-year in August 2026 (MoSPI release of 14 Sep 2026). If your cash earns nothing, a basket that costs ₹100 today costs about ₹104.82 next year, so your rupee buys less. Varsity's opening example makes the point with a salaried person who saves part of every month's salary for 20 years but keeps it as cash: because expenses keep rising every year, the cash pile runs out only a few years into retirement, while the same savings invested at a reasonable rate of return grow several times larger.
The logic is simple. Your savings must grow faster than prices just to stand still. What actually matters is the real return: what you earn after inflation and tax.
- \(r_{nominal}\)
- The return you earn in rupees over one year, as a decimal (6.5% = 0.065). Use the after-tax rate if you want the after-tax real return.
- \(\text{inflation}\)
- How much prices rose over the same year, as a decimal (CPI inflation of 4.82% = 0.0482).
- \(r_{real}\)
- The real return: how much more your money can actually buy after the year, as a decimal.
How it works: add 1 to both rates, divide the first by the second and subtract 1. A positive answer means your money buys more than before. A negative answer means you are falling behind prices, even though the rupee amount grew. Simply subtracting (6.5% − 4.82% = 1.68%) is a rough shortcut that works when both rates are small.
Is a 6.5% fixed deposit actually growing your money?
- Nominal rate 6.5% (an assumed FD rate; large banks were quoting roughly 6–6.5% for one year in Sep 2026, so check your own bank). Inflation 4.82%.
- Pre-tax real return: \( \frac{1.065}{1.0482} - 1 = 1.60\% \).
- FD interest is added to your income and taxed at your slab (your income-tax bracket). At 30%, post-tax interest = \( 6.5\% \times 0.7 = 4.55\% \).
- Post-tax real return: \( \frac{1.0455}{1.0482} - 1 = -0.26\% \). You are slowly getting poorer in real terms, with your capital fully "safe".
2.2 Compounding: why the rate matters so much
Compounding means you earn returns on past returns. The value after \(n\) years at rate \(r\) is:
- \(PV\)
- Present value: the lump sum you invest today, in ₹.
- \(r\)
- The yearly rate of return, as a decimal (10% = 0.10).
- \(n\)
- The number of years the money stays invested.
- \(FV\)
- Future value: what the lump sum grows to after \(n\) years, in ₹.
How it works: each year the pot is multiplied by \((1 + r)\). The return stays in the pot, so next year's return is earned on a bigger amount. Doing this \(n\) times is the same as multiplying once by \((1 + r)\) raised to the power \(n\).
Example: ₹1 lakh at 10% for 20 years. \(1.10^{20} = 6.7275\) (1.10 multiplied by itself 20 times), so \(FV = 100000 \times 6.7275\) = ₹6,72,750.
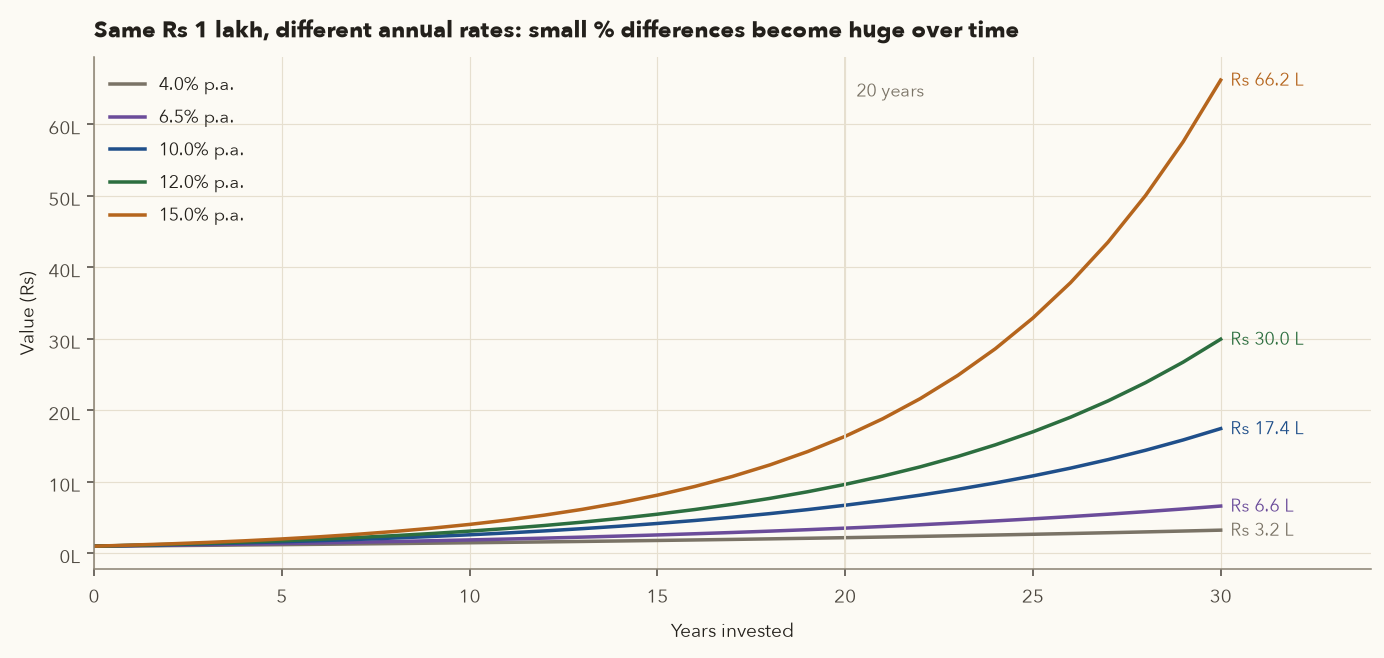
The exponent is why a few percentage points matter so much over long periods. ₹1 lakh left for 20 years becomes ₹2,19,112 at 4%, ₹3,52,365 at 6.5%, ₹6,72,750 at 10%, ₹9,64,629 at 12% and ₹16,36,654 at 15%. Moving from 10% to 15% does not add half as much again. It more than doubles the result. A handy shortcut is the rule of 72: money doubles in roughly \(72 / r\) years (at 10%, about 7.2 years).
2.3 Asset classes
An asset class is a group of investments with similar risk and return behaviour. Varsity lists four main ones for Indian investors:
| Asset class | Examples | Return driver | Main risks |
|---|---|---|---|
| Fixed income | Bank FDs, G-Secs/T-bills, PSU and corporate bonds | Interest | Inflation, taxation, credit default (corporate bonds), interest-rate changes |
| Equity | Shares of listed companies, equity ETFs/mutual funds | Earnings growth and dividends | Large drawdowns, company-specific failure, no capital guarantee |
| Real estate | Flats, plots, commercial property, REITs | Rent and price appreciation | Illiquid, large ticket size, legal complexity, uneven returns |
| Commodities (bullion) | Gold/silver ETFs, physical gold | Price change only, no cash flow | Long flat periods, currency moves |
Here is what actually happened to ₹1 lakh put into each over the last decade, using the course data. NIFTYBEES and GOLDBEES are exchange-traded funds (ETFs): funds that trade on the exchange like a share and simply track the Nifty 50 or the price of gold, so they are the easiest way for an ordinary investor to own the asset class.
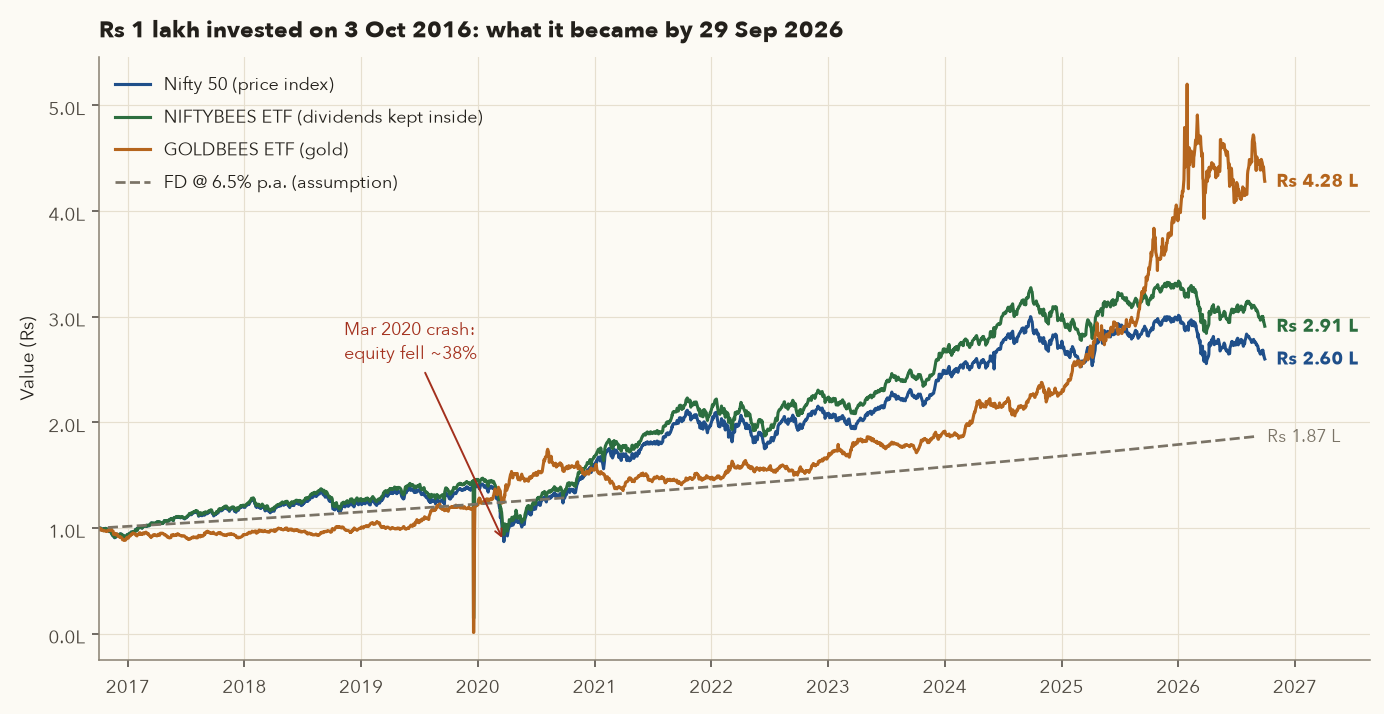
Varsity notes that equities have historically delivered the best long-run returns. Over this particular 10-year window, gold did better (15.67% vs 11.29% a year), mostly because of a very strong 2024–26 gold rally: GOLDBEES rose 25.80% in the 12 months to 29 Sep 2026 while the Nifty fell 7.79% (−8.09% if you measure to 30 Sep, as Section 9 does). The lessons are that asset-class returns depend heavily on the start and end dates, that the leader changes from one decade to the next, and that no single asset class should hold all your money. Spreading money across asset classes is called asset allocation. A common starting point for a young investor is a mostly-equity mix with some gold and fixed income, adjusted for age, goals and risk tolerance. Equity also showed the deepest falls on the way, so you need the stomach to sit through them.
The Nifty 50 number you see quoted is a price index: it ignores dividends. NSE also publishes a Total Return Index (TRI) that reinvests them. Per NSE's 30 Sep 2026 factsheet, the Nifty 50's 5-year CAGR was 5.13% on price but 6.38% on total return. Compare your portfolio, which receives dividends, with the TRI, not the price index.
3. Measuring returns: absolute, annualised, CAGR
Varsity's rule: use absolute return for holding periods of up to a year, and CAGR to compare anything longer.
- \(V_{start}\)
- The value when you bought: a price, an index level or a portfolio value (₹ or points).
- \(V_{end}\)
- The value at the end of the holding period (or today, if you still hold), in the same units.
- \(R_{abs}\)
- Absolute return: the total gain or loss over the whole holding period, in %. It ignores how long you held.
How it works: dividing the end value by the start value gives the growth multiple (1.28 means 1.28 times). Subtract 1 to keep just the gain, and multiply by 100 to turn it into a percentage. A result of 28 means the value is 28% above where it started; a negative result is a loss.
- \(V_{start}, V_{end}\)
- The start and end values, as in the absolute-return formula above.
- \(n\)
- Years held: the number of calendar days between the two dates divided by 365.25 (the extra quarter day allows for leap years). Six months is about 0.5.
- \(CAGR\)
- The steady yearly return that would turn \(V_{start}\) into \(V_{end}\), as a decimal (0.0513 = 5.13% a year).
How it works: \(V_{end}/V_{start}\) is the total growth multiple. Raising it to the power \(1/n\) takes its \(n\)-th root, which splits the multiple into \(n\) equal yearly steps. Subtract 1 to get the yearly rate. It is the future-value formula of Section 2.2 run backwards.
Why CAGR? An absolute return of 28% means very different things over one year and over five. CAGR answers the question: "What constant yearly rate would have turned my start value into my end value?" That makes investments of different lengths comparable. It is a smoothed figure. The real path was bumpy, and CAGR hides that (Section 9 shows the bumps).
"Up 28%" sounds fine. Is it?
- Start (last close on or before 30 Sep 2021): 17,618.15. End (30 Sep 2026): 22,620.45.
- Absolute: \( (22620.45 / 17618.15 - 1) \times 100 = 28.39\% \).
- CAGR over 5 years: \( (22620.45/17618.15)^{1/5} - 1 = 5.13\% \) a year, which matches NSE's own factsheet figure.
- Verdict: over these five years the index did no better than a fixed deposit: 5.13% a year on price (6.38% with dividends) against 6.5% before tax for the FD in Section 2.1. Only after tax, for someone in the 30% slab, does equity edge ahead. Starting 10 years back (8,738.10 on 3 Oct 2016) gives \( (22620.45/8738.10)^{1/9.99} - 1 = 9.99\% \). Your start date shapes your experience.
17.16% in six months
- Varsity's example: buy at 3,030, sell at 3,550 → absolute \( 3550/3030 - 1 = 17.16\% \).
- If that took 2 years: CAGR \( = (3550/3030)^{1/2} - 1 = 8.24\% \).
- If it took 6 months, simple annualisation gives \( 17.16\% \times 2 = 34.32\% \). Compounded annualisation \( (1.1716)^{2} - 1 = 37.27\% \) assumes you could repeat the trade, which is a strong assumption. Annualising a short, lucky trade inflates it. Use annualised figures to compare opportunities, not to forecast.
Rule of 72 check: the Nifty first closed above double its Oct 2016 level (17,519.45) on 15 Sep 2021, about 4.95 years later. That implies roughly 15% a year over that stretch (72 / 4.95 ≈ 14.5), much faster than its full-decade 9.99%.
4. The market ecosystem: SEBI, exchanges, clearing, depositories, brokers
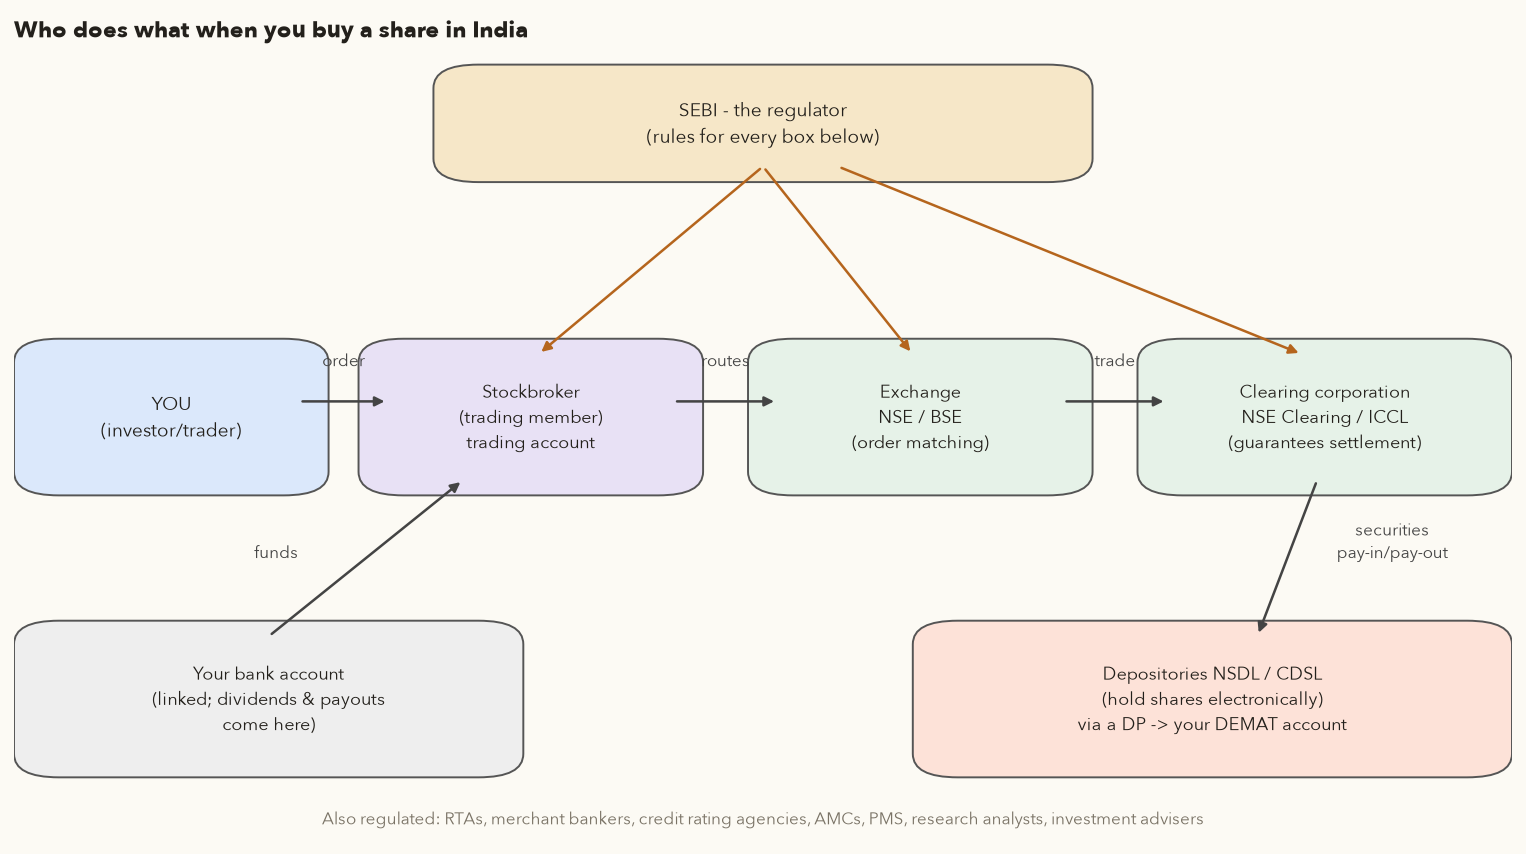
A stock market is an electronic marketplace where buyers and sellers of securities meet. India has two main national stock exchanges, the National Stock Exchange (NSE) and BSE (formerly the Bombay Stock Exchange). A third, the Metropolitan Stock Exchange (MSE), has negligible equity volume, and the old regional exchanges such as Bangalore, Madras and Calcutta have shut down. This course uses NSE data throughout. You cannot trade on an exchange directly. You go through a registered stockbroker, and a group of regulated intermediaries works behind the scenes on every trade.
| Entity | Examples | What it does for you |
|---|---|---|
| SEBI (Securities and Exchange Board of India) | The regulator | Writes the rules for exchanges, brokers, listed companies, mutual funds and others; protects investors; punishes manipulation and insider trading. Complaints go to SEBI's SCORES portal after the intermediary's own grievance desk. |
| Stock exchanges | NSE, BSE | Run the order-matching engine, list companies, set trading rules and price bands, publish prices and indices. |
| Clearing corporations | NSE Clearing Ltd (NSE), Indian Clearing Corporation Ltd (BSE) | Step in between buyer and seller (novation) and guarantee settlement: if the other side's broker defaults, the trade still settles (in the rare case of a seller failing to deliver, through an exchange auction or a cash close-out). They also run the margin system for F&O (futures and options, the derivatives segment covered in Chapters 9–10). |
| Depositories | NSDL, CDSL | Hold your shares electronically in a demat (dematerialised) account. India's paper-share era ended in the late 1990s, prompted partly by the frauds of the early 90s. Together they serviced about 23 crore demat accounts by mid-2026. |
| Depository Participant (DP) | Most brokers and banks (Zerodha is a CDSL DP) | Your agent with the depository. You open and operate a demat account through a DP, never directly with NSDL/CDSL. |
| Stockbroker (trading member) | Zerodha, Upstox, Groww, ICICI Securities, Fyers… | Gives you a trading account and terminal, checks your funds and margin through its risk-management system (RMS), sends orders to the exchange, issues contract notes, collects charges. |
| Banks | Your savings bank | Move money to and from your trading account. Withdrawals and dividends go to your primary linked account. |
| RTAs (registrars) | KFin, MUFG Intime (formerly Link Intime), CAMS | Keep companies' shareholder registers, process IPO allotments and pay dividends. |
| Other regulated intermediaries | Merchant bankers, credit rating agencies (CRISIL, ICRA, CARE), debenture trustees, AMCs, PMS, research analysts, investment advisers | Run IPOs, rate debt, protect bondholders, manage pooled money and give advice. All need SEBI registration. Check the registration number before you trust anyone's tips. |
When you "buy Infosys", the trading account handles the transaction, the demat account receives the shares, and the bank account supplies the money. Selling reverses the flow. Most brokers open all three links in one onboarding (KYC, PAN, Aadhaar, bank proof, nominee).
In your framework: the course framework's framework.data.load_ohlc(symbol) reads the same NSE price history used in this chapter. update_ohlc(symbols) refreshes it.
5. Who trades: retail, FPIs, DIIs, and where you fit
Every trade has a buyer and a seller with opposite views. In Varsity's words, "different opinions make a market". The main participant groups:
- Domestic retail investors: individuals like you, including HNIs (high-net-worth individuals).
- NRIs/OCIs: Indians living abroad, investing under separate rules.
- Domestic Institutional Investors (DIIs): mutual funds (fed by SIPs, the fixed monthly investments millions of savers make), insurance companies, banks, pension funds (EPFO, NPS).
- Foreign Portfolio Investors (FPIs, often still called FIIs): foreign funds, pension funds and sovereign funds.
- Promoters: founders, parent companies or the government that control a company. They are owners rather than traders, but their buying, selling and pledging moves prices.
FPIs and DIIs move huge sums, so their net flows are watched daily (NSE publishes provisional FII/DII cash-market figures every evening). Recent reality: FPIs were net sellers of roughly ₹1.66 lakh crore of Indian equities in calendar 2025 and pulled out about ₹1.92 lakh crore more in Jan–Apr 2026, while DIIs, powered by SIP flows, put a record of over ₹6 lakh crore into equities in 2025 (Business Standard, citing NSDL/BSE data). That domestic tug-of-war is a big part of why the market fell only moderately rather than crashing.
Who owns what
| Holder | HDFC Bank | Coal India | ITC |
|---|---|---|---|
| Promoters | 0.00% | 61.13% | 0.00% |
| FIIs/FPIs | 41.82% | 10.37% | 34.23% |
| DIIs | 41.75% | 22.20% | 49.13% |
| Government | 0.18% | 0.10% | 0.04% |
| Public (incl. retail) | 16.27% | 6.18% | 16.61% |
HDFC Bank's FPI holding fell from 47.67% (Dec 2025) to 41.82% (Jun 2026) while DIIs rose from 37.00% to 41.75%. That is the 2026 FPI-selling story inside a single stock. Coal India's 61.13% government promoter stake matters for index weighting (Section 8).
5.1 Traders vs investors: where do you fit?
| Style | Holding period | What they need most |
|---|---|---|
| Scalper / day trader | Minutes to hours, flat by close | Speed, liquidity, depth, very low costs. Not this course's focus. |
| Swing trader | Days to a few weeks | Technical setups, stop-losses that survive gaps, cost control (Ch 2–5, 11) |
| Positional trader | Weeks to months, sometimes via futures | Trend following, position sizing, futures mechanics (Ch 4–5, 9, 12) |
| Growth investor | Years | Businesses riding long industry trends (Ch 6–8) |
| Value investor | Years | Good businesses temporarily cheap, e.g. the March 2020 crash (Ch 6–8) |
6. The primary market: how companies list (IPOs)
6.1 From idea to IPO
Varsity tells the story of a T-shirt start-up to show why companies go public. The funding ladder usually looks like this:
- Seed / angel round. The founder, friends or angel investors put in, say, ₹5 crore. Shares are issued at a face value (e.g. ₹10 each, so 50 lakh shares). Face value is just an accounting unit, not what the share is worth.
- Series A (venture capital). The business has revenue and needs to expand. VCs invest at a higher valuation. The founder's percentage is diluted, but the stake is worth more.
- Series B, bank debt, internal accruals. Capex is funded from a mix of retained profits, new equity and loans. Debt brings interest costs.
- Private equity (Series C+). Larger cheques, mature business, PE nominee on the board.
- IPO. When the capital need is large, early investors want an exit, or the company wants visibility and liquid ESOPs, it offers shares to the public for the first time: the Initial Public Offering.
The IPO happens in the primary market, where the company or its existing shareholders sell to new investors. Once listed, shares trade between investors in the secondary market, and the company receives nothing from those trades.
6.2 The IPO process
- Appoint merchant bankers (Book Running Lead Managers, BRLMs). They do due diligence, draft documents, help set the price band, market the issue (roadshows) and coordinate registrars, bankers and advertisers.
- File the DRHP (Draft Red Herring Prospectus) with SEBI. It covers the business, financials, risks, management, objects of the issue (what the money is for) and who is selling.
- SEBI observations, then the RHP with a price band (e.g. ₹1,080–1,140) and lot size.
- Anchor investors (large institutions) are allotted shares a day before the issue opens, with a lock-in.
- Book building: for usually 3 working days, investors bid within the band. Retail investors apply through ASBA (Application Supported by Blocked Amount, now usually via a UPI mandate). Money is blocked, not debited, until allotment.
- Price discovery: the final issue price is usually set at the top of the band when demand is strong. Retail investors can bid at the "cut-off" price.
- Allotment and listing in T+3 working days after the issue closes (SEBI's timeline since Dec 2023). Oversubscribed retail categories are allotted by lottery, at least one lot per successful applicant.
- Listing day: a special pre-open call auction (9:00–9:45 am order entry, then matching) discovers the opening price, and normal trading starts at 10:00 am.
Investor categories in a typical book-built issue by a profitable company: QIBs (qualified institutional buyers) up to 50%, NIIs (non-institutional, above ₹2 lakh) at least 15%, and Retail Individual Investors (RIIs, up to ₹2 lakh per application) at least 35%. Jargon: oversubscribed 50× = bids for 50 times the shares on offer. Undersubscribed = less demand than supply. If subscription falls below the minimum, the issue fails and money is unblocked. Green-shoe = an option to allot about 15% extra if demand is strong. Fixed-price issue = a single price instead of a band. Fresh issue = new shares, so money goes to the company. Offer for Sale (OFS) = existing holders sell, so money goes to them and the company gets nothing.
After listing, a company or its promoters can raise or unlock money through: a FPO (follow-on public offer: a second public issue with a prospectus, now rare), an OFS through the exchange (promoters sell existing shares through a special exchange window over 1–2 days at or above a floor price; common for government disinvestment), or a rights issue (new shares offered only to existing holders, Section 15).
A blockbuster listing where the company received nothing
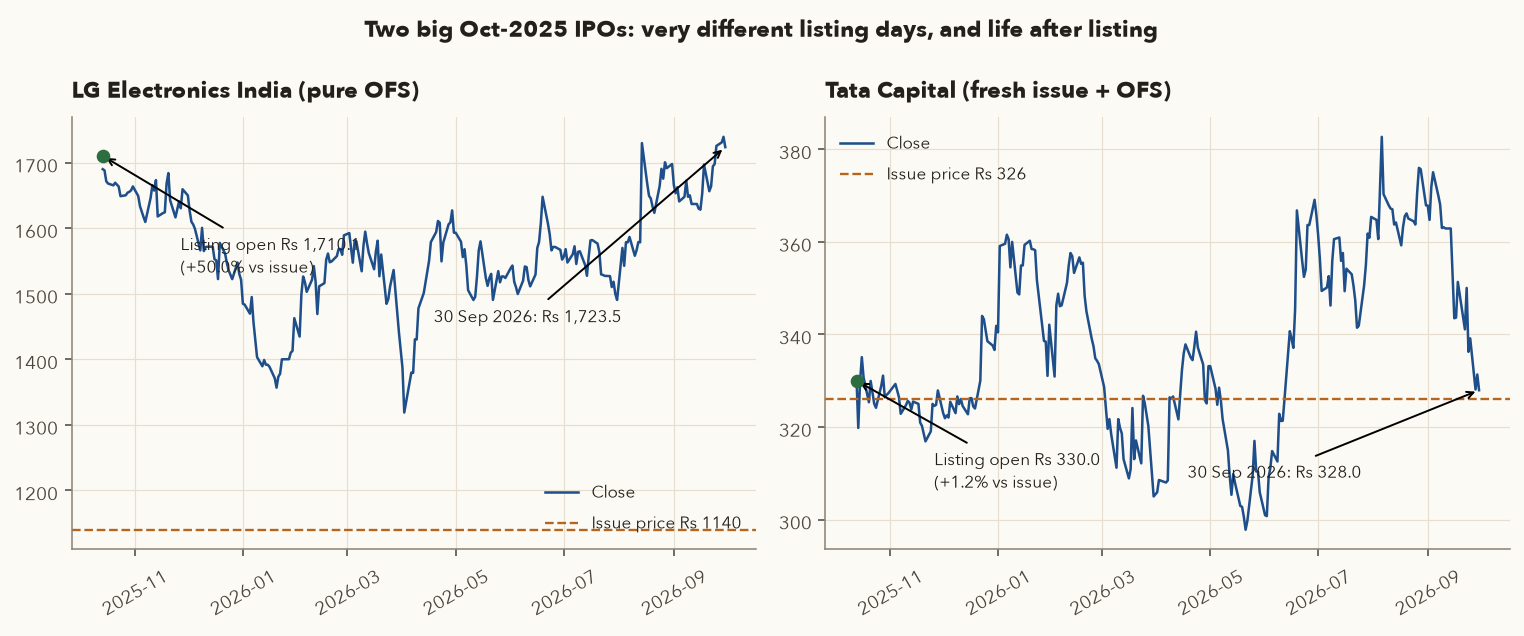
- Issue: 7–9 Oct 2025, price band ₹1,080–1,140, issue size about ₹11,607 crore. 100% OFS: the Korean parent sold about 15% of its stake, so LG Electronics India itself raised nothing. Lot size 13 shares → one lot cost \( 13 \times 1140 = \text{₹}14{,}820 \).
- Demand on the final day: QIB about 166.5×, NII about 22.4×, retail about 3.55× (about 54× overall).
- Retail odds: at 3.55× retail subscription, and with most applicants bidding one lot, roughly \( 1/3.55 \approx 28\% \) of retail applicants could expect an allotment.
- Listing, 14 Oct 2025: opened at ₹1,710.10 → listing gain \( (1710.10/1140 - 1) = 50.01\% \), i.e. ₹7,411 per lot. Day-1 close ₹1,689.90.
- Afterwards: the stock fell to a closing low of ₹1,318.80 before recovering to ₹1,723.50 on 30 Sep 2026, which is +51.18% vs the issue price but only +0.78% for someone who bought at the listing-day open. The Nifty fell 10.33% over the same period.
The biggest NBFC IPO, and a flat listing
- Issue: 6–8 Oct 2025, price band ₹310–326, size about ₹15,512 crore: a fresh issue of 21 crore shares (money to the company, to grow its loan book) plus an OFS of 26.58 crore shares by Tata Sons and IFC. Subscribed about 2× overall.
- Listing, 13 Oct 2025: opened at ₹330.00, only +1.23% over ₹326. Next day it closed at ₹319.80, below the issue price.
- 30 Sep 2026: ₹327.95, +0.60% after almost a year, with closes ranging from ₹297.80 (21 May 2026) to ₹382.70 (6 Aug 2026) in between.
Of 38 mainboard listings in Jan–Sep 2026, about 15 listed below the issue price (ipoplatform.com tally). Read the RHP's "Objects of the Issue": a pure OFS means insiders are cashing out. That is not necessarily bad, but no new money goes into the business. Price relative to peers (Chapter 8) matters more than hype or grey-market premiums.
7. The secondary market: what moves prices
After listing, a stock's price moves because buyers and sellers keep updating their expectations about the company's future cash flows, and because of plain demand and supply. Varsity's Infosys example: good news (a new CEO) means buyers accept whatever sellers ask, and the price ticks up 3,000 → 3,002 → 3,006 → 3,011 → 3,016. Industry-wide bad news (IT budgets cut) then hits all IT stocks together. Large, widely held companies move every day even without news. Thinly traded small companies can sit still.
7.1 Events every participant should track
| Event | What it is | Current reading (as of Sep 2026) | Typical market logic |
|---|---|---|---|
| RBI monetary policy | The Monetary Policy Committee (MPC) sets the repo rate (RBI's lending rate to banks), plus reverse repo/SDF and CRR | Repo 5.25% (cut in Dec 2025, held on 5 Aug 2026); next meeting 5–7 Oct 2026 | Rate cuts make borrowing cheaper and help growth (banks, autos, real estate react first). Hikes do the opposite. |
| Inflation (CPI, WPI) | MoSPI publishes CPI around the 12th of each month | CPI 4.82% (Aug 2026), highest since Dec 2024 | Rising inflation lowers the chance of rate cuts |
| IIP and PMI | Industrial output index; survey-based PMI (above 50 = expansion) | Monthly | Signals the economic cycle |
| Union Budget | 1 Feb each year: taxes, spending, policy | Budget 2026 raised STT (Securities Transaction Tax, Section 17) on futures to 0.05% and options to 0.15% (from 1 Apr 2026) | Sector-specific moves (e.g. ITC on tobacco duty) |
| Quarterly results | Q1 (Apr–Jun) reported Jul–Aug, Q2 Oct–Nov, Q3 Jan–Feb, Q4 Apr–May | Q2 FY27 season starts mid-Oct 2026 | Price reacts to results versus expectations, not to the absolute numbers |
| Non-financial events | Pandemics, wars, elections, governance shocks | See HDFC Bank, Mar 2026 (Section 11) | Sudden repricing, gaps |
8. Indices: Nifty 50, Bank Nifty and free-float weighting
8.1 What an index is and what it's for
India has thousands of listed companies. An index tracks a selected basket to summarise "how the market did", much as checking a few key junctions tells you how a city's traffic is moving. The Nifty 50 (NSE, 50 large liquid stocks, maintained by NSE Indices Ltd) and the BSE Sensex (30 stocks) are the headline indices. Nifty Bank (Bank Nifty) tracks banks, and Nifty IT tracks IT companies. Varsity lists four uses:
- Information: a quick read on overall sentiment.
- Benchmarking: a 20% return sounds great until the index did 30%. You should judge every strategy in this course against a benchmark.
- Trading: taking a view on the whole market through index futures and options (Chapters 9–10).
- Hedging: protecting a portfolio with index derivatives (Chapter 10).
8.2 How it is built: free-float market capitalisation
Each stock's weight is proportional to its free-float market cap: the market value of only those shares that are actually available to trade. Promoter, government and other strategic holdings are excluded through an Investible Weight Factor (IWF).
- \(i\)
- One stock in the index (for the Nifty 50, \(i\) runs over the 50 stocks). \(\sum_i\) means "add up over every stock in the index" (\(\Sigma\) is the Greek capital S, for "sum"). \(j\) does the same job inside the weight formula.
- \(P_i\)
- Stock \(i\)'s share price, in ₹.
- \(\text{Shares}_i\)
- The total number of shares the company has issued.
- \(IWF_i\)
- Investible Weight Factor: the fraction of those shares that is free to trade, between 0 and 1 (0.50 means half are locked up with promoters, government or other strategic holders).
- \(FFMC_i\)
- Free-float market cap of stock \(i\), in ₹. The extra subscript \(t\) means "on day \(t\)".
- \(\text{Base FFMC}\)
- The total free-float market cap of the index stocks on the base date. In practice it acts as a divisor that is adjusted for constituent changes and corporate actions.
- \(\text{Base value}\)
- The index level chosen for the base date (1,000 for the Nifty 50, on 3 Nov 1995).
- \(\text{Index}_t\)
- The index level on day \(t\). \(\text{Index}_{t-1}\) is the level on the previous trading day.
- \(w_i\)
- Stock \(i\)'s weight: its share of the total free-float market cap, as a fraction (all weights add up to 1).
- \(r_i\)
- Stock \(i\)'s return for the day, as a decimal (+10% = 0.10).
- \(\Delta\text{Index}\)
- The change in the index, in points, from day \(t-1\) to day \(t\) (\(\Delta\) means "change in").
- For each stock, multiply price × shares × IWF to get its free-float market cap.
- Add up the free-float market caps of all the stocks, divide by the base-date total and multiply by the base value. If the total free-float value is 2% higher than at the base, the index is 2% above its base value.
- A stock's weight is its free-float market cap divided by the total. To see how one day's moves change the index, multiply each stock's return by its weight, add these up and multiply by yesterday's index level. A 10% move in a stock with a 10% weight moves the index about 1%.
The logic: an index should reflect what investors can actually buy. A company whose government holds 61% has far fewer shares in public hands than its total market cap suggests. Weighting by free float also lets index funds hold the index without becoming dominant owners of thinly floated stocks. The base value (1,000 for the Nifty 50, base date 3 Nov 1995) only sets the starting scale, and the divisor is adjusted for constituent changes and corporate actions so that the index doesn't jump artificially.
Weights, and how one stock moves the index
- Stock A: price ₹100, 1 crore shares, IWF 0.50 → FFMC = ₹50 crore. Stock B: ₹250, 40 lakh shares, IWF 0.90 → ₹90 crore. Stock C: ₹40, 5 crore shares, IWF 0.25 → ₹50 crore.
- Total FFMC = ₹190 crore. Weights: A 26.32%, B 47.37%, C 26.32%. Set base value 1,000.
- Stock A rises 10% to ₹110 → its FFMC becomes ₹55 crore, the total ₹195 crore, and the index \( 195/190 \times 1000 = 1026.32 \).
- Check with the weights: \( 26.32\% \times 10\% = 2.63\% \) of 1,000 = 26.32 points. ✓
Why the free float matters
- Coal India full market cap ₹2,59,478 cr; government/promoter holding 61.13% → free float ≈ \( 2{,}59{,}478 \times (1 - 0.6113) = \text{₹}1{,}00{,}859 \) cr.
- HDFC Bank full market cap ₹11,10,422 cr; promoter holding 0% → free float ≈ the full ₹11,10,422 cr.
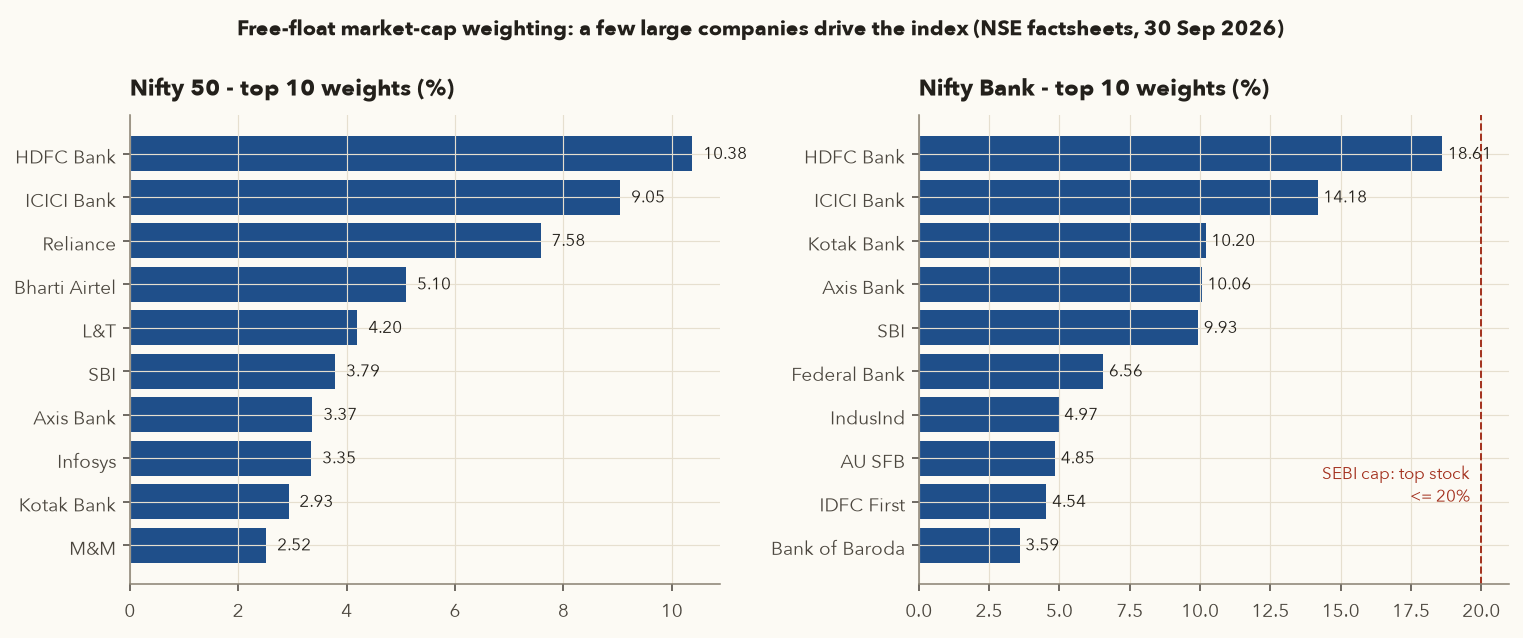
- By total market cap Coal India is 23.37% of HDFC Bank's size. By free float it is only 9.08%. In the index, HDFC Bank therefore counts for about 11 times as much as Coal India, not about 4 times. (NSE's exact IWF also excludes some other locked-in holdings. This is an approximation.)
8.3 Eligibility, rebalancing and caps
- Nifty 50 eligibility (NSE methodology): the stock must be in the F&O segment; its average impact cost (the extra price a large order pays, Section 13) must be ≤ 0.50% for 90% of observations over six months for a ₹10 crore basket (a liquidity test); it needs at least one month of listing history; selection is by free-float market cap.
- Rebalancing: semi-annual, using six-month average data up to cut-offs of 31 Jan and 31 Jul. Changes take effect on the last working day of March and September, with four weeks' notice.
- Concentration caps: after a SEBI framework for non-benchmark indices with derivatives, Nifty Bank was expanded from 12 to 14 stocks and phased (Dec 2025 – Mar 2026) to cap the top stock at 20% and the top three at 45%. On 30 Sep 2026 HDFC Bank's weight was 18.61% and the top three totalled 42.99%, both inside the caps.
BSE in, Wipro out
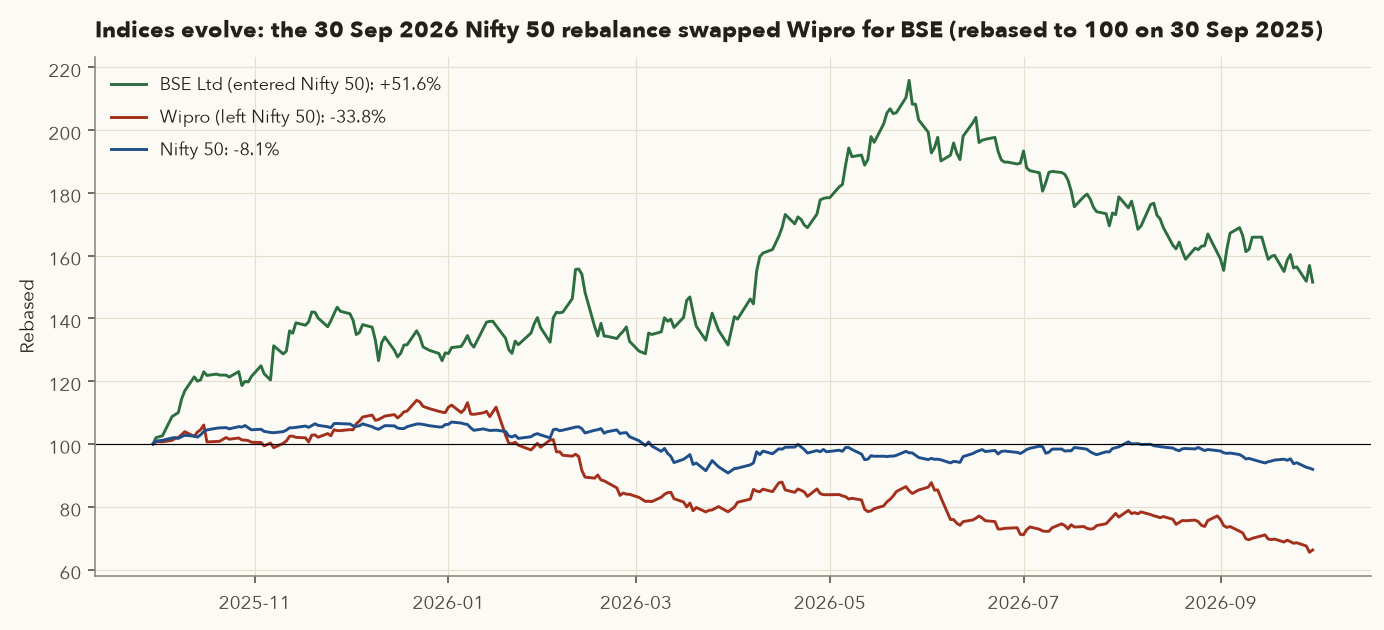
In the September 2026 review, BSE Ltd (six-month average free-float market cap about ₹1,40,879 crore) replaced Wipro in the Nifty 50 from 30 Sep 2026. Over the preceding year BSE rose 51.55% while Wipro fell 33.78% and the Nifty fell 8.09%. An index is a living list that quietly drops losers and adds winners, which is one reason it is hard to beat.
Which heavyweights moved the index today?
Nifty prior close 22,716.20 and close 22,620.45: change −95.75 points. Approximate contribution = weight × stock return × previous index level (weights from the same-day factsheet):
| Stock | Weight | Day return | ≈ Points |
|---|---|---|---|
| HDFC Bank | 10.38% | −1.937% | −45.7 |
| ICICI Bank | 9.05% | +2.283% | +46.9 |
| Reliance | 7.58% | +0.423% | +7.3 |
| Bharti Airtel | 5.10% | −0.802% | −9.3 |
| L&T | 4.20% | +0.291% | +2.8 |
| SBI | 3.79% | −0.539% | −4.6 |
| Axis Bank | 3.37% | +1.147% | +8.8 |
| Infosys | 3.35% | −2.098% | −16.0 |
| Kotak Bank | 2.93% | +2.709% | +18.0 |
| Sum of these nine | 49.75% | +8.2 |
Worked line for HDFC Bank: \( 0.1038 \times (-0.01937) \times 22716.20 = -45.7 \) points. The interesting part is that these nine of the ten biggest stocks together added about 8 points, yet the index fell 96. The other 41 stocks did the damage. The index captures breadth as well as heavyweights.
9. Benchmark returns: 10 years of Nifty, honestly measured
A drawdown is the percentage fall from the highest value reached so far. It is how losses actually feel while you live through them. Market slang builds on it: a bull market is a sustained rise, and a bear market is commonly defined as a fall of 20% or more from the peak. A 10–20% fall is usually called a correction, which is where the Nifty sits today.
- \(P_t\)
- The price or portfolio value on day \(t\) (index points or ₹).
- \(\max_{s \le t} P_s\)
- The running peak: the highest value on any day \(s\) up to and including day \(t\). "max" means "the largest of".
- \(DD_t\)
- The drawdown on day \(t\), as a decimal. It is 0 on a day that sets a new high and negative on every other day (−0.14 = 14% below the peak).
- \(\text{Max DD}\)
- Maximum drawdown: the worst (most negative) daily drawdown over the whole period, the deepest peak-to-trough fall. "\(\min_t\)" means "the smallest value over all days \(t\)".
- Go through the data day by day and keep note of the highest value so far.
- Each day, divide that day's value by the running peak and subtract 1. That is the day's drawdown.
- The lowest of all the daily drawdowns is the maximum drawdown.
Example: the Nifty closed at 22,620.45 on 30 Sep 2026. Its running peak was the 26,328.55 close of 2 Jan 2026, so \(DD = 22620.45 / 26328.55 - 1 = -14.08\%\). The deepest drawdown in the 10-year data was the COVID crash: \(7610.25 / 12362.30 - 1 = -38.44\%\), so that is the Nifty's maximum drawdown here.
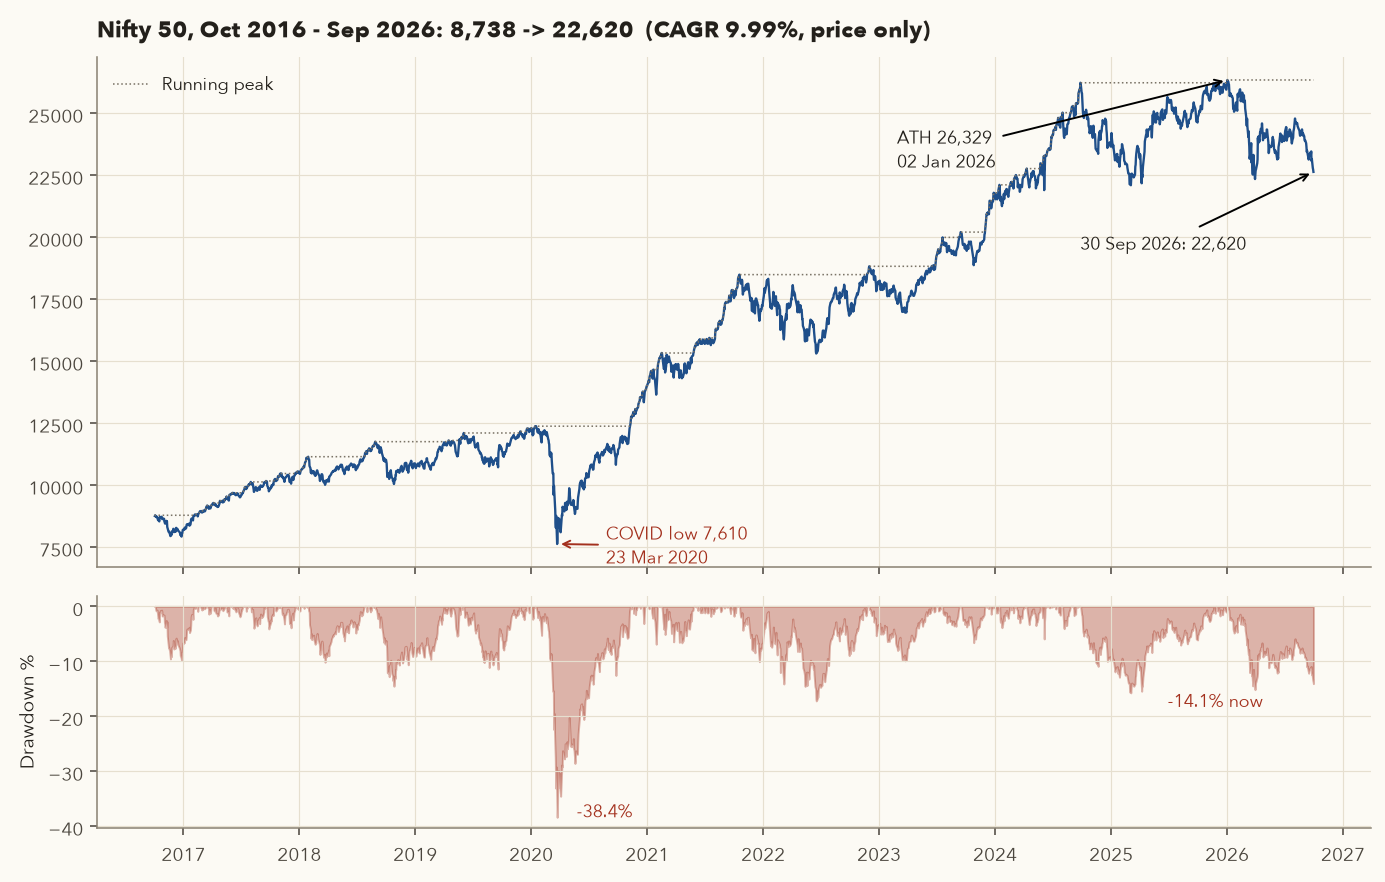
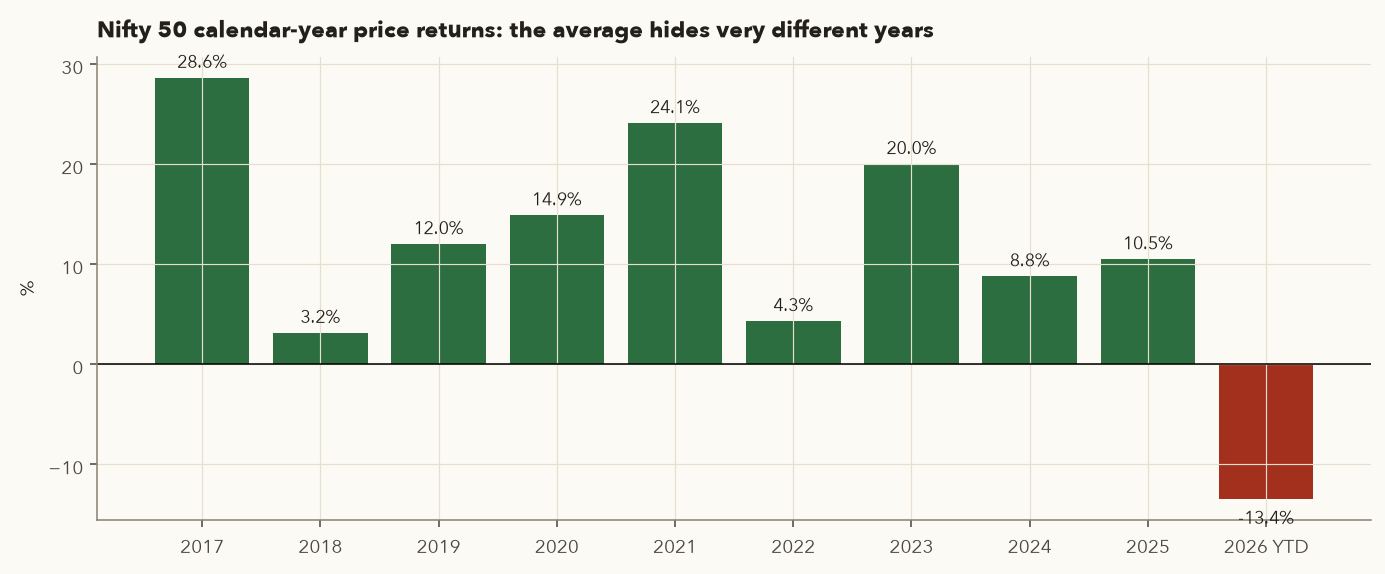
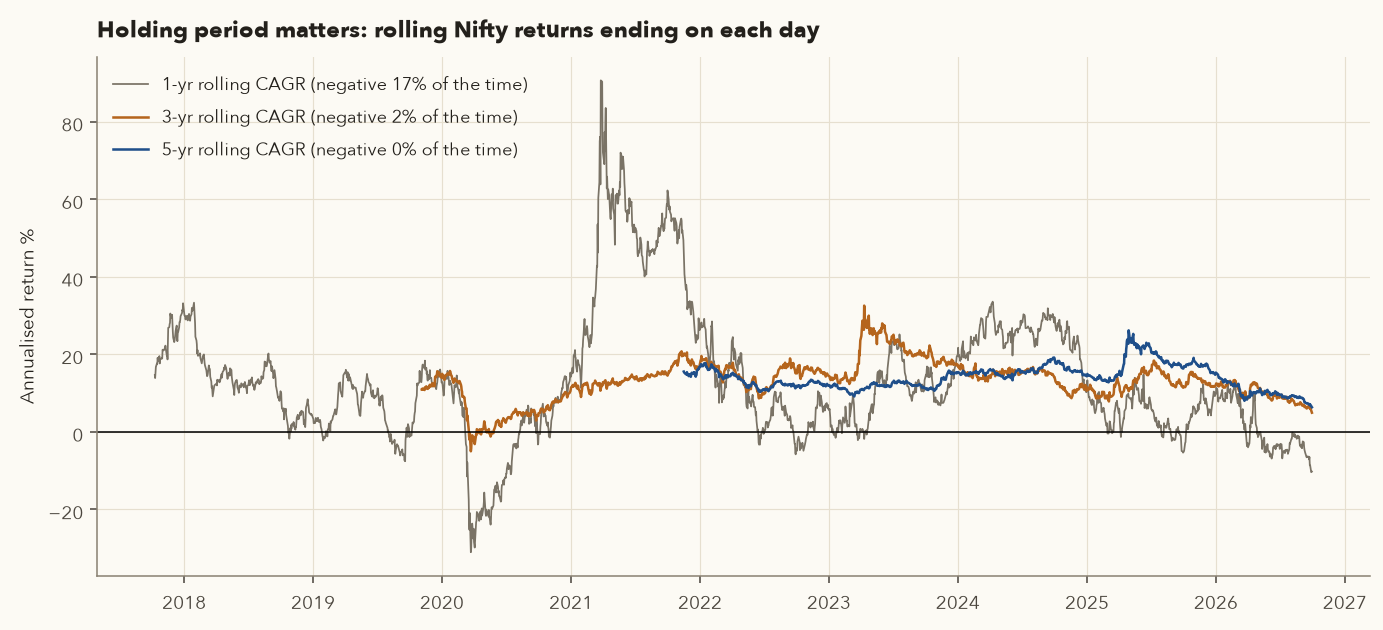
Equity rewards time in the market, but only on average and only over long periods. The three most recent years (2024–2026) are all among the decade's five weakest: the 1-year return to 30 Sep 2026 is −8.09%, and 3-year and 5-year CAGRs are only 4.83% and 5.13%. If you plan to invest, plan for a 30–40% fall at some point. If you plan to trade, your strategy must beat simply holding the Nifty after costs and taxes, or it is not worth the effort. The framework function framework.risk.max_drawdown computes the same statistic for any equity curve.
10. How a trade flows: order to T+1 settlement
- Order entry: you log in to the terminal (user ID + password + TOTP, a time-based one-time code from an authenticator app; SEBI requires two-factor login) and place an order: symbol, exchange, quantity, price/order type, product type.
- Broker RMS check: the broker verifies funds or margin (for a buy) or holdings (for a delivery sell) before forwarding. Insufficient funds means a rejection.
- Exchange matching: the exchange's order book matches buy and sell orders by price-time priority: the best price first, and among equal prices, the earliest order first. A match creates a trade. You may be filled by one seller or by many.
- Contract note: by the end of T day the broker emails a contract note listing every trade and every charge. Keep it, because it is your legal record for tax.
- Clearing: the clearing corporation becomes the counterparty to both sides (novation), nets everyone's obligations, and guarantees settlement.
- Settlement on T+1: buyers' funds and sellers' shares are paid in, and shares and funds are paid out. A Monday buy shows in your demat on Tuesday. India moved fully to T+1 in January 2023, one of the first major markets to do so. An optional T+0 cycle also exists for a limited set of stocks through participating brokers, but T+1 remains the standard.
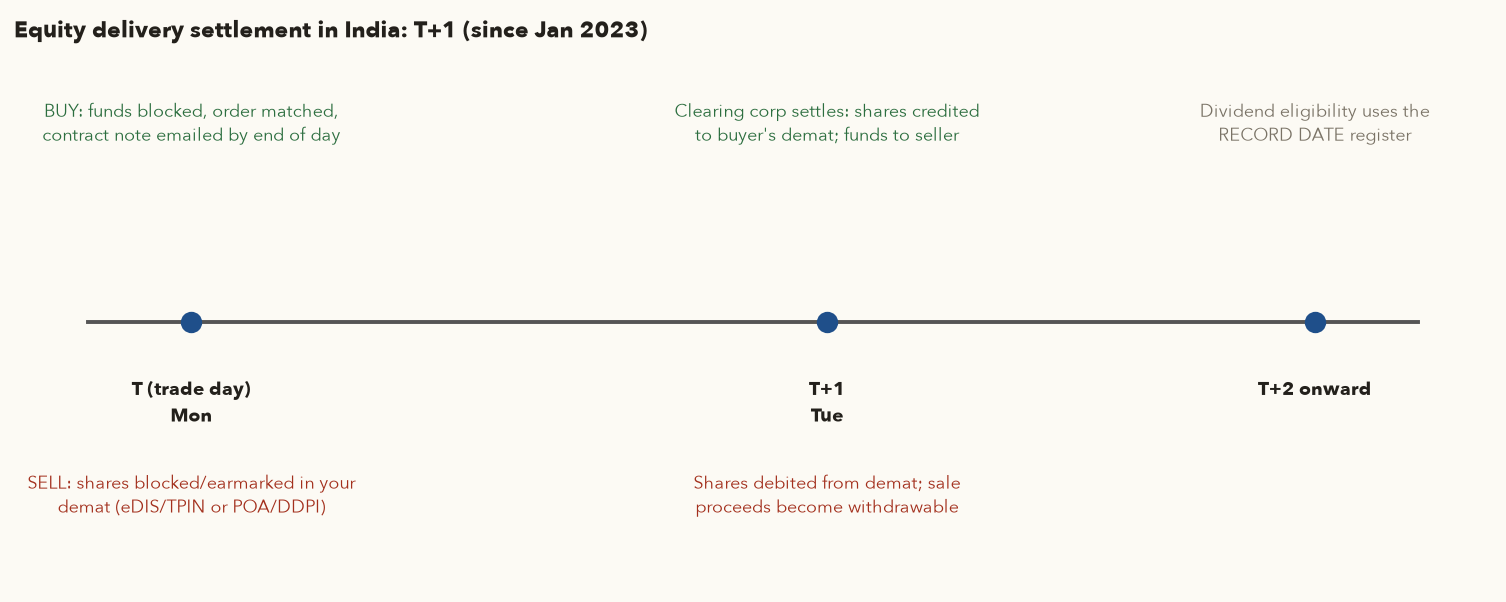
Selling from demat: you must authorise the debit, either through a CDSL/NSDL eDIS (TPIN/OTP) step or a standing DDPI (which replaced the old POA). Shares are earmarked (blocked) in your own demat rather than moved to the broker's pool account, a SEBI safeguard in force since Nov 2022. You can also sell on Tuesday shares bought on Monday, before they are credited to your demat. This is called BTST (buy today, sell tomorrow), and it carries a small risk: if your seller fails to deliver, you cannot deliver to your buyer either, and the exchange auctions or closes out the shortfall at a penalty price.
Because settlement is T+1, the ex-date now normally equals the record date. To receive a dividend or bonus you must buy before the ex-date, i.e. by the close of the previous trading day (Section 15).
11. Order types: market, limit, SL, SL-M, GTT, AMO
| Order | What you specify | Executes when | Trade-off |
|---|---|---|---|
| Market | Quantity only | Immediately, at the best available prices | Certain to fill (if liquid), uncertain price. Brokers now attach market protection: Zerodha's Kite turns market orders into limit orders a set % away from the price, so an unfilled remainder rests as a limit order instead of filling at a wild price. |
| Limit | Price (max to buy / min to sell) | Only at your price or better | Price control, but may never fill |
| SL (stop-loss limit) | Trigger price + limit price | Becomes a limit order once the LTP (last traded price) touches the trigger | Controls slippage, but can stay unfilled if price gaps through the limit |
| SL-M (stop-loss market) | Trigger price | Becomes a market order once triggered | Gets you out, at whatever price is available (with market protection) |
| GTT (Good Till Triggered, broker feature) | Trigger(s) + limit price; single or OCO | Broker places a limit order when the trigger hits; valid up to 1 year at Zerodha | Great for swing and positional stops and targets that outlive one session. OCO (one-cancels-other) sets a stop and a target together. Not exchange-guaranteed: it is a broker-side trigger. |
| AMO (After-Market Order) | Any regular order, placed outside market hours | Sent to the exchange at the next open (at Zerodha, roughly from after the close until just before the 9:00 am pre-open; the exact window varies by broker) | Convenient for people with day jobs. Market AMOs can fill at a gap-open price. |
Other validity and quantity options: DAY (default: cancelled at close if unfilled), IOC (immediate-or-cancel), disclosed quantity (shows only part of a large order), and iceberg orders (the broker slices a big order). Trigger rule for a long position's SL: the trigger is at or above the limit price, e.g. trigger 820, limit 819.
When a stop-loss "fails": the overnight gap
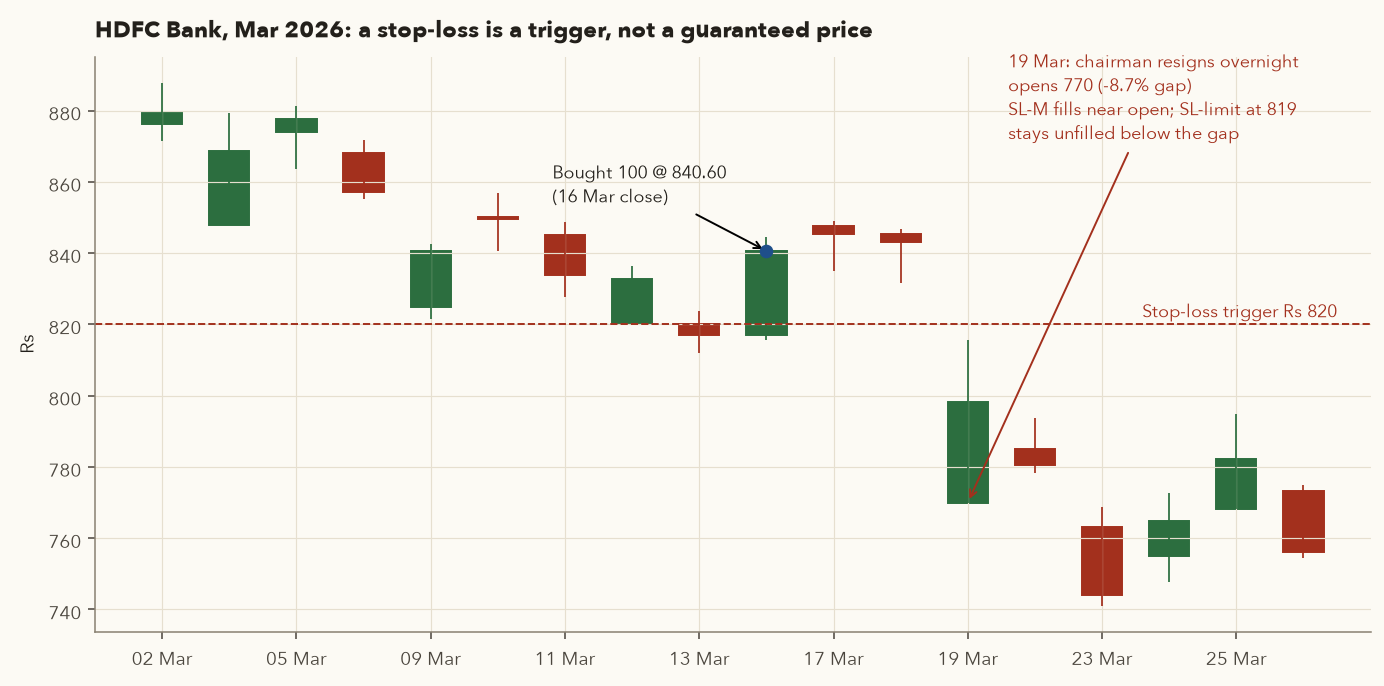
- Hypothetical swing trade: buy 100 HDFC Bank at the 16 Mar 2026 close, ₹840.60. Place a stop-loss with trigger ₹820. Planned risk = \( (840.60 - 820) \times 100 = \text{₹}2{,}060 \).
- On the evening of 18 Mar, the bank's part-time chairman resigned, citing differences over "values and ethics". The stock had closed at ₹843.05.
- 19 Mar: opened at ₹770.00, a −8.66% gap, straight through the stop. Volume was 4.96 times the previous month's average, and the Nifty fell 3.26% that day.
- SL-M (or a stop that triggers into a market order): fills near the open, say ₹770 → loss \( (840.60 - 770) \times 100 = \text{₹}7{,}060 \), 3.4 times the planned risk.
- SL-limit with limit 819: triggered, but the day's high was only ₹815.65, so the sell never filled. Holding on to the 23 Mar close of ₹744.15 meant a loss of ₹9,645.
- Lesson: a stop sets a trigger, not a guaranteed exit price. Overnight and news gaps are the main risk of swing trading. Size positions so that a gap of two to three times your stop distance is survivable (Chapter 11), and know which order type you are using.
12. Product types: CNC, MIS, NRML, MTF; long and short
The product type tells your broker how long you intend to hold the position and how it is funded. Names below are Zerodha's. Other brokers use similar labels ("Delivery", "Intraday", "Carry forward", "Pay later").
| Product | Segment | Meaning | Key rules |
|---|---|---|---|
| CNC (Cash & Carry) | Equity cash | Delivery: shares come into your demat | Full payment upfront. Hold as long as you like. This is what swing traders and investors use. |
| MIS (Margin Intraday Squareoff) | Equity, F&O | Intraday with leverage | Auto squared off by the broker before the close (at Zerodha, from 3 Aug 2026: 3:12 pm for stocks in the F&O list because of the closing auction, 3:25 pm for other stocks, 3:26 pm for F&O contracts; other brokers differ, so check yours). Needed for intraday shorting. |
| NRML (Normal) | F&O (and commodities) | Carry forward until expiry | Full SPAN + exposure margin. Used for positional futures, long or short (Chapter 9). |
| MTF (Margin Trading Facility) | Approved equity stocks | Broker funds part of a delivery buy | The shares are pledged to the broker and you pay interest daily (Zerodha: 0.04% a day ≈ 14.6% a year simple). Example: ₹1 lakh funded for 30 days costs \( 100000 \times 0.0004 \times 30 = \text{₹}1{,}200 \) in interest. |
MTF and MIS let you control more stock than your cash covers. A 10% fall on a position funded 50% by the broker costs you 20% of your own money, plus interest. Beginners should start with CNC only.
12.1 Long, short and square-off
| Position | 1st leg | 2nd leg (square-off) | View | Profit if | Loss if |
|---|---|---|---|---|---|
| Long | Buy | Sell | Bullish | Price rises | Price falls |
| Short | Sell | Buy | Bearish | Price falls | Price rises (losses are theoretically unlimited) |
Varsity's analogy: selling a phone you have not bought yet at ₹16,500 and buying it later at ₹14,000 is a short trade. In the Indian cash segment, a short must be squared off the same day (MIS). If you cannot deliver the shares, the exchange auctions them and you pay a penalty. To carry a short position overnight, use stock or index futures (NRML) or options. Squaring off a long is not "going short". It simply closes the position.
13. Reading a quote and market depth
Decoding a market-watch line
| Field | Value | Meaning |
|---|---|---|
| Previous close | 722.70 | Yesterday's official close (the reference for % change) |
| Open / High / Low | 711.50 / 720.30 / 708.70 | The day's range so far (High and Low update live) |
| LTP / Close | 708.70 | Last traded price. After the close, the official closing price. |
| Change | −14.00 (−1.94%) | \( 708.70 / 722.70 - 1 \) |
| Volume | 3,93,65,496 | Shares traded today (each share bought and sold counts once) |
| 52-week high / low | 1,020.50 / 681.90 | Range over the last year. Here the stock is near its low. |
The market depth window shows the best five (or, on some platforms, twenty) bids (buyers' prices and quantities) and offers/asks (sellers'). The gap between the best offer and the best bid is the spread. A market buy takes offers from the top of the ladder downward and pays more as it eats deeper. This is impact cost, the same liquidity measure NSE uses for index eligibility.
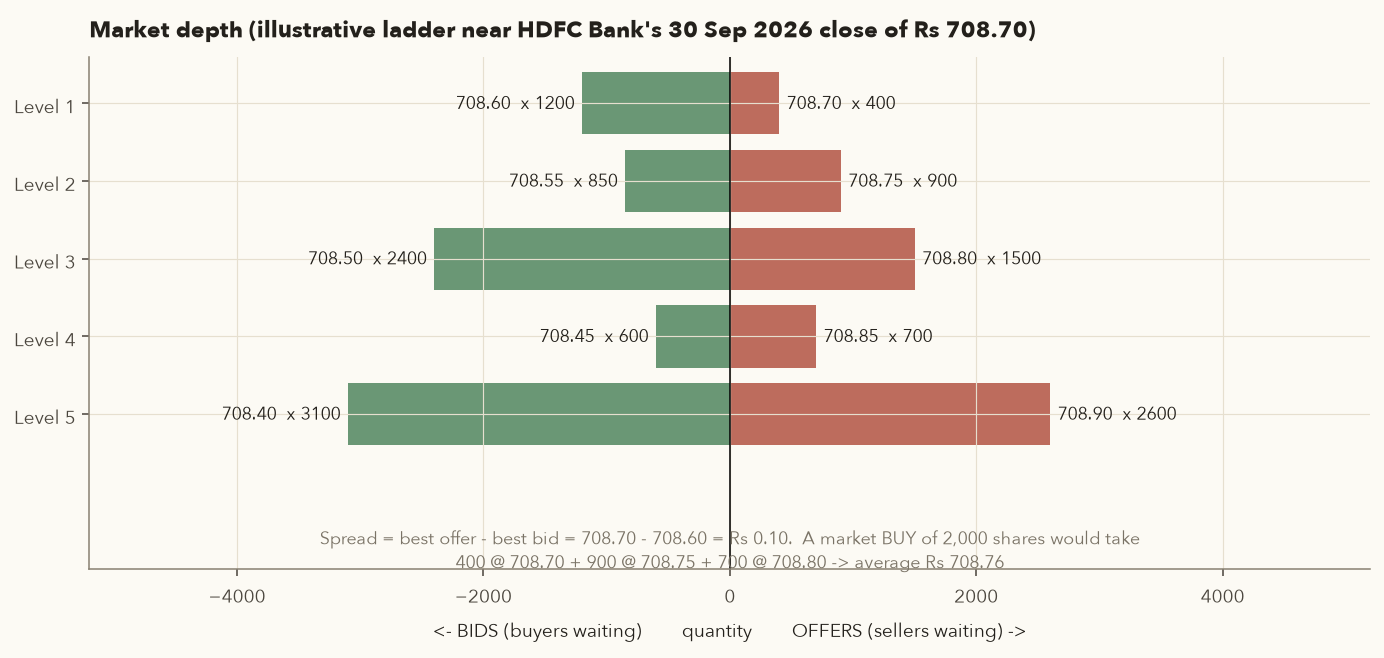
Before placing a large order in a less liquid stock, open the 20-level depth to check that enough quantity exists near your price. Large clusters of bids or offers often show up around chart support and resistance levels (Chapter 3). For a swing trader, the practical rule is to use limit orders in thin stocks and to avoid stocks where your normal order size would eat several levels of the book.
14. Market hours, pre-open, closing auction, circuit limits
14.1 NSE equity sessions (as of Oct 2026)
| Time (IST) | Session | Notes |
|---|---|---|
| 9:00–9:05 | Pre-open phase I | Enter, modify or cancel market and limit orders |
| 9:05–9:10 | Pre-open phase II | Limit orders only (new structure since 7 Sep 2026; previously 9:00–9:08 for all orders). Order entry closes at a random moment between 9:08 and 9:10 so nobody can game the last second, and market orders get priority in matching. |
| 9:10–9:12 | Matching | A call auction finds the single price that matches the most quantity → opening price |
| 9:12–9:15 | Buffer | Transition to continuous trading |
| 9:15–15:30 | Normal market | Continuous order matching. F&O stocks trade continuously only until 3:15 pm, then enter the Closing Auction Session (3:15–3:35 pm, introduced 3 Aug 2026), whose single auction price becomes the official close. Inside it: 3:15–3:20 no orders (the 3:00–3:15 VWAP, volume-weighted average price, is fixed as a reference price), 3:20–3:25 market and limit orders, 3:25–3:30 limit orders only, 3:30–3:35 matching. Other stocks still close at 3:30 pm with the close computed from the last half-hour's volume-weighted average price. |
| 9:15–15:40 | F&O segment | Extended by 10 minutes from 3 Aug 2026 to align with the closing auction |
| 15:50–16:00 | Post-close | Trade at the official closing price, market orders only (per Zerodha support) |
Two session changes happened within five weeks in Aug–Sep 2026. Treat any timing table, including this one, as "as of" its date, and check your broker's support page and NSE circulars. On IPO listing days and after demergers or relistings, a special pre-open (9:00–9:45) applies and continuous trading begins at 10:00 am.
14.2 Circuit limits (price bands)
- Stock price bands: stocks outside F&O have fixed daily bands of 2%, 5%, 10% or 20% from the previous close, set by the exchange based on volatility and surveillance status. When a stock hits its upper circuit, there are only buyers (no sellers at the limit), and vice versa for a lower circuit. You may not be able to exit at all that day.
- Surveillance and trade-for-trade stocks: the exchange moves risky or heavily speculated stocks into surveillance frameworks (ASM, GSM) or the trade-for-trade segment (series BE/BZ instead of EQ). These often get tighter bands, higher margins and compulsory delivery: every buy must be paid for in full and every sell delivered, with no intraday netting. The stock's quote page on NSE shows its series and any surveillance flag. Check it before buying any small cap.
- F&O stocks have no fixed circuit. They use dynamic price bands (initially about 10%) that the exchange flexes in steps if the band is hit and trading conditions justify it.
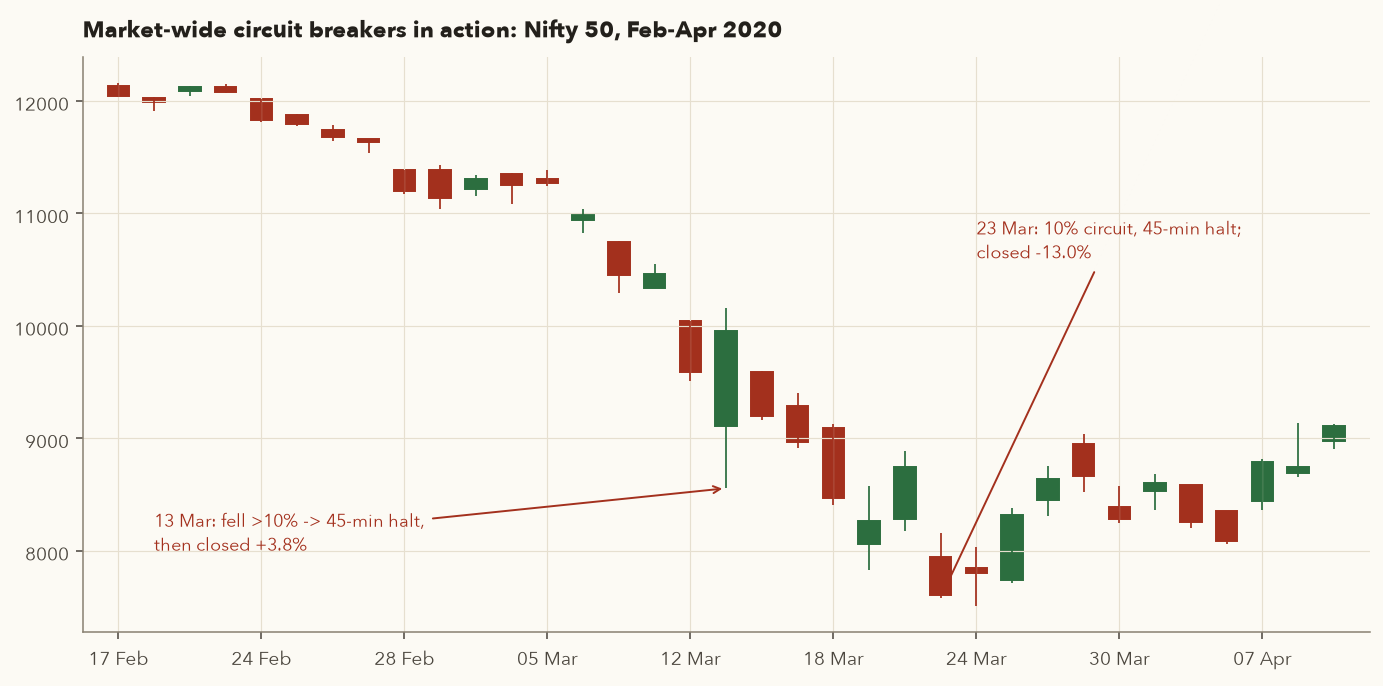
- Market-wide circuit breakers (MWCB) trigger on a 10%, 15% or 20% move in the Nifty 50 or Sensex from the previous close. The halt covers all equity and equity-derivative trading on every exchange, and trading restarts with a 15-minute pre-open call auction:
| Index move | Before 1:00 pm | 1:00–2:30 pm | After 2:30 pm |
|---|---|---|---|
| 10% | 45-min halt | 15-min halt | No halt |
| 15% | 1 hr 45 min halt | 45-min halt if before 2:00 pm; rest of day halted from 2:00 pm | Rest of day halted |
| 20% | Trading halted for the rest of the day | ||
Two circuit-breaker days in ten sessions
- 13 Mar 2020: previous close 9,590.15. The index fell to 8,555.15 (−10.79% intraday), so the 10% breaker triggered a 45-minute halt. After the halt it rallied to close at 9,955.20, +3.81%, a 16% swing from low to close in one day.
- 23 Mar 2020: previous close 8,745.45. It hit the 10% circuit early, halted for 45 minutes, then kept falling. Low 7,583.60 (−13.29%), close 7,610.25 (−12.98%), the decade's worst day and the exact bottom of the COVID drawdown.
- Lesson: circuit breakers pause panic, but they don't stop it. Anyone using leverage could not exit during the halts.
15. Corporate actions: dividends, bonus, splits, rights, buybacks, demergers
A corporate action is a board- and shareholder-approved event that changes what you hold or receive. The key dates are the same for most of them:
- Announcement / declaration date: the board announces (final dividends need AGM approval).
- Record date: the company takes a snapshot of its register of members.
- Ex-date: the first day the stock trades without the benefit. Under T+1, ex-date = record date, so you must own the shares at the close of the trading day before it. Before the ex-date the stock is "cum" the benefit.
- Payment / allotment date: cash or shares arrive.
15.1 Dividends
A dividend is a share of profit (or reserves) paid in cash per share. It can be interim (during the year), final (after the year) or special (one-off). It is quoted per share or as a % of face value. Logic of the price drop: cash leaves the company on the ex-date, so the company is worth that much less, and the price adjusts down by roughly the dividend. You are no richer or poorer on the day: price falls, cash arrives. (Dividends are taxed at your slab rate, so a dividend can even leave you slightly worse off after tax. See Chapter 13.)
- \(P_{cum}\)
- The cum-dividend price: the last close before the ex-date, when a buyer still gets the dividend, in ₹.
- \(P_{ex}\)
- The expected price on the ex-date, in ₹. It is only approximate (\(\approx\)) because the market also moves for other reasons that day.
- \(D\)
- The dividend per share being paid, in ₹.
- \(D_{annual}\)
- The total dividends per share paid over a year, in ₹. (Put a single payout here to get the yield of that one payout.)
- \(P\)
- The share price you compare against, in ₹.
How it works: on the ex-date the dividend cash leaves the company, so the price drops by about the dividend. The yield divides a year's dividends by the price and is usually shown as a percentage (multiply by 100). It is the return you would get from dividends alone if the price did not change.
₹8 final dividend
- Cum-dividend close (26 May): ₹301.65. Dividend ₹8.00 (800% of the ₹1 face value; that is how companies announce it).
- Theoretical ex price: \( 301.65 - 8.00 = 293.65 \). Actual open on 27 May: ₹295.65, close ₹291.95.
- Yield of this one payout: \( 8 / 301.65 = 2.65\% \).
- Data note: the course files carry both
Close(as traded, not dividend-adjusted) andAdj Close(dividend-adjusted). The vendor scales all prices before the ex-date by \( 293.65/301.65 = 0.97348 \), which is why total-return charts don't show a fake drop.
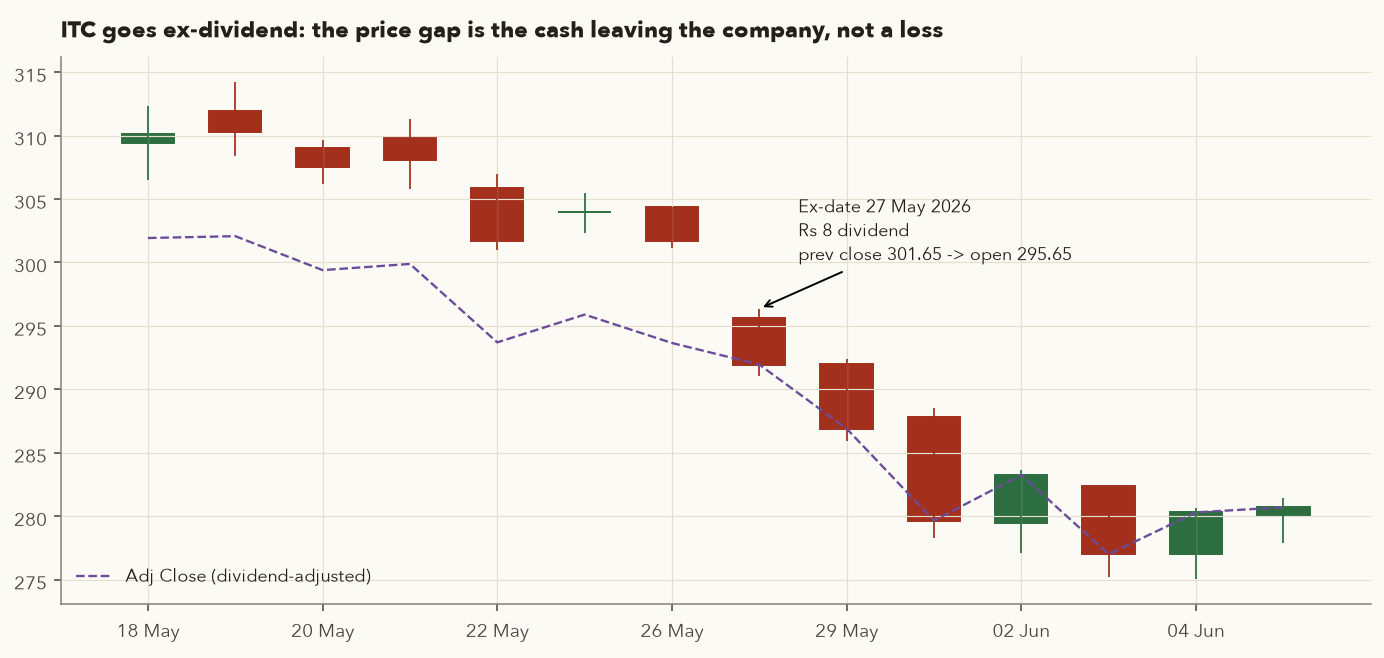
Buying the day before the ex-date to collect the dividend fails because the price drops by about the same amount, and you also pay costs and tax on the dividend. Judge a dividend payer on its sustainable cash flows (Chapters 6–8).
15.2 Bonus issues
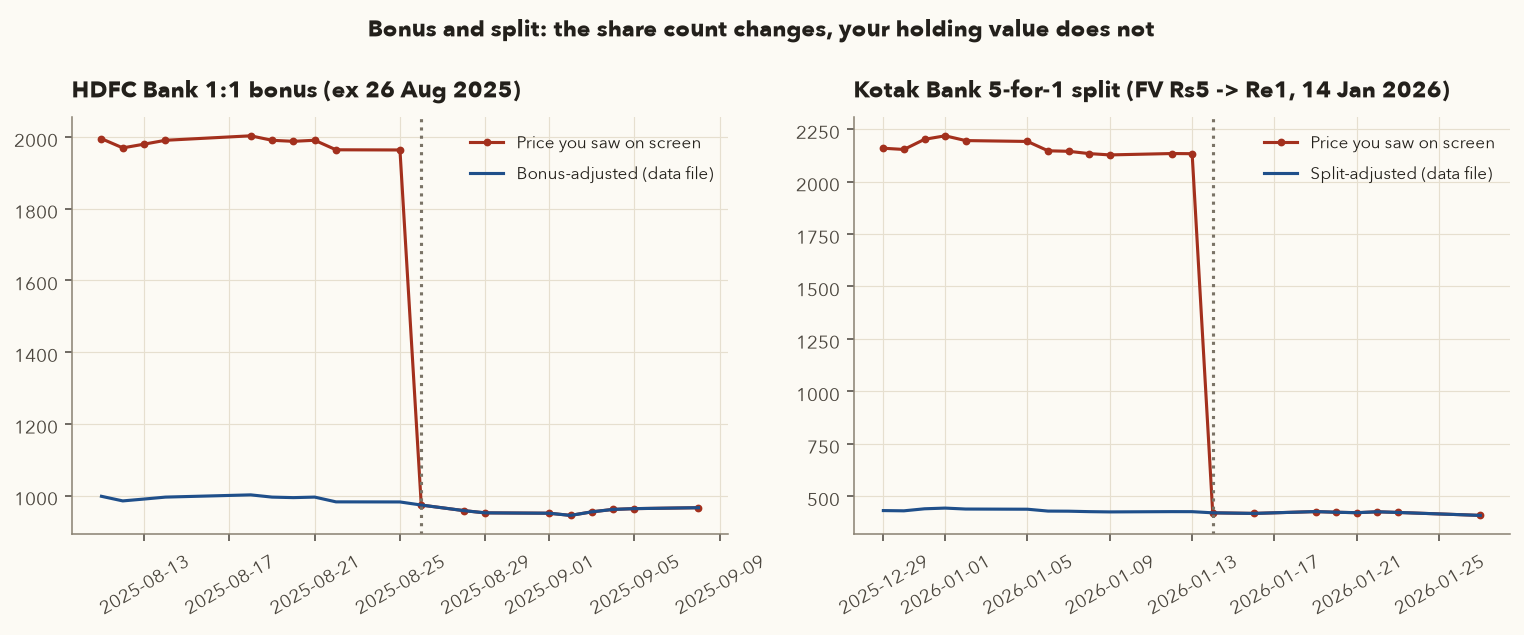
A bonus issue gives free extra shares out of the company's reserves, in a ratio such as 1:1 (one new for each held) or 1:2 (one new for every two held). Face value is unchanged, the share count rises, and the price falls proportionally. Your holding's value is unchanged. Companies do this to make the per-share price more accessible.
- \(a\)
- The number of free bonus shares given.
- \(b\)
- The number of shares you must already hold to get them. A 1:2 bonus has \(a = 1\), \(b = 2\).
- \(P_{cum}\)
- The price before the ex-date, in ₹.
- \(P_{ex}\)
- The theoretical price on the ex-date, after the bonus, in ₹.
- \(N\)
- The number of shares you held before the bonus.
- \(N_{new}\)
- The number of shares you hold after it.
How it works: every \(b\) shares become \(a + b\) shares, but the company is worth the same. So the share count is multiplied by \((a+b)/b\) and the price by the upside-down fraction \(b/(a+b)\). The two cancel out: \(N_{new} \times P_{ex} = N \times P_{cum}\), so your holding's value does not change.
The first bonus in HDFC Bank's history
- On 25 Aug 2025 the stock traded around ₹1,964.10 on your screen. (The data file shows ₹982.05, because all earlier prices are divided by 2 after the bonus.)
- 1:1 bonus → \( 1964.10 \times \tfrac{1}{2} = 982.05 \) theoretical ex price. Actual ex-date open ₹979.50, close ₹973.40.
- 100 shares × ₹1,964.10 = ₹1,96,410 before; 200 shares × ₹982.05 = ₹1,96,410 after. Same value.
- Side effect in data: the ₹5 special dividend paid in July 2025 appears as ₹2.50 in the file, because it is adjusted for the bonus too.
15.3 Stock splits
A split divides each share into several, reducing the face value (the key difference from a bonus). The economics are identical to a bonus: more shares at a lower price and the same total value.
Face value ₹5 → ₹1
- 13 Jan 2026 close on screen: about ₹2,132.60 (file: ₹426.52 = 2,132.60 / 5).
- Ex-date 14 Jan: opened ₹426.00, closed ₹421.00. 10 shares worth ₹21,326 became 50 shares worth about the same.
15.4 Rights issues
A rights issue sells new shares only to existing holders, in proportion to their holdings and usually at a discount. Unlike a bonus, you pay money, so subscribe only if you would buy the stock anyway at that price. The rights entitlement (RE) itself trades for a while and can be sold.
- \(N\)
- The number of shares you must hold to be offered new ones (25 in a 3-for-25 issue).
- \(n\)
- The number of new shares offered for those \(N\) (3 in a 3-for-25 issue).
- \(P_{cum}\)
- The market price before the shares go ex-rights, in ₹.
- \(R\)
- The rights price: what you pay for each new share, in ₹.
- \(TERP\)
- The theoretical ex-rights price: the value of one share once the new shares exist, in ₹.
How it works: it is an average. Take \(N\) old shares worth \(P_{cum}\) each, add \(n\) new shares bought at \(R\), and divide the total value by the total number of shares, \(N + n\). Because the rights price is below the market price, the TERP comes out a little below the old price.
About ₹24,930 crore raised, partly paid
- The price before the announcement was reported at ₹2,370.20. Rights price ₹1,800 is a \( 1 - 1800/2370.20 = 24.06\% \) discount. ₹900 was payable on application and the rest in later calls.
- TERP \( = (25 \times 2370.20 + 3 \times 1800)/28 = 2309.11 \).
- So even before any market reaction, the share is "worth" about 2.6% less after the rights. Data vendors scale earlier prices by about \( 2309.11/2370.20 = 0.9742 \) (the course file's pre-record-date prices are adjusted in this way).
- If the market price falls below ₹1,800 before you pay, it is cheaper to buy in the market than to subscribe.
15.5 Buybacks
In a buyback the company buys its own shares, usually at a premium through a tender offer, and extinguishes them. Fewer shares means a larger share of earnings for each remaining share. It also signals that management thinks the stock is cheap (judge that yourself). Holders of shares worth ≤ ₹2 lakh on the record date get a reserved "small shareholder" quota with a much better acceptance ratio. Tax (rules changed twice recently): from 1 Oct 2024 to 31 Mar 2026 the whole buyback amount was taxed as dividend income at your slab rate, with your cost of the shares treated as a capital loss. Budget 2026 reversed this from 1 Apr 2026: for ordinary shareholders only the gain (buyback price minus your cost) is taxed, as a capital gain, while promoters pay an additional tax that takes their effective rate to roughly 22% (companies) or 30% (individuals). See Chapter 13.
What a small shareholder actually gained
- Announced 11 Sep 2025 when the stock closed at ₹1,509.70 → premium \( 1800/1509.70 - 1 = 19.23\% \). Record-date close (14 Nov): ₹1,502.80 → premium 19.78%.
- Small-shareholder entitlement: 2 shares for every 11 held (the general category got about 2.4%).
- A holder of 110 shares (about ₹1.65 lakh, so a small shareholder) could tender 20 shares at ₹1,800 instead of about ₹1,502.80 → extra \( 20 \times (1800 - 1502.80) = \text{₹}5{,}944 \), about 3.6% on the whole holding, before tax. (This buyback fell under the old regime, so the full ₹1,800 per accepted share was taxed as dividend income.)
- The premium applies only to the accepted fraction, not to your whole holding. That is why buyback "arbitrage" returns are smaller than the headline premium suggests.
15.6 Demergers, and price drops that aren't losses
Varsity's five corporate actions don't include it, but you will meet demergers, where a company spins off a business into a separately listed company. On the record date the parent's price drops by roughly the value of the spun-off business, and you receive shares of the new company.
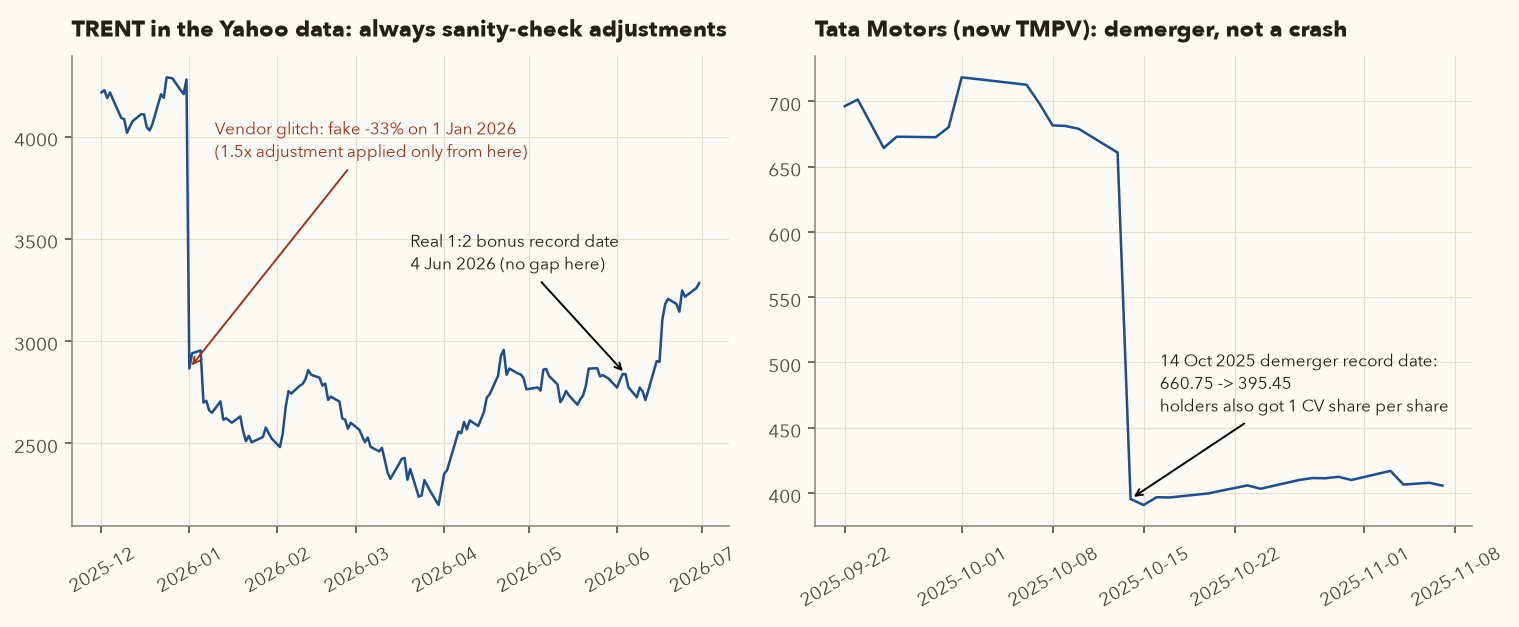
Before trusting any big one-day move in historical data, check for a corporate action. A backtest that "shorts the TRENT crash of 1 Jan 2026" made money only on a data error. Chapter 12 builds this check into the framework.
16. Market-cap categories and reading a stock page
- Share price
- The current market price of one share, in ₹.
- Total shares outstanding
- All the shares the company has issued, including promoter holdings. (Free-float market cap in Section 8 counts only the tradable part.)
- Market cap
- What the market values the whole company at, usually quoted in ₹ crore.
How it works: multiply the two. Because the price changes every day, so does the market cap. A company at ₹1,000 with 10 crore shares has a market cap of ₹10,000 crore.
SEBI's mutual-fund categorisation uses AMFI's half-yearly ranking of all listed companies by average market cap: large cap = ranks 1–100, mid cap = 101–250, small cap = 251 and below. In the July 2026 list the large-cap cut-off was about ₹1,06,300 crore and the mid-cap cut-off about ₹33,500 crore (as summarised by Mata Securities from the AMFI list). Upgrades to large cap included BSE, Hitachi Energy India, Indian Bank and Groww's parent Billionbrains Garage Ventures. Smaller companies tend to be more volatile, less liquid and less researched. That gives more opportunity, more risk and wider spreads.
Reading the header of a stock page
| Field | HDFC Bank | Coal India | ITC | What it tells you |
|---|---|---|---|---|
| Market cap | ₹11,10,422 cr | ₹2,59,478 cr | ₹3,19,440 cr | Size → category, liquidity |
| Current price | ₹721 | ₹420 | ₹256 | Live LTP when fetched |
| 52w high / low | 1,020 / 682 | 491 / 370 | 426 / 255 | Where the price sits in its yearly range |
| Stock P/E | 14.0 | 8.32 | 16.2 | Price ÷ earnings per share (Ch 8) |
| Book value | ₹390 | ₹193 | ₹57.9 | Net worth per share (Ch 6) |
| Dividend yield | 1.80% | 6.30% | 5.67% | Last year's dividends ÷ price |
| ROCE / ROE | 7.02% / 13.6% | 35.0% / 28.2% | 38.9% / 29.3% | Profitability of capital (Ch 7) |
| Face value | ₹1 | ₹10 | ₹1 | Accounting unit; matters for dividends "in %" |
Lower down the same page you'll find quarterly results, the P&L, the balance sheet, cash flows, key ratios and the shareholding pattern (Section 5). Chapters 6–8 teach you to read them. For now, note that a low P/E or high yield is not automatically "cheap": ITC sat at its 52-week low with a 5.67% yield. Understanding why the market prices it that way is the investor's job. The framework's framework.data.fetch_fundamentals(symbol) pulls these screener tables into pandas.
17. What a delivery trade really costs (current charges)
Varsity's settlement chapter shows the charges on a ₹1 lakh Reliance purchase. Rates have changed since it was written, so here are the charges verified for October 2026 (Zerodha charges page; NSE circular effective 1 Mar 2026; Budget 2026 for F&O STT):
| Charge | Equity delivery (CNC) | Equity intraday | Futures | Options |
|---|---|---|---|---|
| Brokerage (Zerodha) | ₹0 | 0.03% or ₹20/order, lower | 0.03% or ₹20/order, lower | ₹20 flat per order |
| STT (govt tax) | 0.1% on buy and sell | 0.025% on sell | 0.05% on sell (from 1 Apr 2026; was 0.02%) | 0.15% of premium on sell (from 1 Apr 2026) |
| Exchange txn charge (NSE) | 0.00307% | 0.00307% | 0.00183% | 0.03553% of premium |
| SEBI fee | ₹10 per crore of turnover | |||
| GST | 18% on (brokerage + exchange charges + SEBI fee) | |||
| Stamp duty (buy side) | 0.015% | 0.003% | 0.002% | 0.003% |
| DP charge | ₹15.34 per scrip per sell day (incl. GST) | — | ||
A winning swing/positional trade, all costs in
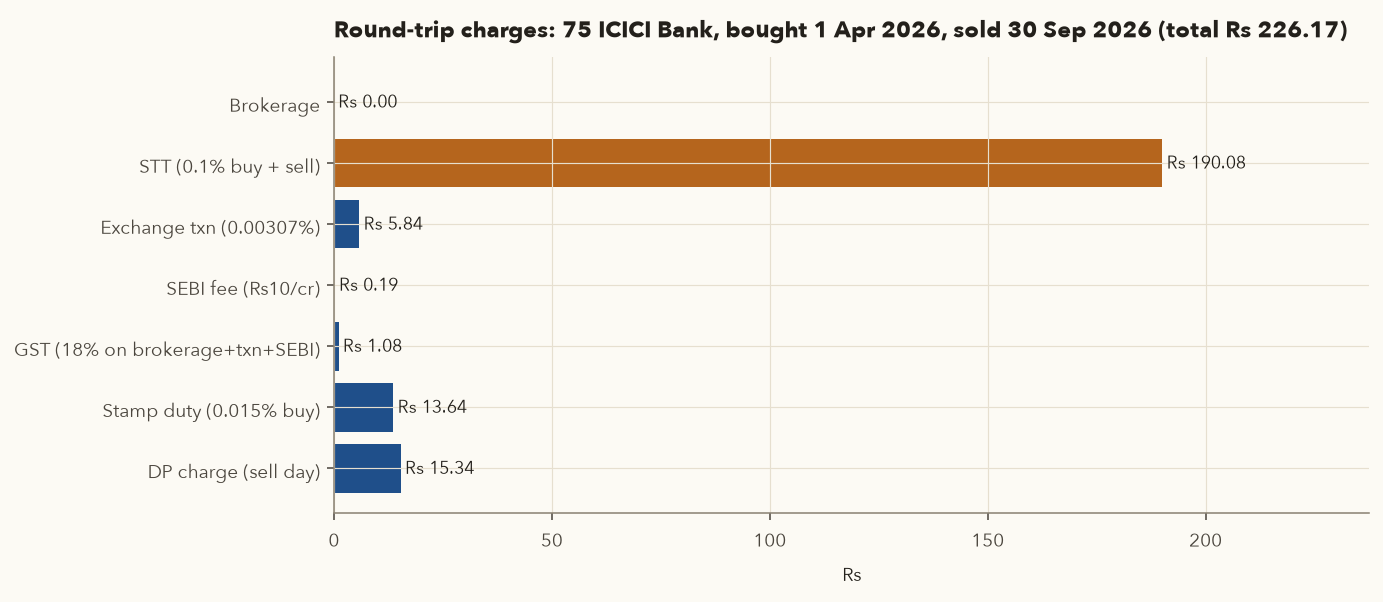
- Buy 75 shares at the 1 Apr 2026 close ₹1,212.70 → buy value ₹90,952.50. Sell at the 30 Sep 2026 close ₹1,321.70 → sell value ₹99,127.50. Turnover = ₹1,90,080.
- STT = \( 0.001 \times 1{,}90{,}080 = \text{₹}190.08 \).
- Exchange charge = \( 0.0000307 \times 1{,}90{,}080 = \text{₹}5.84 \). SEBI fee = \( 10/10^7 \times 1{,}90{,}080 = \text{₹}0.19 \).
- GST = \( 0.18 \times (0 + 5.84 + 0.19) = \text{₹}1.08 \).
- Stamp duty = \( 0.00015 \times 90{,}952.50 = \text{₹}13.64 \). DP charge on the sell day = ₹15.34.
- Total = ₹226.17 (0.249% of the buy value). Gross profit ₹8,175.00 → net ₹7,948.83. Costs took 2.77% of the profit, and STT alone is 84% of the costs.
- Held 12 months or less → short-term capital gain taxed at 20% (plus surcharge/cess). STT is not deductible for capital-gains purposes, but the other charges are: taxable gain ≈ \( 8175 - 36.09 = 8138.91 \) → tax ≈ ₹1,627.78. For holdings of more than 12 months, long-term gains are taxed at 12.5% above ₹1.25 lakh a year (rates unchanged in Budget 2026; details in Chapter 13).
Buying 5 ITC at ₹291.70 (₹1,458.50) and selling 5% higher costs about ₹18.66 in total, which is 1.28% of the position. The flat ₹15.34 DP charge dominates, and total costs eat about a quarter of the ₹72.93 gain. Rule of thumb: for swing trades, keep each position large enough that round-trip costs are well under 0.5%, and remember that STT alone makes a delivery round trip cost at least 0.2% of the position value.
In your framework: framework.costs.equity_delivery_charges(buy_value, sell_value) and framework.costs.capital_gains_tax implement exactly this arithmetic, and the backtester (Chapter 12) deducts them from every simulated trade.
18. Developing a point of view: the road ahead
Varsity closes Module 1 with the key idea: success needs a point of view (POV) on a stock or index (bullish or bearish), formed by your own analysis, and then the right instrument to express it.
- Fundamental analysis (Ch 6–8): "Revenue +25%, profit +15%, guidance positive, valuation reasonable → bullish for the long term → buy delivery."
- Technical analysis (Ch 2–5): "Bullish engulfing at support with momentum turning up → bullish for the next 1–3 weeks → swing buy with a stop."
- Quantitative analysis (Ch 12): "Statistically stretched, likely to mean-revert" or "the trend rule says long".
- Outside views (TV and social media tips): Varsity's advice, which this course shares, is not to act on these.
Instrument choice follows the POV: a 1-year bullish view suits a delivery buy; a short-term directional view on the index can use futures (with strict sizing, Ch 9); a view where you want limited downside can use options (Ch 10). Every instrument sits under the same risk rules (Ch 11) and is tested before use (Ch 12).
19. Try it yourself (Python)
These snippets need a copy of the course repository and Python with pandas and numpy (setup steps are in its framework/README.md). Run them from the repository's root folder, for example with .venv/bin/python, because the file paths are relative to that folder. All figures in this chapter come from course/scripts/ch01_figures.py.
1. CAGR, drawdown and calendar returns for any index or stock
import pandas as pd
df = pd.read_csv("data/ohlc/IDX_NSEI.csv", index_col=0, parse_dates=True)
c = df["Close"]
years = (c.index[-1] - c.index[0]).days / 365.25
cagr = (c.iloc[-1] / c.iloc[0]) ** (1 / years) - 1
dd = c / c.cummax() - 1
print(f"CAGR {cagr:.2%}  max DD {dd.min():.2%} on {dd.idxmin().date()}")
print((c.resample("YE").last().pct_change() * 100).round(2))
# try "IDX_NSEBANK", "HDFCBANK", "TITAN" ...
2. Find every bonus/split and dividend in the data, and check the ex-date move
import pandas as pd
d = pd.read_csv("data/ohlc/ITC.csv", index_col=0, parse_dates=True)
d = d[d["Volume"] > 0]                       # drop vendor holiday rows
d["prev_close"] = d["Close"].shift()
ev = d[(d["Dividends"] > 0) | (d["Stock Splits"] > 0)]
ev = ev.assign(expected_open=ev["prev_close"] - ev["Dividends"])
print(ev[["prev_close", "Dividends", "Stock Splits", "expected_open", "Open", "Close"]].tail(8))
3. Delivery-trade cost calculator (Oct 2026 rates)
def delivery_costs(buy_val, sell_val):
    turn = buy_val + sell_val
    stt, txn, sebi = 0.001 * turn, 0.0000307 * turn, 10 / 1e7 * turn
    gst = 0.18 * (0 + txn + sebi)          # brokerage is 0 for delivery
    stamp, dp = 0.00015 * buy_val, 15.34
    return round(stt + txn + sebi + gst + stamp + dp, 2)

print(delivery_costs(75 * 1212.70, 75 * 1321.70))   # 226.17
print(delivery_costs(5 * 291.70, 5 * 291.70 * 1.05)) # small trade
4. Rebuild the "price you saw on screen" across a split
import pandas as pd
k = pd.read_csv("data/ohlc/KOTAKBANK.csv", index_col=0, parse_dates=True)["Close"]
raw = k.where(k.index >= "2026-01-14", k * 5)   # undo the 5-for-1 adjustment
print(raw.loc["2026-01-09":"2026-01-16"])Modify snippet 1 to compute the rolling 3-year CAGR for Bank Nifty and find the share of windows that were negative. Compare it with the Nifty's 1.64%.
20. Checklist, key takeaways, quiz, sources
Practical checklist: before your first trade
- Trading and demat accounts open with a SEBI-registered broker/DP; primary bank linked; nominee added; TOTP 2FA enabled.
- You know your benchmark (Nifty 50 TRI for equity portfolios) and will compare every result with it.
- You know the product type: CNC for swing and investing; no MIS/MTF leverage while you are learning.
- Limit orders for entries in anything less liquid; check market depth and the spread first.
- A stop-loss for every swing trade, with GTT/OCO if it must survive overnight, sized so that a 2–3× gap is survivable.
- Check the corporate-action calendar (results, ex-dates, record dates) for the stock before entering.
- Check whether the stock is in F&O (dynamic bands, closing auction) or has a fixed 2/5/10/20% circuit.
- Compute the round-trip cost with your broker's calculator; keep it well under 0.5% of position value.
- Know your tax status (STCG 20% if held 12 months or less, LTCG 12.5% above ₹1.25 lakh if held more than 12 months) and keep the contract notes.
- Never act on an outside "tip" without your own point of view and a plan for being wrong.
- Idle cash and even FDs can lose real value. At 4.82% CPI, a 6.5% FD taxed at 30% returns −0.26% a year in real terms.
- Use CAGR for multi-year comparisons. The Nifty's 10-year price CAGR was 9.99%, but its 5-year CAGR was only 5.13%, so start dates matter.
- Asset classes take turns leading: gold (15.67% CAGR) beat the Nifty ETF (11.29%) over Oct 2016–Sep 2026. Diversify.
- SEBI regulates; NSE/BSE match orders; NSE Clearing/ICCL guarantee settlement; NSDL/CDSL hold shares through your DP; the broker connects you to all of them.
- IPOs: read the RHP, and check whether the issue is a fresh issue or an OFS. LG listed +50%, Tata Capital about +1%, and both were roughly flat over the following year for anyone who bought at the listing price.
- Indices are weighted by free-float market cap. The top 10 stocks are 52% of the Nifty 50, and the constituents change (BSE replaced Wipro on 30 Sep 2026).
- Equity settlement is T+1. Ex-date = record date, so buy by the previous trading day to receive a corporate benefit.
- A stop-loss is a trigger, not a guaranteed price. HDFC Bank's 8.66% gap on 19 Mar 2026 turned a ₹2,060 planned risk into ₹7,060 or more.
- Session rules change: closing auction for F&O stocks since 3 Aug 2026, a new pre-open structure since 7 Sep 2026.
- Bonuses and splits don't change value. Dividends and demergers move the price by design. Data vendors adjust history, and sometimes get it wrong.
- A delivery round trip costs at least about 0.2% (STT) plus small fixed charges. Small positions are disproportionately expensive.
Quiz and exercises
Q1. You invested ₹2,00,000 and it became ₹3,10,000 after 4 years and 3 months. What are the absolute return and the CAGR?
Q2. A bank offers 7% on a 1-year FD. CPI inflation is 4.82% and you are in the 20% slab. What is your post-tax real return?
Q3. Why does Coal India, with a market cap of about ₹2.59 lakh crore, carry far less index weight than its size suggests?
Q4. A stock with 9% Nifty weight rises 3% when the Nifty is at 23,000. Roughly how many Nifty points does it contribute?
Q5. A company's record date for a ₹12 dividend is Friday. Under T+1, what is the last day you can buy and still receive it, and what should happen to the price on the ex-date if the stock closed at ₹480 the day before?
Q6. You hold 60 shares at ₹1,500 when a 1:2 bonus is announced. What do you hold after the ex-date, and at what theoretical price?
Q7. A stock trades at ₹600 before a 1-for-5 rights issue priced at ₹480. Compute the TERP. Should you subscribe if the stock later falls to ₹470 before payment?
Q8. You are long at ₹250 with an SL order: trigger ₹240, limit ₹239. Bad news comes out overnight and the stock opens at ₹225 and never trades above ₹232 that day. What happens? What would an SL-M have done?
Q9. Compute the full delivery cost of buying 200 shares at ₹450 and selling at ₹480 at Oct 2026 Zerodha rates.
Q10. An IPO is 100% offer for sale. What does that tell you, and what doesn't it tell you?
Q11. The Nifty falls 10.5% by 12:15 pm. What happens? What if the same fall occurs at 2:45 pm?
Q12. Your 3-year portfolio CAGR is 9%. The Nifty 50 price CAGR over the same period was 4.83%. Did you beat the market? What else should you check?
Q13. In the course data, TRENT drops 33% from 31 Dec 2025 to 1 Jan 2026. How would you check whether it's real?
Stock Splits column shows 1.5 on 4 Jun 2026, a 1:2 bonus). A one-day move of about −33% (1/1.5 − 1 = −33.3%) on no news is a red flag. Cross-check with NSE's corporate-action list or another data source. Here the vendor applied the adjustment to the wrong date range, so the "drop" is fake and must be repaired before any backtest.Q14. You expect a stock you don't own to fall over the next two weeks. Can you short it in your demat account with CNC? What are your options?
Sources: Zerodha Varsity Module 1: The Need to Invest, Regulators, Financial Intermediaries, The IPO Markets – Part 1, Part 2, The Stock Markets, The Stock Markets Index, Commonly Used Jargons, The Trading Terminal, Clearing and Settlement Process, Five Corporate Actions, Key Events and their Impact, Getting Started, Supplementary: 20 Market Depth, Supplementary: IPO, OFS, FPO. Module 7: Taxation for Investors, Classifying your Market Activity.
Rules and rates (checked 1–2 Oct 2026): Zerodha charges; Zerodha support: market sessions (pre-open from 7 Sep 2026, closing auction from 3 Aug 2026); Zerodha support: GTT validity; Kite Connect docs: market protection; NSE transaction-charge circular effective 1 Mar 2026 (Rs 307/crore cash market, via TeamLease RegTech summary); ClearTax: STT rates after Budget 2026; Value Research: STCG/LTCG FY 2026-27; Business Standard: SEBI Bank Nifty caps; Upstox: market-wide circuit breakers; Business Standard: T+3 IPO listing; Forbes India: RBI policy Aug 2026; CPI August 2026; AMFI categorisation July 2026 (Mata Securities); Business Standard: FPI flows 2025, 2026, DII flows 2025.
Index data: NSE Indices factsheets dated 30 Sep 2026 (Nifty 50, Nifty Bank); Business Today: BSE replaces Wipro.
Corporate actions and IPOs: Chittorgarh: Tata Capital IPO; Upstox: LG Electronics India listing; IPO performance 2026; HDFC Bank bonus; Kotak split; Trent bonus; Zerodha: Tata Motors demerger; Infosys buyback and entitlement ratios; Adani Enterprises rights; CNBC: HDFC Bank chairman resignation.
Price data: course data set data/ohlc/ (NSE via Yahoo Finance, to 30 Sep 2026); extra series fetched with yfinance into data/extra/ (NIFTYBEES, GOLDBEES, BSE, LGEINDIA_ipo, TATACAP_ipo). Fundamentals snapshot: screener.in (fetched 2 Oct 2026). Figures: course/scripts/ch01_figures.py. Educational content only, not investment advice.