
Charts & Candlesticks
1. What you'll learn
This chapter teaches you to read a price chart. By the end you will be able to:
- Say what technical analysis (TA) can and cannot do, and which assumptions it rests on.
- Read the four numbers behind every candle (open, high, low, close) and draw the candle yourself.
- Pick a chart type and a timeframe that suit your style. For swing trading that usually means daily candles checked against the weekly chart. For positional trades and investing, weekly and monthly charts.
- Recognise all 15 candlestick patterns from Varsity's Module 2, using rules written as numbers rather than eyeballing. For each one you'll know where Varsity says to enter and where to place the stop.
- Find those patterns automatically in pandas, and test whether they had any edge on 37 NSE stocks over 10 years.
Swing traders (holding days to a few weeks) use candles to time entries and to place a stop at a logical price. Positional traders and investors use weekly and monthly candles to avoid buying into an obvious breakdown and to spot exhaustion after a long rally. Futures traders need a stop on every position because leverage multiplies mistakes, and many candlestick patterns hand you a ready-made stop level. In every case the candle is the raw material. Support/resistance (Chapter 3), indicators (Chapter 4) and the swing playbook (Chapter 5) are all built on it.
Section 19 tests the patterns on 10 years of data from 37 large NSE stocks. On its own, a candlestick pattern had little or no reliable edge over simply buying on a random day. Varsity says the same thing in its own way: patterns are one item on a checklist, not a system. Learn them well, because they describe what buyers and sellers did. Just don't trade them alone.
2. What technical analysis is
Before you buy or sell anything you need a point of view. Varsity says a complete view has five parts: a direction (up or down), an entry price, the risk you'll accept (a stop), the reward you expect (a target), and how long you expect to hold. Technical analysis is a way to build that view from the market's own trading record, meaning prices and volumes, without studying the business.
Varsity explains it with a story about a food street in a foreign country. You can't read the menus, so you have two ways to choose dinner:
- Research each stall: look at ingredients, taste samples, judge the cooking. You know exactly what you're getting, but there's only time to check a handful of stalls. That's fundamental analysis (FA): deep study of a few companies.
- Watch the crowd: stand on a corner, see which stall draws the biggest queue, and assume the crowd knows something. It scales to hundreds of stalls in minutes, but sometimes the crowd is wrong. That's technical analysis: scanning many stocks for what buyers and sellers are actually doing.
On a chart, what buyers and sellers did shows up as shapes, and some shapes recur. A technical analyst learns to recognise them, form a view, and set entry, stop and exit levels.
TA works on any asset that has a price history: stocks, indices, commodities, currencies, bonds. Once you've learnt it, you can apply it anywhere, much like a driver can drive any car. FA is different for each asset. Analysing a bank's balance sheet has little in common with analysing pepper harvests or crude inventories. This portability is one of TA's biggest practical advantages.
3. The four assumptions behind TA
Every method rests on assumptions. If you use TA without knowing them, you won't know when it is likely to fail.
| Assumption | What it means | Where it breaks |
|---|---|---|
| 1. Markets discount everything | Whatever is known, and even what insiders suspect, shows up in price and volume. If informed buyers quietly accumulate before good results, the chart moves before the news comes out. | Sudden news nobody could know (a fraud disclosure, a regulatory order, a demerger) moves price in one jump that no chart predicted. |
| 2. The "how" matters more than the "why" | The technician studies how price reacted, not why. A breakdown on heavy volume is a fact you can act on, even if you don't know the reason yet. | Ignoring the "why" can be dangerous for long-term investors. That's why this course also teaches fundamentals (Chapters 6–8). |
| 3. Prices move in trends | Big moves unfold in phases over weeks or months, not overnight. Once a trend is established, price tends to keep moving in that direction. | Range-bound periods, when there's no trend at all, generate repeated false signals. |
| 4. History tends to repeat itself | People react to rising and falling prices with the same greed and fear each time, so similar patterns keep appearing. | The conditions must really be the same. A pattern in a bull market and the same shape in a bear market are not the same setup. |
Varsity adds a qualification to assumption 4 that matters a lot: history repeats only when the same set of factors repeats. Its example is a stock that has fallen for four sessions, falls a fifth time on lower volume with a narrow range, then rallies on day six. If you later see the same three conditions together, you may expect the same outcome. One condition on its own isn't enough. That's why candlestick rules always come with conditions attached (a prior trend, a size requirement), and why Section 19 checks whether adding context helps.
4. TA vs FA, and what to expect from TA
It's pointless to argue whether TA or FA is "better". They answer different questions. FA asks what to own: is the business good, and is the price reasonable? TA asks when to act and where you're wrong. Good market participants learn both.
| Your style | Typical holding period | Role of TA | Main chart |
|---|---|---|---|
| Swing trader | 2 days – 6 weeks | Primary tool: entry, stop, exit | Daily, checked against weekly |
| Positional trader / futures | Weeks – months | Primary tool, plus a check that the fundamentals aren't broken | Weekly for trend, daily for entry |
| Long-term investor | Years | Secondary: avoid buying into a collapse, add on pull-backs | Weekly and monthly |
Varsity sets these expectations for TA, and they're worth taking seriously:
- Trades: TA is best for short-term trades. Pick long-term investments with fundamentals, then use TA to time your entries and exits.
- Return per trade: expect frequent, modest wins, not a 50% gain in a week.
- Holding period: a TA trade usually lasts from a few minutes to a few weeks. This course skips intraday, so for us it's days to weeks.
- Risk: when a trade goes against you, exit at your stop. Don't hold on and hope. A TA trade that has turned into an "investment" because it's losing money is the most common way beginners lose.
If you approach TA as quick, easy money, you will almost certainly blow up your account, and then blame TA instead of how you applied it. Treat this chapter as learning a vocabulary. Turning the vocabulary into a profitable process takes Chapters 3–5, 11 and 12, plus months of practice.
5. OHLC: summarising a trading day
NSE's normal equity session runs from 9:15 am to 3:30 pm, after a pre-open call auction that starts at 9:00 am. In that time a busy stock can trade millions of times. Plotting every trade would be useless, so we summarise each period with four prices:
- Open (O): the first price of the period.
- High (H): the highest price traded.
- Low (L): the lowest price traded.
- Close (C): the final price. It's the most important of the four. It tells you who won the session, and it's the reference everyone carries into the next day. If \(C > O\) the day is positive (bullish). If \(C < O\) it's negative (bearish).
Add Volume, the number of shares traded, and you have an OHLCV bar. That's exactly what the course data files contain.
NSE's official closing price is calculated, not just taken from the last trade. For stocks without F&O (futures and options) contracts it is the volume-weighted average price (VWAP) of trades between 3:00 and 3:30 pm. From 3 Aug 2026, stocks with F&O contracts have a Closing Auction Session (CAS) from 3:15 to 3:35 pm instead:
- Continuous trading in these stocks ends at 3:15 pm. A reference price is set from the VWAP of 3:00–3:15 pm trades.
- 3:15–3:20 pm is a transition: orders can be queued but reach the exchange only at 3:20.
- From 3:20 pm until a random close between 3:28 and 3:30 pm, buy and sell orders are collected, priced within ±3% of the reference price (only limit orders after 3:25).
- From 3:30 to 3:35 pm the orders are matched, and the matched auction price becomes the official close.
- Stock and index futures and options now trade until 3:40 pm.
This changes Varsity's "risk-taker checks the candle at 3:20 pm" routine (Section 9). For an F&O stock, the 3:15 pm price is your last look at a continuous candle. You can then either place a limit order in the auction or, if you trade the stock's futures, wait for the official close (published by 3:35 pm) and act on the futures before 3:40 pm. Non-F&O stocks keep the old routine. (Sources: ICICI Direct CAS guide; All India Radio news, 2 Aug 2026. Check your broker's current notice before relying on exact timings.)
6. Chart types
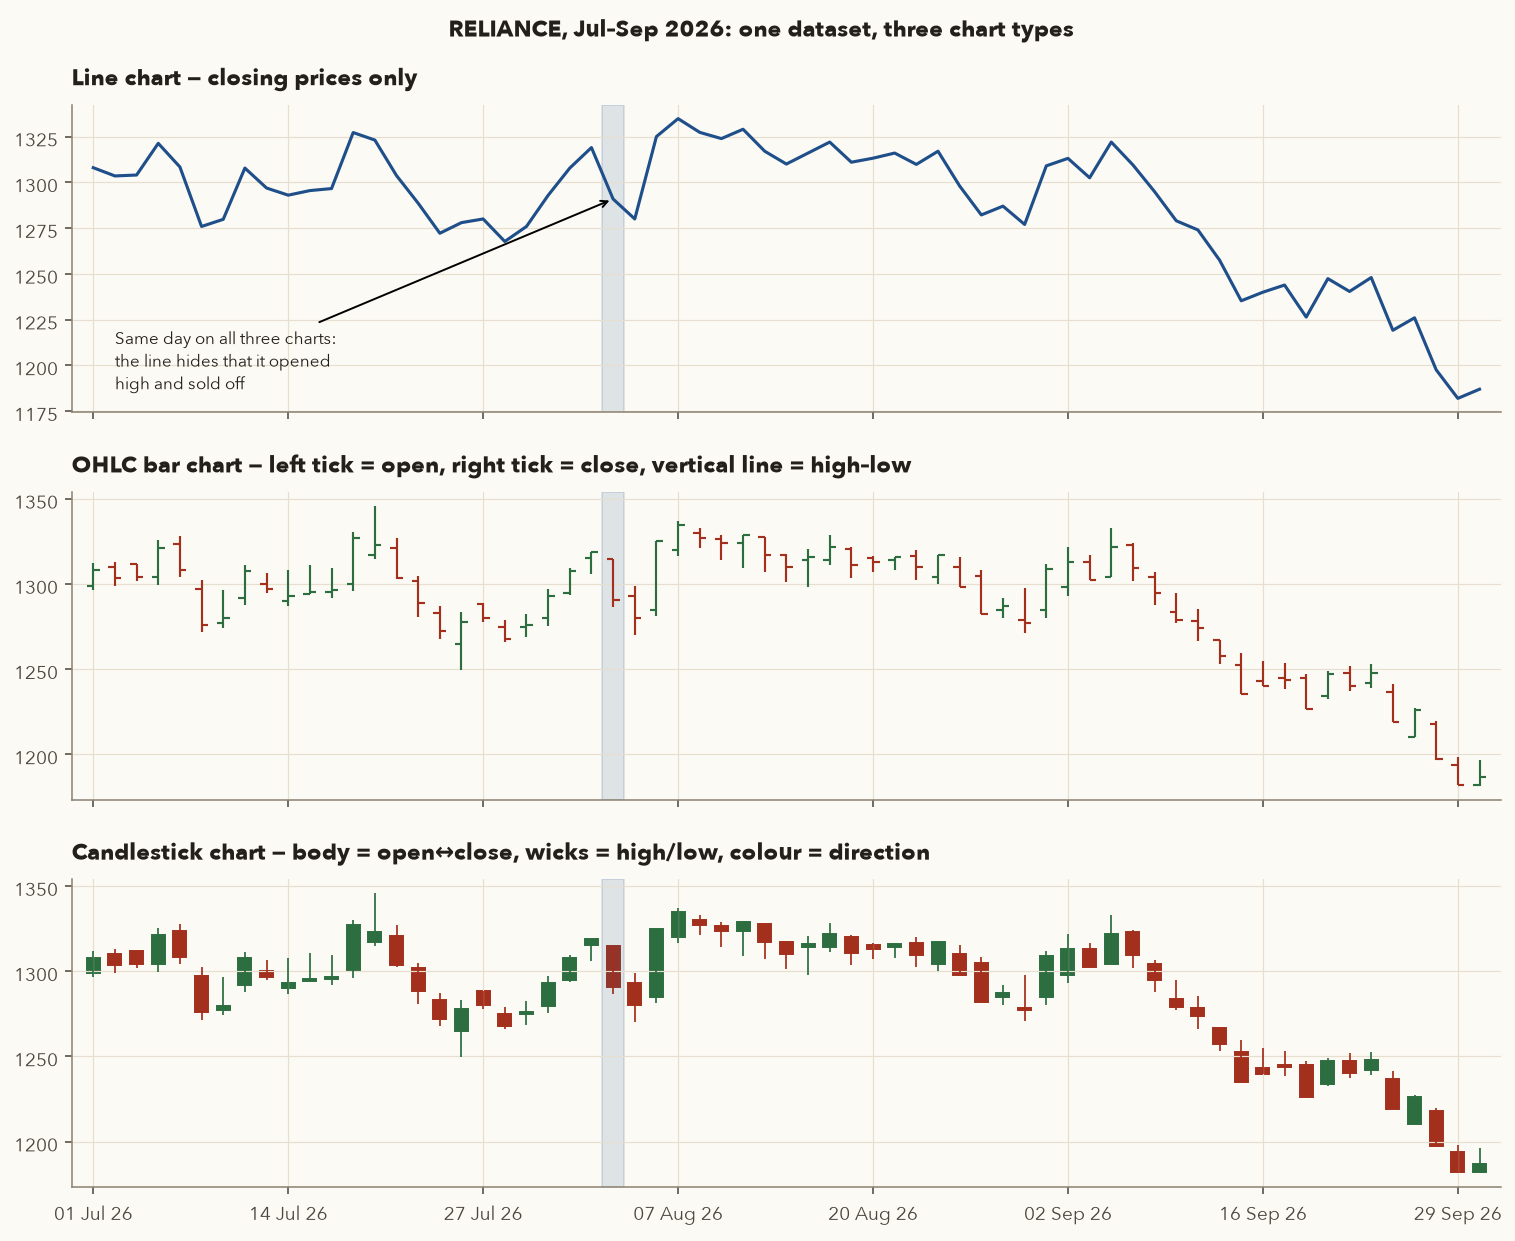
A normal chart plots one value per point in time. TA needs four values per point. Here's how each chart type handles that, all drawn from the same RELIANCE data for Jul–Sep 2026:
6.1 Line chart
A line chart joins the closing prices. It's clean and shows the general trend at a glance. Weekly line charts are good for a quick sweep through many stocks. Its weakness is that it throws away the open, high and low. It can't tell you that a day opened at its high and sold off, or that buyers rescued a deep intraday fall.
6.2 OHLC bar chart
Each bar is a vertical line from the low to the high, with a small tick on the left for the open and a tick on the right for the close. If the right tick is higher than the left, the close beat the open (a positive day). The length of the line is the day's range, \(H - L\). Bar charts carry all four prices, but patterns are hard to see in them, especially when you're scanning dozens of charts. A minority of traders prefer them.
6.3 Japanese candlestick chart
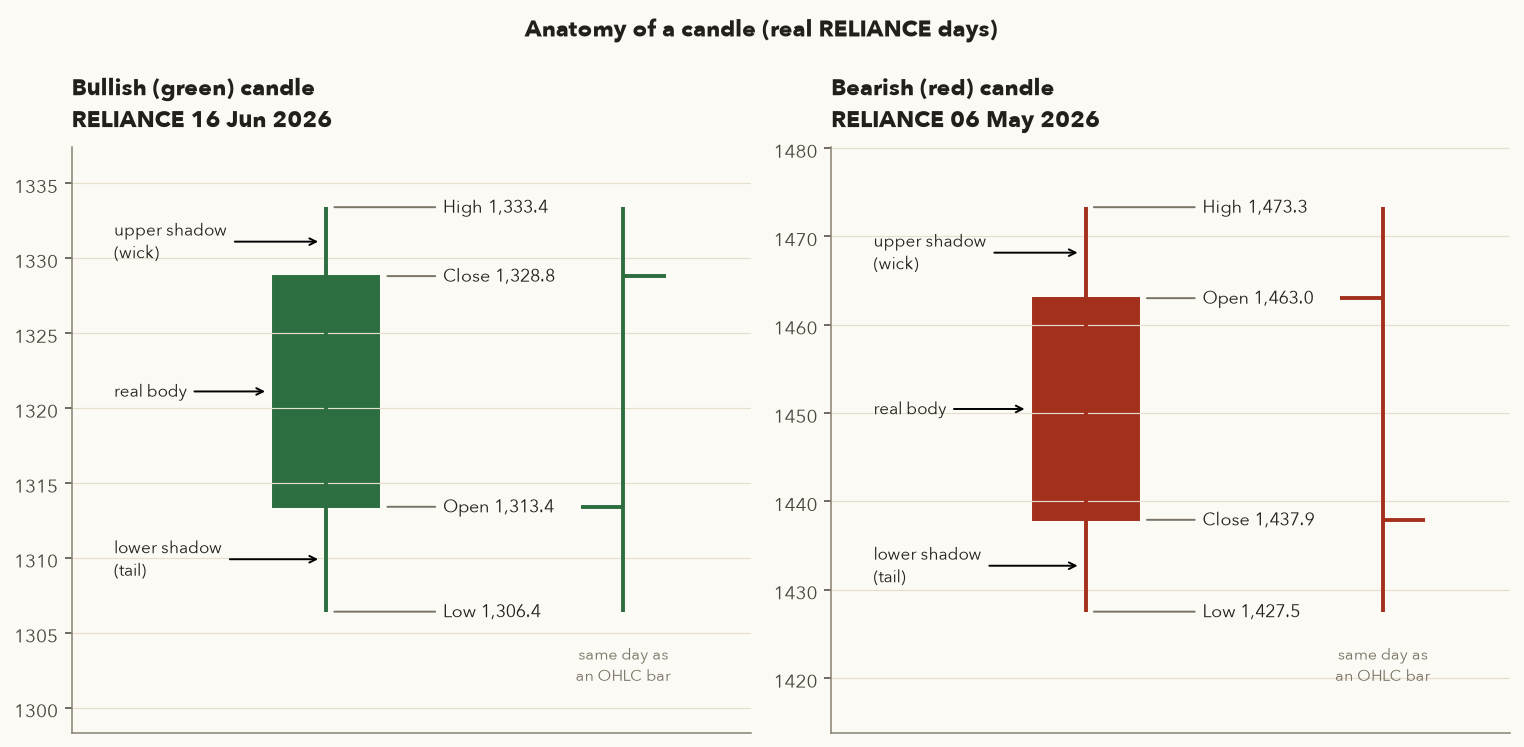
Candlesticks are thought to have been used by the 18th-century Japanese rice trader Homma Munehisa. They reached Western traders through Steve Nison's book Japanese Candlestick Charting Techniques (1991). That's why most pattern names are Japanese. A candle draws the open-to-close range as a filled rectangle, the real body, coloured by direction. Thin lines called shadows or wicks run up to the high and down to the low. They show the same information as a bar, but the body makes the battle between buyers and sellers visible at a glance, which is why candles are the default for nearly everyone. Section 8 covers how to read them.
- \(O, H, L, C\)
- The candle's open, high, low and close, in ₹ (or index points). On a daily chart each candle is one trading session.
- Body
- The distance between open and close: the filled rectangle. The bars \(|\ |\) mean "drop any minus sign", so the body is a positive number for green and red candles alike.
- Range
- The full height of the candle, from low to high.
- Upper shadow
- The thin line above the body. \(\max(O, C)\) means "the larger of open and close", which is the top of the body.
- Lower shadow
- The thin line below the body. \(\min(O, C)\) means "the smaller of open and close", which is the bottom of the body.
How it works: a candle is green when \(C > O\) and red when \(C < O\). For a green candle the top of the body is the close; for a red one it is the open. Using max and min lets one formula work for both colours. The pieces always add up: upper shadow + body + lower shadow = range.
Measure a bearish candle
- Data: O = 1,463.0, H = 1,473.3, L = 1,427.5, C = 1,437.9. Since \(C < O\), the candle is red (bearish).
- Body = |1,437.9 − 1,463.0| = 25.1.
- Upper shadow = H − max(O, C) = 1,473.3 − 1,463.0 = 10.3. For a red candle the upper shadow runs from the open up to the high.
- Lower shadow = min(O, C) − L = 1,437.9 − 1,427.5 = 10.4. For a red candle it runs from the close down to the low.
- Range = 1,473.3 − 1,427.5 = 45.8. Check: 25.1 + 10.3 + 10.4 = 45.8 ✔. The body is 25.1 / 45.8 = 55% of the range.
6.4 Two derived chart types (brief)
Varsity's core module sticks to line, bar and candles. You'll still meet these two on every charting platform:
- Heikin-Ashi ("average bar") smooths ordinary candles. Each HA candle uses the average of the current bar and the previous HA candle, so trends show up as long runs of one colour.
- Renko ignores time completely. A new brick of fixed size (say ₹20) is drawn only when the close moves a full brick beyond the last one. A reversal needs two bricks. Quiet days produce nothing, so the chart shows only meaningful moves.
- \(O, H, L, C\)
- Today's real open, high, low and close, in ₹ (Section 6.3).
- \(HA_O, HA_H, HA_L, HA_C\)
- The open, high, low and close of today's Heikin-Ashi candle.
- \(t-1\)
- The previous candle (the previous session on a daily chart). So \(HA_{O,t-1}\) and \(HA_{C,t-1}\) are yesterday's HA open and HA close.
- \(\max, \min\)
- The largest and the smallest of the values in the brackets.
- HA close: the average of today's four real prices.
- HA open: the middle of yesterday's HA body, the average of yesterday's HA open and HA close. The very first candle has no earlier HA candle, so its HA open is the real \((O + C)/2\).
- HA high: whichever is highest of the real high, the HA open and the HA close. HA low: whichever is lowest of the real low, the HA open and the HA close.
- The HA candle is green when \(HA_C > HA_O\). Each open is carried over from the previous candle, so colours change slowly. That is the smoothing.
Two Heikin-Ashi candles by hand
- 1 Jan: O 1,573.7, H 1,592.5, L 1,571.1, C 1,575.6. HA close = (1,573.7 + 1,592.5 + 1,571.1 + 1,575.6)/4 = 1,578.23. With no earlier HA candle, the first HA open = (O + C)/2 = 1,574.65.
- 2 Jan: O 1,580.0, H 1,594.6, L 1,578.2, C 1,592.3. HA close = 6,345.1/4 = 1,586.28.
- HA open = (1,574.65 + 1,578.23)/2 = 1,576.44. The real open was 1,580.0, so the HA open is not a price anyone traded at.
- HA high = max(1,594.6, 1,576.44, 1,586.28) = 1,594.6. HA low = min(1,578.2, 1,576.44, 1,586.28) = 1,576.44.
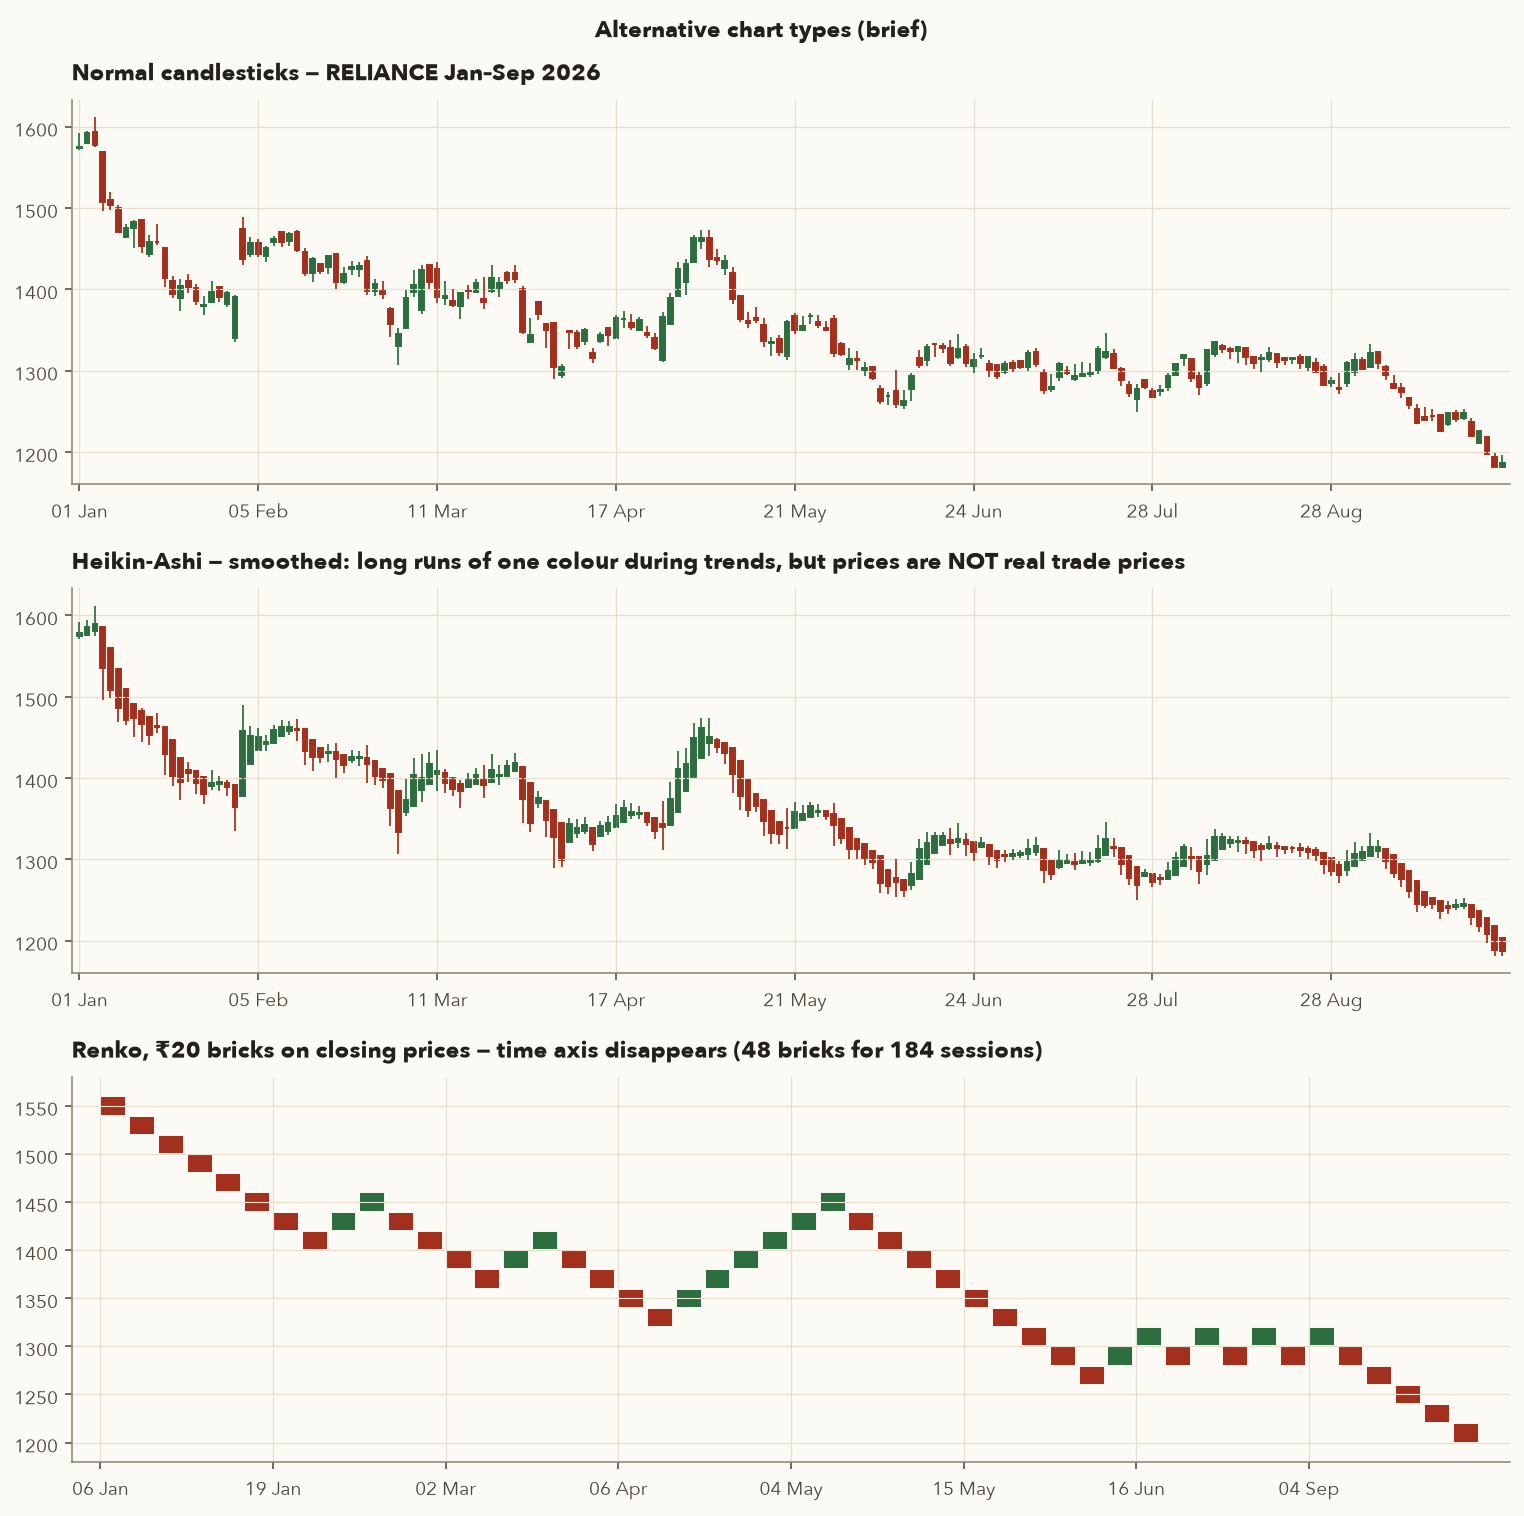
HA opens and closes are averages, so never read entries, stops or candlestick patterns off a Heikin-Ashi chart. The prices may never have traded. Renko's look depends heavily on brick size and hides gaps. Use both as a trend view next to a normal candle chart.
7. Timeframes and resampling
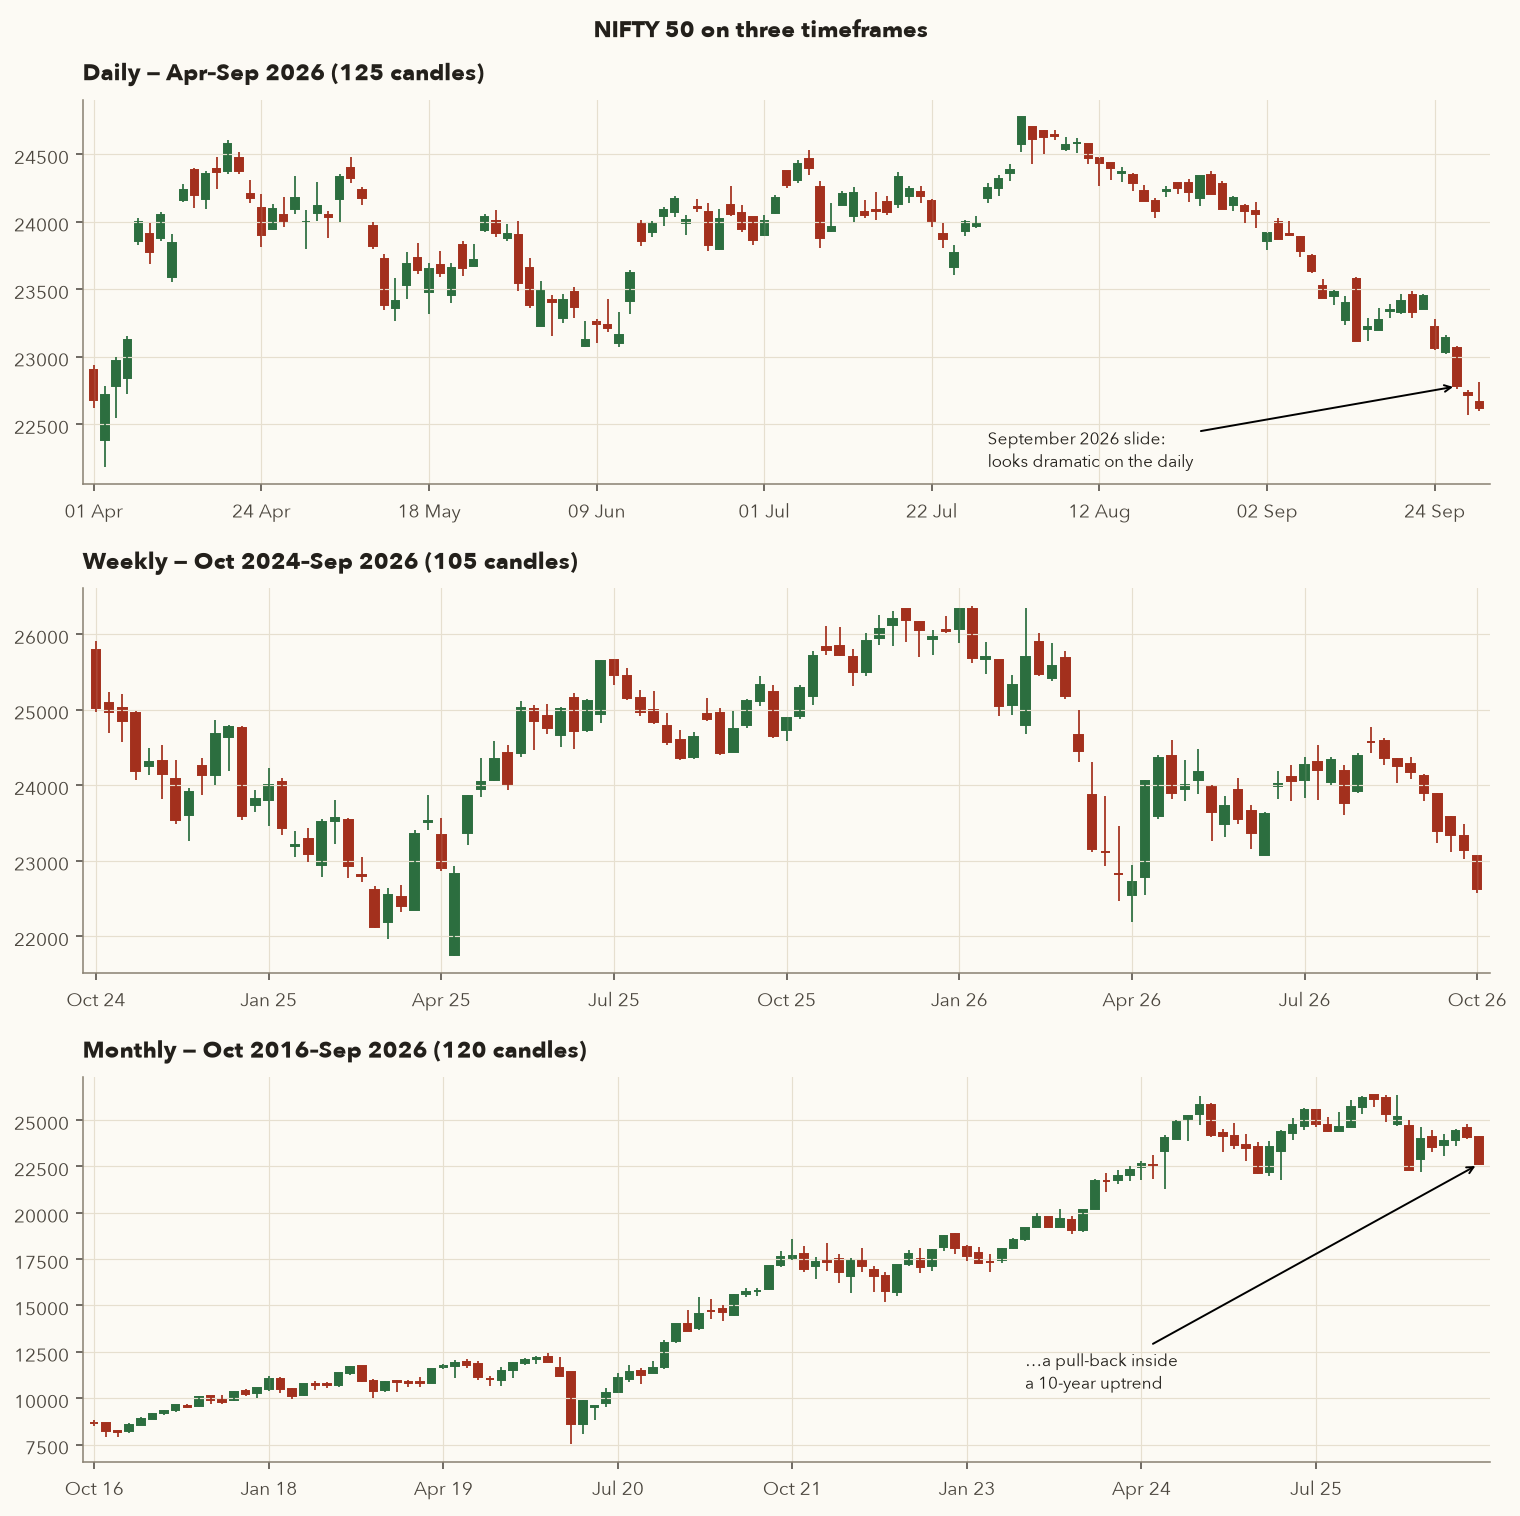
A timeframe is the period each candle covers. The method for building a candle is the same at every timeframe:
- \(O, H, L, C\)
- Open, high, low and close, in ₹ or index points. The subscript "week" means the new weekly candle; "days" means the daily candles inside that week.
- \(V\)
- Volume: the number of shares (or contracts) traded.
- \(\max, \min\)
- The highest and the lowest value in the list.
- \(\sum\)
- Add them all up (\(\Sigma\) is the Greek capital S, for "sum").
How it works: the weekly candle opens where the first trading day of the week opened and closes where the last trading day closed. Its high is the highest high of any day in the week, its low is the lowest low, and its volume is the total of all the days. Replace "week" with "month" (or any other window) and the same rules build that candle.
| Timeframe | Open | Close | Candles | Who it's for |
|---|---|---|---|---|
| Monthly | 1st trading day's open | Last trading day's close | 12 / year | Investors: the big trend |
| Weekly | Monday's open (or the first day traded) | Friday's close (or the last day traded) | ~52 / year | Positional traders, investors |
| Daily (EOD) | Day's open | Day's close | ~245–250 / year | Swing traders |
| 30-minute | First trade in the window | Last trade in the window | ~13 / day | Intraday (not our focus) |
| 5-minute | First trade in the window | Last trade in the window | 75 / day | Intraday (not our focus) |
Varsity uses 252 days as a convention. Our NIFTY file has 249 daily candles for 2025, and our 10-year RELIANCE file has 2,468 real sessions (after dropping 6 zero-volume holiday rows that Yahoo stores), about 247 a year.
Five daily candles become one weekly candle
| Day | Open | High | Low | Close |
|---|---|---|---|---|
| Mon 21 Sep | 23,330.20 | 23,466.80 | 23,314.80 | 23,414.30 |
| Tue 22 Sep | 23,454.05 | 23,489.00 | 23,285.75 | 23,329.00 |
| Wed 23 Sep | 23,352.15 | 23,466.90 | 23,349.55 | 23,446.80 |
| Thu 24 Sep | 23,221.80 | 23,281.95 | 23,046.15 | 23,063.10 |
| Fri 25 Sep | 23,035.00 | 23,162.70 | 23,020.95 | 23,140.50 |
| Weekly candle | 23,330.20 | 23,489.00 | 23,020.95 | 23,140.50 |
The weekly close (23,140.50) is below the weekly open (23,330.20), so the week is a red candle. Look at Friday on its own, though: it's a small green day. A swing trader looking only at Friday's daily candle sees a bounce. The weekly candle says the week was a loss. Which is "right" depends on your holding period.
Information vs noise
Smaller timeframes give you more candles, but much of the extra detail is noise: random wiggles that don't change the bigger picture. Pick a timeframe that matches your holding period, and confirm with the next higher one:
- Swing trader: find setups on the daily chart, and check that the weekly trend isn't fighting you. Most of the setups in Chapter 5 are long trades taken only when the weekly trend is up.
- Positional / futures trader: read the trend on the weekly chart and time the entry on the daily.
- Investor: the monthly and weekly charts. A daily candle should almost never change an investment decision.
framework.data.load_ohlc("IDX_NSEI") loads the daily data, and framework.data.resample(df, "W-FRI") or resample(df, "ME") builds weekly or monthly candles with exactly the rules above. Use the weekly frame as a trend filter before acting on any daily signal.
8. Reading a single candle: the buyer–seller story
Every candle tells you how a fight between buyers (bulls) and sellers (bears) went over that period. Once you can read that story, you don't need to memorise patterns as pictures. You can work out what they mean.
| What you see | What happened |
|---|---|
| Long green body, small shadows | Buyers pushed price up from the open and held most of the gain into the close. Strong demand. |
| Long red body, small shadows | Sellers were in charge all session and the close was near the low. Strong supply. |
| Small body (either colour) | Open and close ended up close together. Neither side won. Indecision, or a quiet day. |
| Long lower shadow | Sellers drove price down during the day, then buyers took most of it back. Lower prices were rejected. |
| Long upper shadow | Buyers drove price up, then sellers took it away. Higher prices were rejected. |
| Long candle overall (big range) | Intense activity. Usually news, results, or a crowded move unwinding. |
Varsity puts it simply: a long candle shows intense buying or selling, and a short candle shows subdued trading. Candles are relative. A 2% range is a big day for HINDUNILVR and an ordinary one for ADANIENT. That's why this chapter often compares a candle with its own 20-day average body.
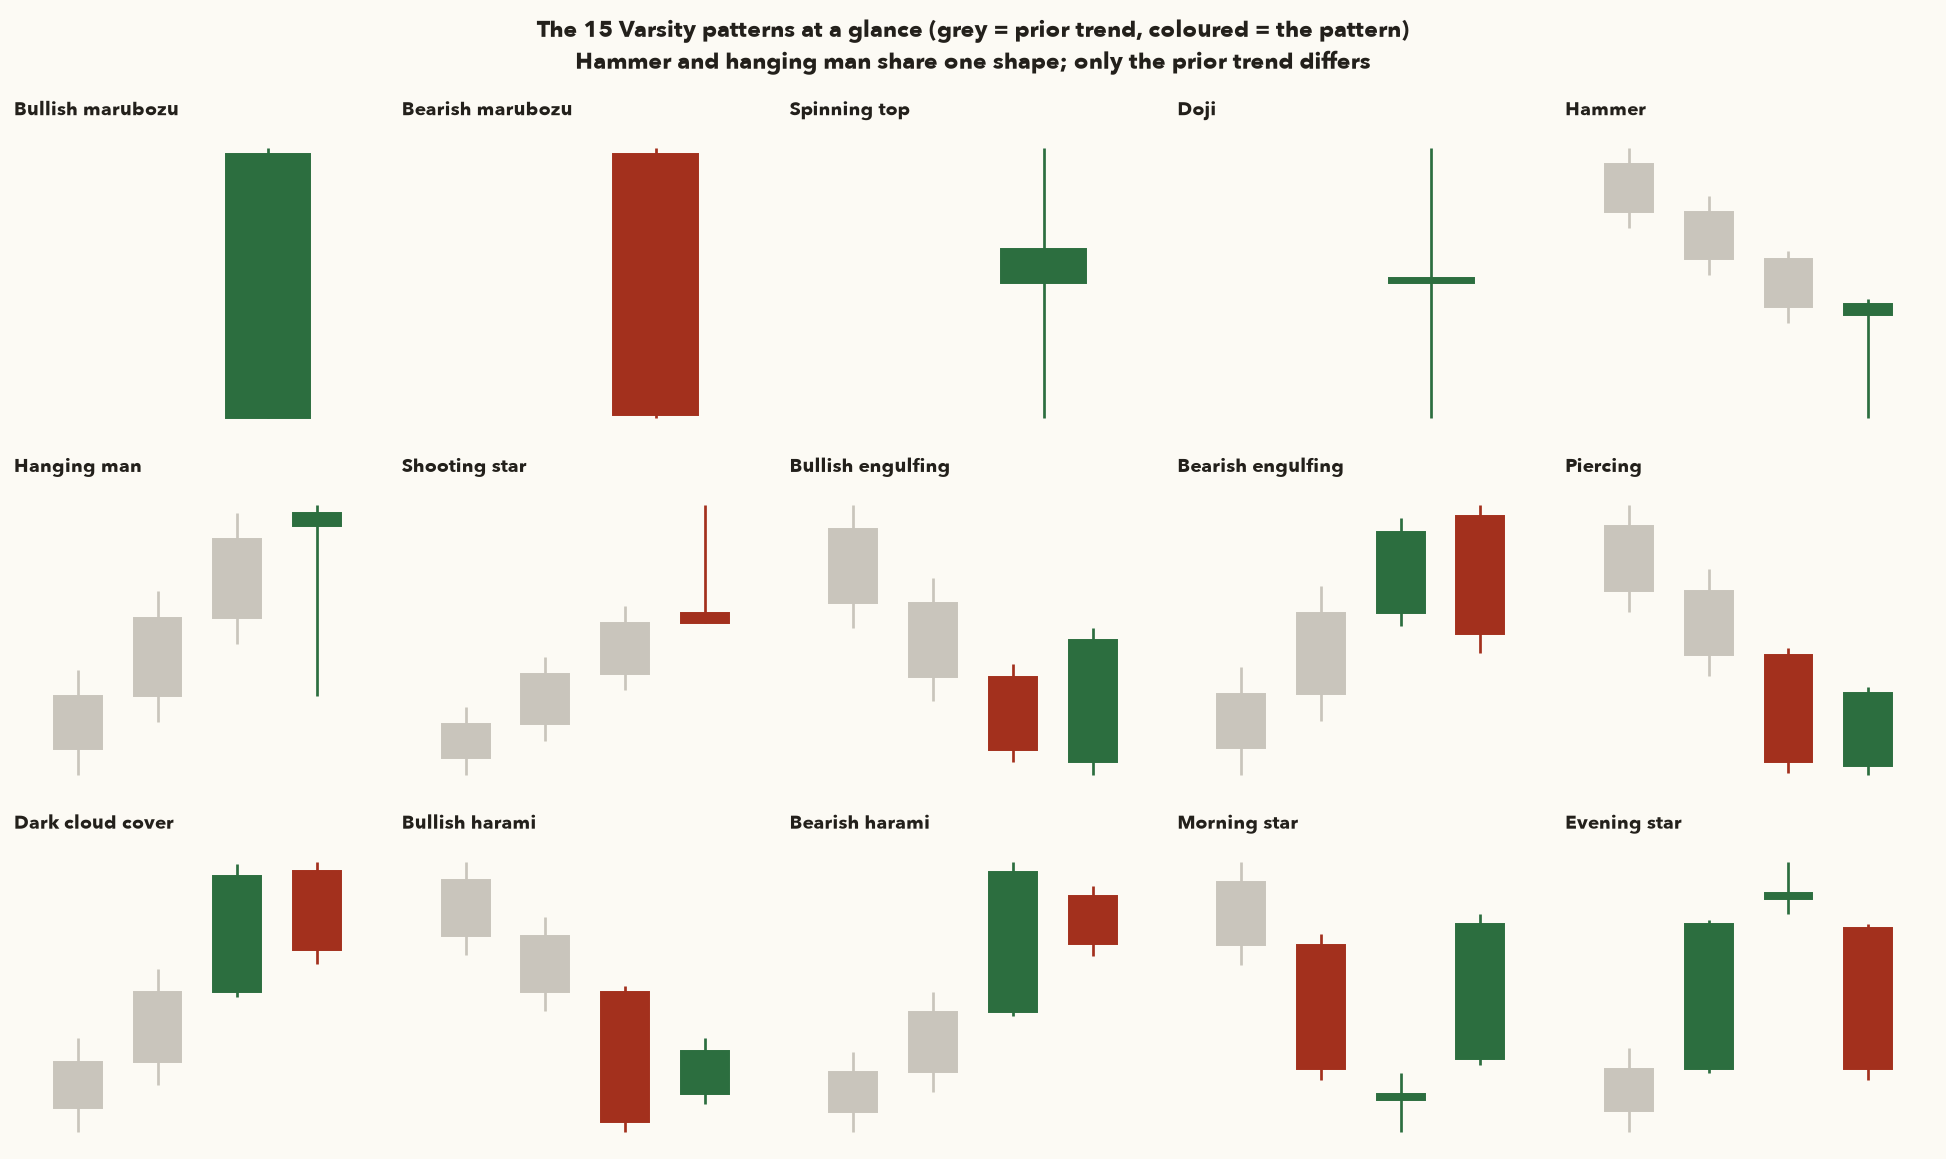
Varsity groups patterns by how many candles they need:
- Single-candle: marubozu (bullish/bearish), spinning top, doji, paper umbrella (hammer / hanging man), shooting star.
- Multiple-candle: engulfing (bullish/bearish), piercing pattern, dark cloud cover, harami (bullish/bearish), morning star, evening star.
9. The ground rules for candlestick patterns
Before any individual pattern, here are Varsity's three rules, plus the entry, stop and size rules that apply to every pattern in this chapter.
9.1 Three rules
- Buy strength, sell weakness. Buy on a green (bullish) candle day and sell or short on a red one. If you buy into a falling day, you're buying while sellers are still winning.
- Be flexible, but quantify and verify. Real candles rarely match the textbook. A "marubozu" may have a tiny shadow. Allow some leeway, but write the leeway down as a number (say "body ≥ 90% of range") so your decisions are consistent and can be tested.
- Look for a prior trend. A bullish reversal pattern only counts after a downtrend, and a bearish one only after an uptrend. There's nothing to reverse otherwise. (The marubozu is the one exception.)
Varsity judges the prior trend by eye. A computer needs a definition, so here is the one used for every detection in this chapter:
- \(C\)
- A daily closing price. The small subscript says which day.
- \(t\)
- The day of the pattern's last candle: the day you spot the pattern.
- \(n\)
- How many candles the pattern has: 1 for a hammer, 2 for an engulfing, 3 for a morning star.
- \(C_{t-n}\)
- The close on the day just before the pattern's first candle. Counting back \(n\) days from \(t\) skips over the whole pattern.
- \(C_{t-n-10}\)
- The close 10 trading sessions before that day.
- \(r_{10}\)
- The 10-session return into the pattern: how far price moved over those 10 sessions, as a fraction (−0.03 means −3%).
- \(SMA_{20}\)
- The 20-day simple moving average: the plain average of the 20 closes ending on day \(t-n\) (Chapter 4 covers moving averages properly).
- Find the day just before the pattern starts (day \(t-n\)) and note its close.
- Divide that close by the close 10 sessions earlier and subtract 1. That's \(r_{10}\).
- Average the 20 closes ending on day \(t-n\). That's \(SMA_{20}\).
- A downtrend needs both: a fall of at least 3% and a close below the average. An uptrend is the mirror image. Anything else counts as "no clear trend", and reversal patterns are ignored.
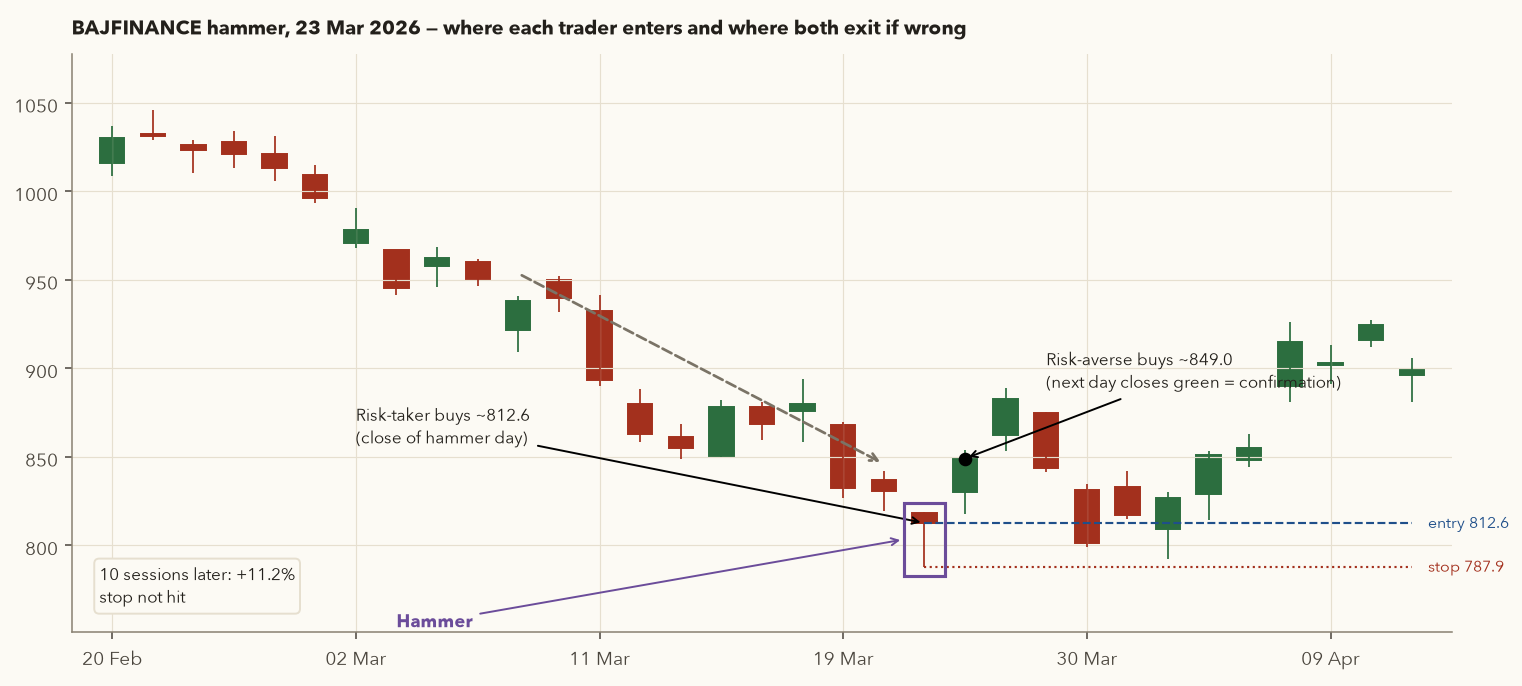
Example (BAJFINANCE hammer, 23 Mar 2026, so \(n = 1\)): the day before is 20 Mar, close 830.55. Ten sessions earlier, 6 Mar, the close was 950.20. \(r_{10} = 830.55 / 950.20 - 1 = -12.6\%\), and the 20-day average was 936.49, above 830.55. Both tests pass, so it's a downtrend. The trend is measured before the pattern starts, so the pattern can't create its own trend.
9.2 Entries: the risk-taker and the risk-averse
Varsity describes two kinds of trader:
- Risk-taker: enters on the day the pattern completes, near the close, after checking around 3:20 pm that the candle really fits the rules. (For F&O stocks under the closing auction, do this check just before continuous trading ends at 3:15 pm and enter through the auction, or act on the stock's futures after the official close and before 3:40 pm. See Section 5.) The entry price is better and the stop is closer, but the pattern hasn't been confirmed.
- Risk-averse: waits for the next day and enters near its close only if that day's candle points the right way (green for a long, red for a short). This confirmation applies rule 1. The cost is a worse entry and a deeper stop, and sometimes missing the trade completely.
Varsity's rule of thumb: the more candles a pattern contains, the more reasonable it is to enter on the completion day, because the extra candles already provide some confirmation. For the three-candle stars, Varsity says both types enter on day 3.
9.3 Stop-loss: built into the pattern
Varsity points out that candlestick patterns come with their own risk control:
- Long trades: stop at the lowest low of the pattern's candles.
- Short trades: stop at the highest high of the pattern's candles.
Once you're in, stay in until either the stop or the target is hit. The only change allowed is moving the stop in your favour (a trailing stop). Patterns give no target. Targets come from support and resistance (Chapter 3) or from a reward-to-risk multiple (Chapter 11). Taking a loss at the stop is part of the job, and sometimes the stock reverses straight after stopping you out. Section 16 has a real example. Stick to the rules anyway.
- Entry
- The price you buy (or short) at, in ₹.
- Stop
- Your stop-loss price, in ₹: the pattern's lowest low for a long, its highest high for a short (Section 9.3).
- Risk/share
- The rupees you lose on each share if the stop is hit. The bars \(|\ |\) drop the minus sign, so it is positive for longs and shorts.
- Capital
- Your total trading capital, in ₹.
- Risk%
- The share of capital you accept losing on one trade, as a decimal (1% = 0.01).
- \(\lfloor\ \rfloor\)
- Round down to a whole number, since you can't buy part of a share.
- Exit
- The price at which you close the trade, in ₹.
- side
- +1 for a long, −1 for a short. It flips the sign so that a short that falls shows a profit.
- R-multiple
- The trade's result measured in units of the risk you took.
- Risk per share is the distance from your entry to your stop.
- Capital × Risk% is the most you allow yourself to lose on the trade (₹5,000 on ₹5 lakh at 1%).
- Divide that by the risk per share and round down. That's how many shares to buy. If the stop is hit you lose about that rupee amount, whatever the stock's price.
- After the exit, divide the profit (or loss) per share by the risk per share. In plain words, 1R is the amount you stood to lose if the stop was hit. A trade that made twice that amount is +2R, and a stopped-out trade is about −1R. Measuring results in R lets you compare a ₹800 stock with a ₹13,000 stock.
Example (MARUTI marubozu, Section 10): entry ₹13,022, stop ₹12,700, so risk/share = ₹322. With ₹5,00,000 capital and 1% risk, shares = ⌊5,000 / 322⌋ = ⌊15.5⌋ = 15. Ten sessions later the close was ₹13,691, so R = (13,691 − 13,022) × (+1) / 322 = +2.1R. Chapter 11 covers position sizing in depth. framework.risk.position_size() implements it.
9.4 The trade trap: skip candles that are too small or too big
Varsity says to avoid trading off candles whose range is below about 1% or above about 10%. A tiny candle shows no conviction, and its direction is close to random. A huge candle forces a very deep stop, so a failed trade costs a lot. In our 37-stock dataset, 4.4% of daily candles had a range under 1% of the previous close and only 0.7% had a range over 10%. The median range was 2.15%. Every single-candle rule in this chapter applies this 1–10% filter.
Several patterns below are bearish ("short the stock"). In the Indian cash market, a retail trader can't carry a naked short position overnight: a short sale must be bought back the same day, or the exchange auctions the shares you failed to deliver, usually at a penalty. (Borrowing shares through the exchanges' Securities Lending and Borrowing (SLB) scheme is the legal exception, but few retail traders use it.) Positional shorts are taken through stock futures or options (Chapters 9–10). Bearish patterns are also useful for exiting or reducing a long. For a beginner, that's usually their main use.
10. Marubozu
Marubozu means "bald" in Japanese. It's a candle with (nearly) no shadows: all body, no hair.
| Variant | Textbook | Our numeric rule | Trade (Varsity) | Stop |
|---|---|---|---|---|
| Bullish marubozu | O = L and C = H | Green, body ≥ 90% of range, range 1–10% of previous close | Buy near the close | Candle low |
| Bearish marubozu | O = H and C = L | Red, body ≥ 90% of range, range 1–10% | Sell/short near the close | Candle high |
The logic. In a bullish marubozu, buyers were willing to pay higher prices all session, right up to the close. Nobody managed to push it back. That's a sudden, one-sided shift in sentiment, and the expectation is that it carries on for a few sessions. A bearish marubozu is the mirror image. Varsity treats the marubozu as the only pattern that doesn't need a prior trend. It means the same thing wherever it appears. Varsity's own example tolerated a 0.17% gap between high and close, which is rule 2 at work.
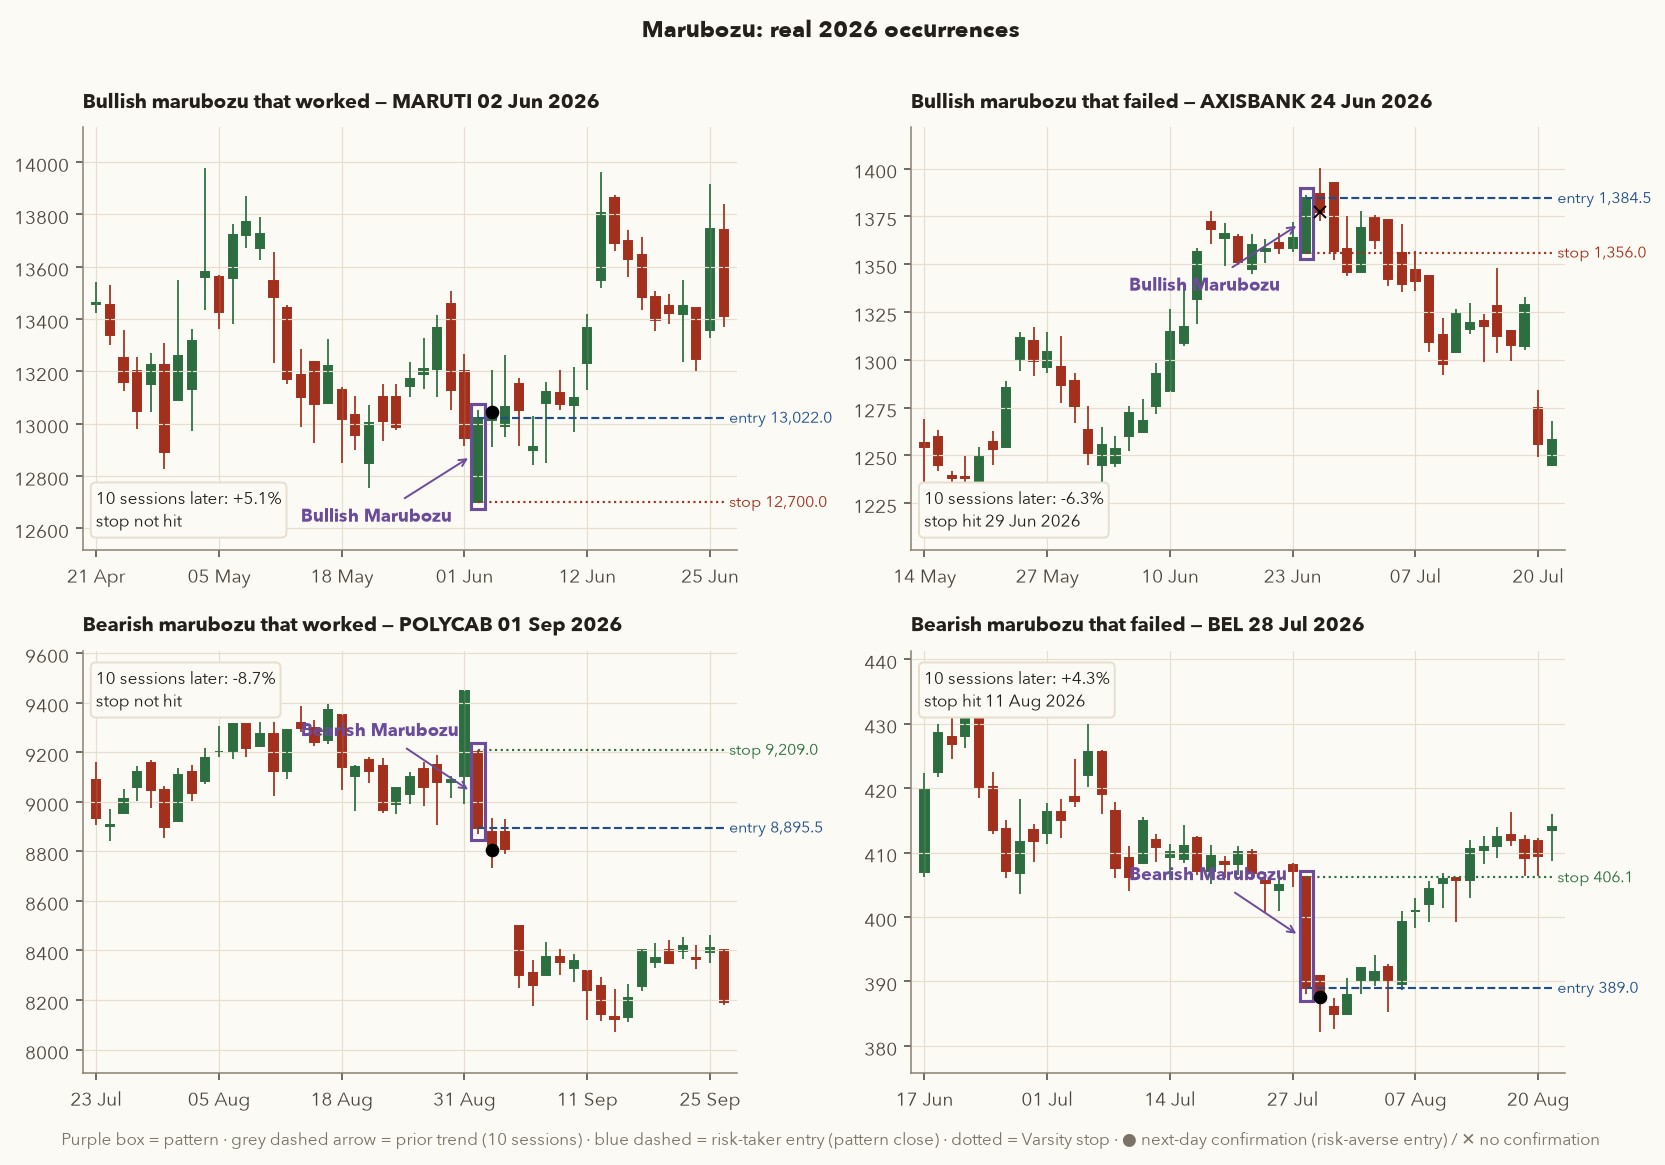
A bullish marubozu, step by step
- OHLC: O = 12,700.0, H = 13,051.0, L = 12,700.0, C = 13,022.0. The open is the low.
- Body = 13,022 − 12,700 = 322. Range = 13,051 − 12,700 = 351. Body/range = 322/351 = 91.7% ≥ 90% ✔. Upper shadow = 29 (0.22% of the high, a small allowed tolerance). Lower shadow = 0.
- Size check: previous close 12,946.0, so range = 351/12,946 = 2.71%, inside 1–10% ✔. Volume was 1.45× its 20-day average.
- Risk-taker: buy ≈ ₹13,022, stop = low ₹12,700, risk = ₹322/share (2.5%).
- Next day (3 Jun) closed green (13,014 → 13,044), so the risk-averse trader also buys ≈ ₹13,044, with risk ₹344/share.
- Sizing: with ₹5,00,000 capital and 1% risk (₹5,000), the risk-taker can buy ⌊5,000/322⌋ = 15 shares (≈₹1.95 lakh).
- Outcome: the stop was never hit. 10 sessions later the close was +5.1% and after 20 sessions +10.5%, about +2.1R at the 10-day mark.
A clean bullish marubozu that failed
- O = L = 1,356.0, H = 1,386.1, C = 1,384.5. Body/range = 28.5/30.1 = 94.7%. A textbook candle that came after a +5.5% run over 10 sessions.
- Risk-taker buys ≈ 1,384.5 with stop 1,356.0.
- 25 Jun closed red (1,386.9 → 1,377.2). Rule 1 says don't buy on a red day, so the risk-averse trader never entered.
- The stop was hit on 29 Jun. 10 sessions after the pattern AXISBANK was −6.3%, after 20 sessions −11.7%. The risk-taker lost 1R. Holding without a stop would have cost about 3R by day 10 and nearly 6R by day 20.
A marubozu is most useful as a breakout candle: a full-bodied candle closing above resistance, or below support, on heavy volume. On its own in the middle of a range, it is just a strong day. In our 10-year statistics (Section 19), bullish marubozus did slightly better than the average day, and they did best when they formed near a 50-day low (79 cases, small sample). Treat that as a lead to explore, not a rule.
11. Spinning top and doji
11.1 Spinning top
A spinning top has a small real body with upper and lower shadows of roughly equal length. The colour doesn't matter, because open and close are close together either way.
The logic. The upper shadow shows buyers tried to push higher and failed. The lower shadow shows sellers tried to push lower and failed. The small body shows that neither side won. It's indecision. On its own it means little. What matters is where it appears:
- In a downtrend: sellers may be pausing before another leg down, or buyers may be starting to take control. Varsity treats both outcomes as roughly equally likely. If you've been waiting to buy, consider taking half your intended size (say 250 of 500 shares) and adding only if price turns up.
- In an uptrend: buyers may be pausing before another leg up, or tiring. If you're holding a profit, consider booking part of it (say 50%) and riding the rest. If the trend continues you still own half. If it reverses you've already sold half higher.
Varsity calls it "the calm before the storm". A move is coming, but the direction isn't known.
11.2 Doji
A doji is a spinning top with (virtually) no body: open ≈ close. The shadows can be any length. Doji and spinning tops often appear in clusters, and they mean the same thing: indecision. Varsity accepts a "wafer-thin" body as a doji (rule 2 again).
- Body, Range
- The candle's body \(|C - O|\) and range \(H - L\), in ₹ (Section 6.3).
- Upper, Lower
- The upper and lower shadow lengths, in ₹ (Section 6.3).
- \(\tfrac{\text{Body}}{\text{Range}}\)
- The body as a fraction of the candle's full height (0.10 = 10%).
How it works: a doji has a body of at most 10% of its range, so open and close are almost equal. A spinning top has a body between 10% and 30% of its range, and each shadow is at least a quarter of the range, so the small body sits roughly in the middle. Candles with a range under 1% of the previous close are ignored. They're just quiet days.
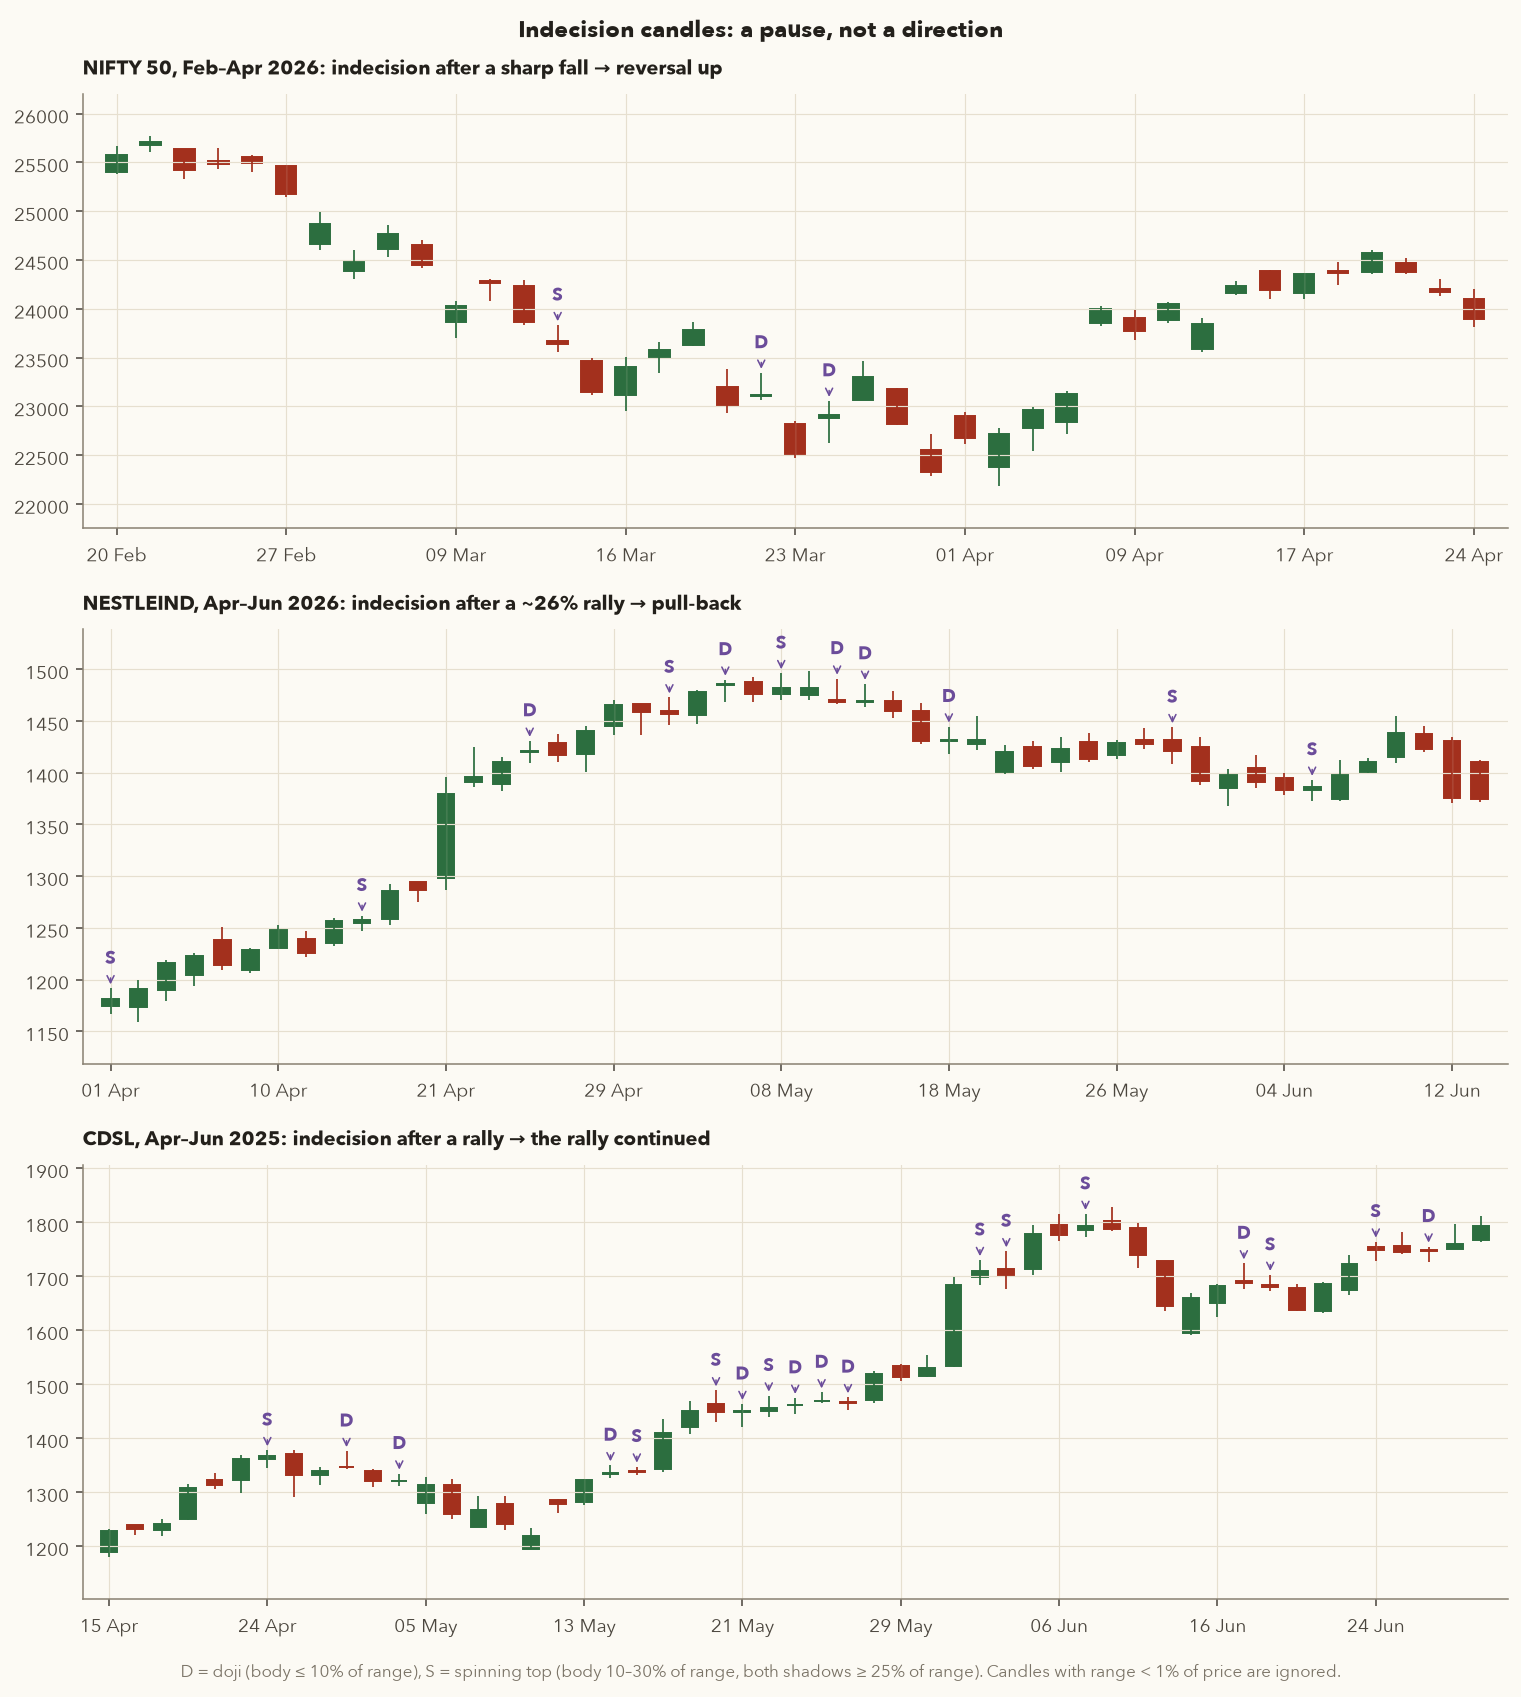
Doji after a sharp fall, and why they're not exact bottoms
- NIFTY fell from 25,178.65 (27 Feb close) into March 2026.
- 20 Mar: O 23,110.15, H 23,345.15, L 23,067.60, C 23,114.50. Body = 4.35, range = 277.55, so body/range = 1.6%, a doji.
- 24 Mar: O 22,878.45, H 23,057.30, L 22,624.20, C 22,912.40. Body 33.95, range 433.10, so body/range = 7.8%, another doji.
- The fall wasn't quite over. NIFTY's lowest close came on 30 Mar at 22,331.40, 3.4% below the 20 Mar doji's close. Then it turned, and closed 30 Apr at 23,997.55.
- Lesson: the dojis correctly flagged that selling was running out of steam. A full-size long on the first doji would still have sat through another 3% drop. That's why Varsity suggests half-size positions and waiting.
- Treating a doji as a buy or sell signal. It's a pause. Wait for the next candle to show which side won.
- Counting dojis on low-range days. A 0.5% range day with open = close is a quiet day, not a fight.
- Forgetting the trend. NESTLEIND and CDSL above had nearly identical clusters, and the outcomes were opposite.
12. Paper umbrella: hammer and hanging man
A paper umbrella has a small body at the top of the range, a long lower shadow, and little or no upper shadow. Its name depends entirely on the prior trend:
- At the bottom of a downtrend it's a hammer (bullish).
- At the top of an uptrend it's a hanging man (bearish).
- Body, Range
- The candle's body \(|C - O|\) and range \(H - L\), in ₹ (Section 6.3).
- Upper / Lower shadow
- The thin lines above and below the body, in ₹ (Section 6.3).
- \(C_{t-1}\)
- The previous session's close, in ₹. Here \(t\) is the candle's own day and \(t-1\) the trading day before it.
- \(\tfrac{\text{Range}}{C_{t-1}}\)
- The candle's range as a percentage of yesterday's close: the 1–10% trade-trap filter from Section 9.4.
- The lower shadow is at least twice the body (Varsity's shadow-to-body ratio). This is the long "handle".
- The upper shadow is at most 10% of the range, so there is little or nothing above the body.
- The body is more than 2% of the range. This floor keeps out candles with essentially no body; those are dojis, not umbrellas. The shooting-star rule in Section 13 uses the same floor.
- The range is between 1% and 10% of the previous close.
- If all four hold, it's a paper umbrella. The prior-trend rule (Section 9.1) then decides: after a downtrend it's a hammer, after an uptrend a hanging man.
Example (Varsity's own illustration): O 100, H 103, L 94, C 102. Body = 2, lower shadow = 100 − 94 = 6 ≥ 2 × 2 ✔. That's a paper umbrella by Varsity's ratio (its upper shadow of 1 is 11% of the 9-point range, just outside our stricter 10% filter).
Hammer logic. Sellers have been in control. On hammer day they push price to a new low as expected, but then buyers step in and drive price back to close near the high. Buyers have shown, for the first time in a while, that lower prices are being rejected. The longer the lower shadow, the stronger the signal. Colour doesn't strictly matter, though a green body is more reassuring. Trade: go long. The risk-taker buys near the close on hammer day after checking at about 3:20 pm that open ≈ close and the lower shadow is at least twice the body. The risk-averse buys the next day only if it closes green. Stop: the hammer's low.
Hanging-man logic. Buyers have been in control. On this day sellers manage a deep intraday drop, which shows their first real presence. The trade is a short (or a reason to protect a long), with the stop at the candle's high. Varsity admits it trusts the hanging man less than the hammer. If sellers were really strong, why did price recover to close near the high? Our data agrees (Section 19).
A hammer at the end of a 12.6% fall
- Prior trend: close went from 950.20 to 830.55 over 10 sessions = −12.6%, below the 20-day SMA (936.49). Downtrend ✔.
- Hammer day: O 818.1, H 818.8, L 787.9, C 812.6. Body = 5.5. Lower shadow = min(818.1, 812.6) − 787.9 = 24.7, which is 4.5× the body ✔. Upper shadow = 0.7, or 2.3% of the 30.9 range ✔. Range = 3.7% of the previous close ✔. Volume 1.8× average.
- The body is red (C < O). A hammer can be either colour, so the risk-taker can still buy ≈ ₹812.6 with stop ₹787.9, a risk of ₹24.7 (3.0%).
- 24 Mar closed green (830.0 → 849.0), so the risk-averse buys ≈ ₹849.0. Same stop, but a risk of ₹61.1 (7.2%), 2.5 times deeper.
- Outcome: the stop held. Price was +11.2% 10 sessions later and +13.4% after 20. That's about +3.7R for the risk-taker and about +0.9R for the risk-averse at the 10-day mark (849.0 → 903.25). Same pattern, very different reward-to-risk.
A hammer that was stopped out the very next day
- Prior 10 sessions −5.3%. Hammer: O 847.70, H 848.90, L 835.10, C 845.35. Lower shadow 10.25 = 4.4× the body of 2.35 ✔.
- Risk-taker buys ≈ 845.35, stop 835.10 (1.2% risk).
- 18 Mar was red (845.35 → 843.05), so the risk-averse stayed out. The 18 Mar low of 831.60 broke the stop.
- HDFCBANK was −11.2% 10 sessions later. The rule-following risk-taker lost 1R (1.2%). Someone who ignored the stop would have lost about nine times as much.
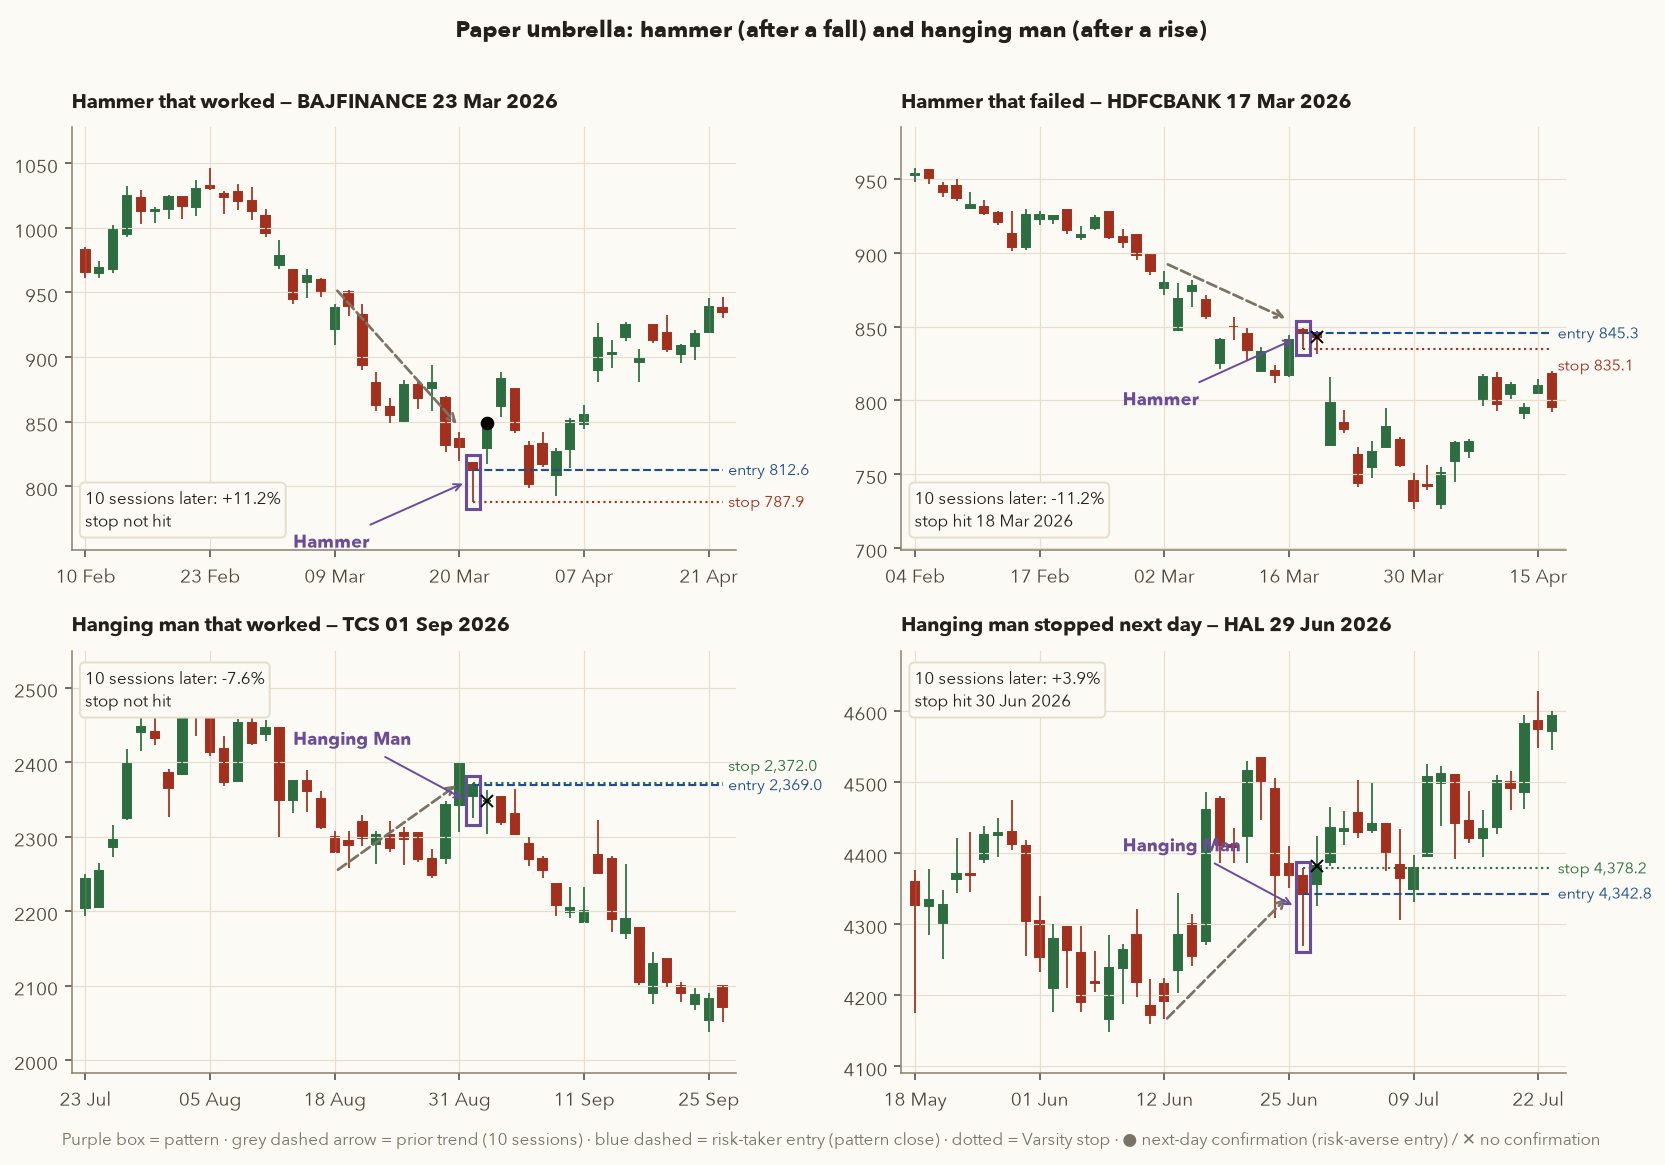
A hanging man closes near its high by definition, so a stop "at the high" is often only a few paise or rupees away. In our 10-year test, 93% of hanging-man stops were hit within 10 sessions. If you trade it, place the stop beyond a nearby resistance level or use an ATR-based stop (ATR, the Average True Range, measures how far the stock typically moves in a day; Chapter 4), and size the position for that wider stop.
13. Shooting star
A shooting star is an upside-down paper umbrella: a small body near the low of the range and a long upper shadow at least twice the body. It needs a prior uptrend. A red body is a little more reliable, and the longer the upper shadow, the more bearish the signal.
- Body, Range
- The candle's body \(|C - O|\) and range \(H - L\), in ₹ (Section 6.3).
- Upper / Lower shadow
- The thin lines above and below the body, in ₹.
- \(C_{t-1}\)
- The previous session's close, in ₹.
- prior uptrend
- The Section 9.1 test, measured on the day before the star: a 10-session rise of at least 3% and a close above the 20-day average.
How it works: this is the paper-umbrella rule of Section 12 turned upside down. The upper shadow must be at least twice the body, the lower shadow at most 10% of the range, the body more than 2% of the range, and the range 1–10% of the previous close. On top of that, the stock must have been in an uptrend.
The logic. Buyers have been in control. On shooting-star day price makes a new high as expected, then sellers hit it hard enough to push it back near the low by the close. The long upper shadow is a record of buyers who bought high and are now losing money. The expectation is that selling continues. Trade: short, or reduce a long, near the close (risk-taker), or after a red next day (risk-averse). Stop: the candle's high.
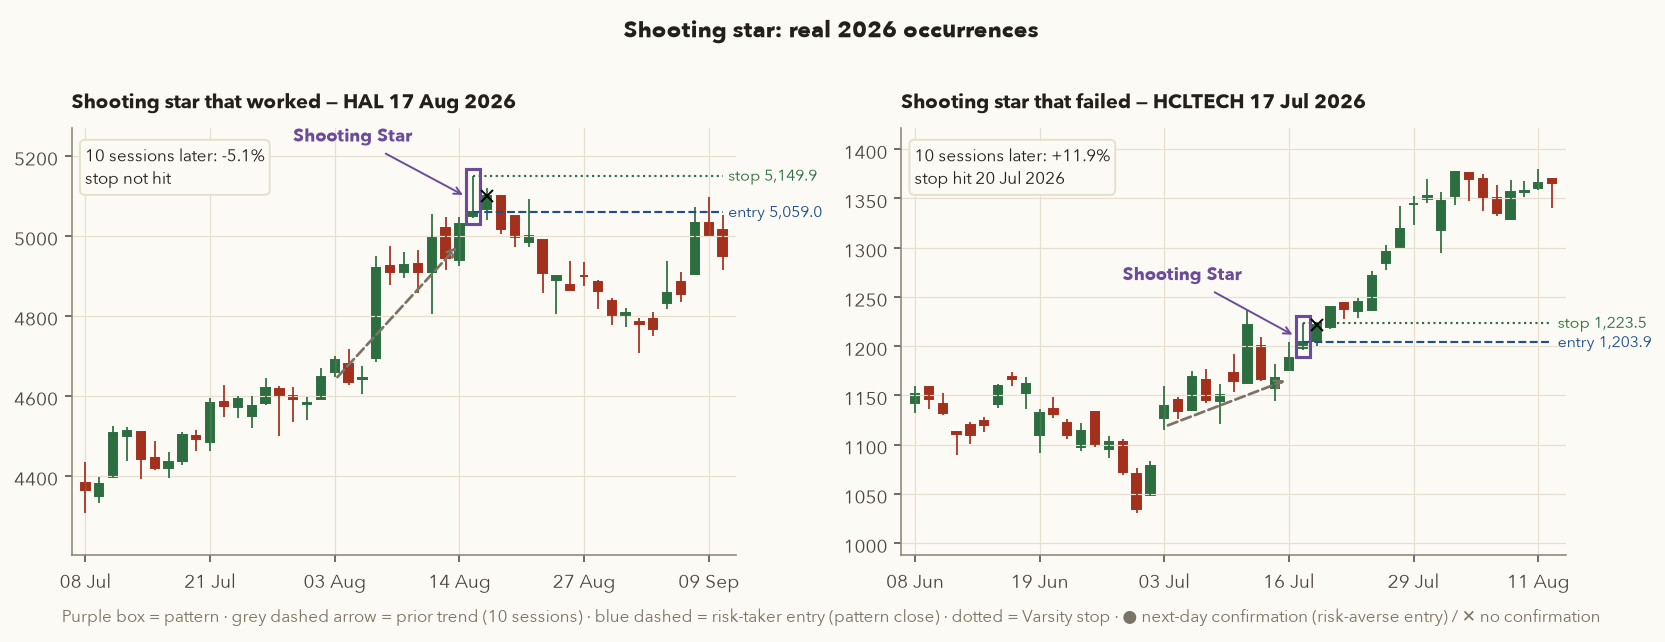
Shooting star after an 8% run
- Prior trend: 4,646.50 → 5,029.90 over 10 sessions = +8.3%, above the 20-day SMA ✔.
- Candle: O 5,050.0, H 5,149.9, L 5,045.0, C 5,059.0. Body = 9.0. Upper shadow = 5,149.9 − 5,059.0 = 90.9, about 10× the body ✔. Lower shadow 5.0 = 4.8% of range ✔. Volume 1.6× average.
- Risk-taker shorts (via futures) ≈ 5,059, stop 5,149.9, risk 90.9 (1.8%).
- 18 Aug closed green (5,067.4 → 5,099.0), so the risk-averse skipped it.
- Outcome: stop never hit. HAL was −5.1% after 10 sessions and −7.2% after 20, about +2.8R for the short. This time the confirmation rule cost the risk-averse a good trade.
14. Engulfing patterns
Now for two-candle patterns. Call the first day P1 and the second P2. In an engulfing pattern, P2's body is opposite in colour to P1's and big enough to swallow P1's body completely.
- \(O_1, C_1\)
- P1's open and close, in ₹. P1 is the first of the two days.
- \(O_2, C_2\)
- P2's open and close, in ₹. P2 is the second day, the day the pattern completes.
- \(C_1 < O_1\): P1 closed below its open, so it is red.
- \(C_2 > O_2\): P2 closed above its open, so it is green.
- \(O_2 \le C_1\): P2 opens at or below P1's close, the bottom of P1's red body.
- \(C_2 > O_1\): P2 closes above P1's open, the top of P1's body. Together, the last two tests mean P2's body covers P1's whole body.
- The bearish version flips every comparison: P1 green, P2 red, P2 opens at or above P1's close and closes below P1's open. Bullish needs a prior downtrend and bearish a prior uptrend (Section 9.1).
Note: Varsity engulfs real bodies only. Shadows don't need to be engulfed. Some textbooks insist on it, but Varsity's view is that practising one consistent definition matters more.
Bullish engulfing logic. In a downtrend, P1 is another red day at a new low. P2 opens at or below P1's close and may even dip lower, then buyers arrive strongly enough to close above P1's open. In one session the bulls have undone the whole previous day. That surprises sellers and may start a reversal. Trade: buy near P2's close (risk-taker). Varsity personally prefers this for multi-candle patterns. Or buy at the close of the day after P2 if it's green (risk-averse). Stop: the lowest low of P1 and P2. The bearish version is the exact mirror: short near P2's close, with the stop at the highest high of P1 and P2.
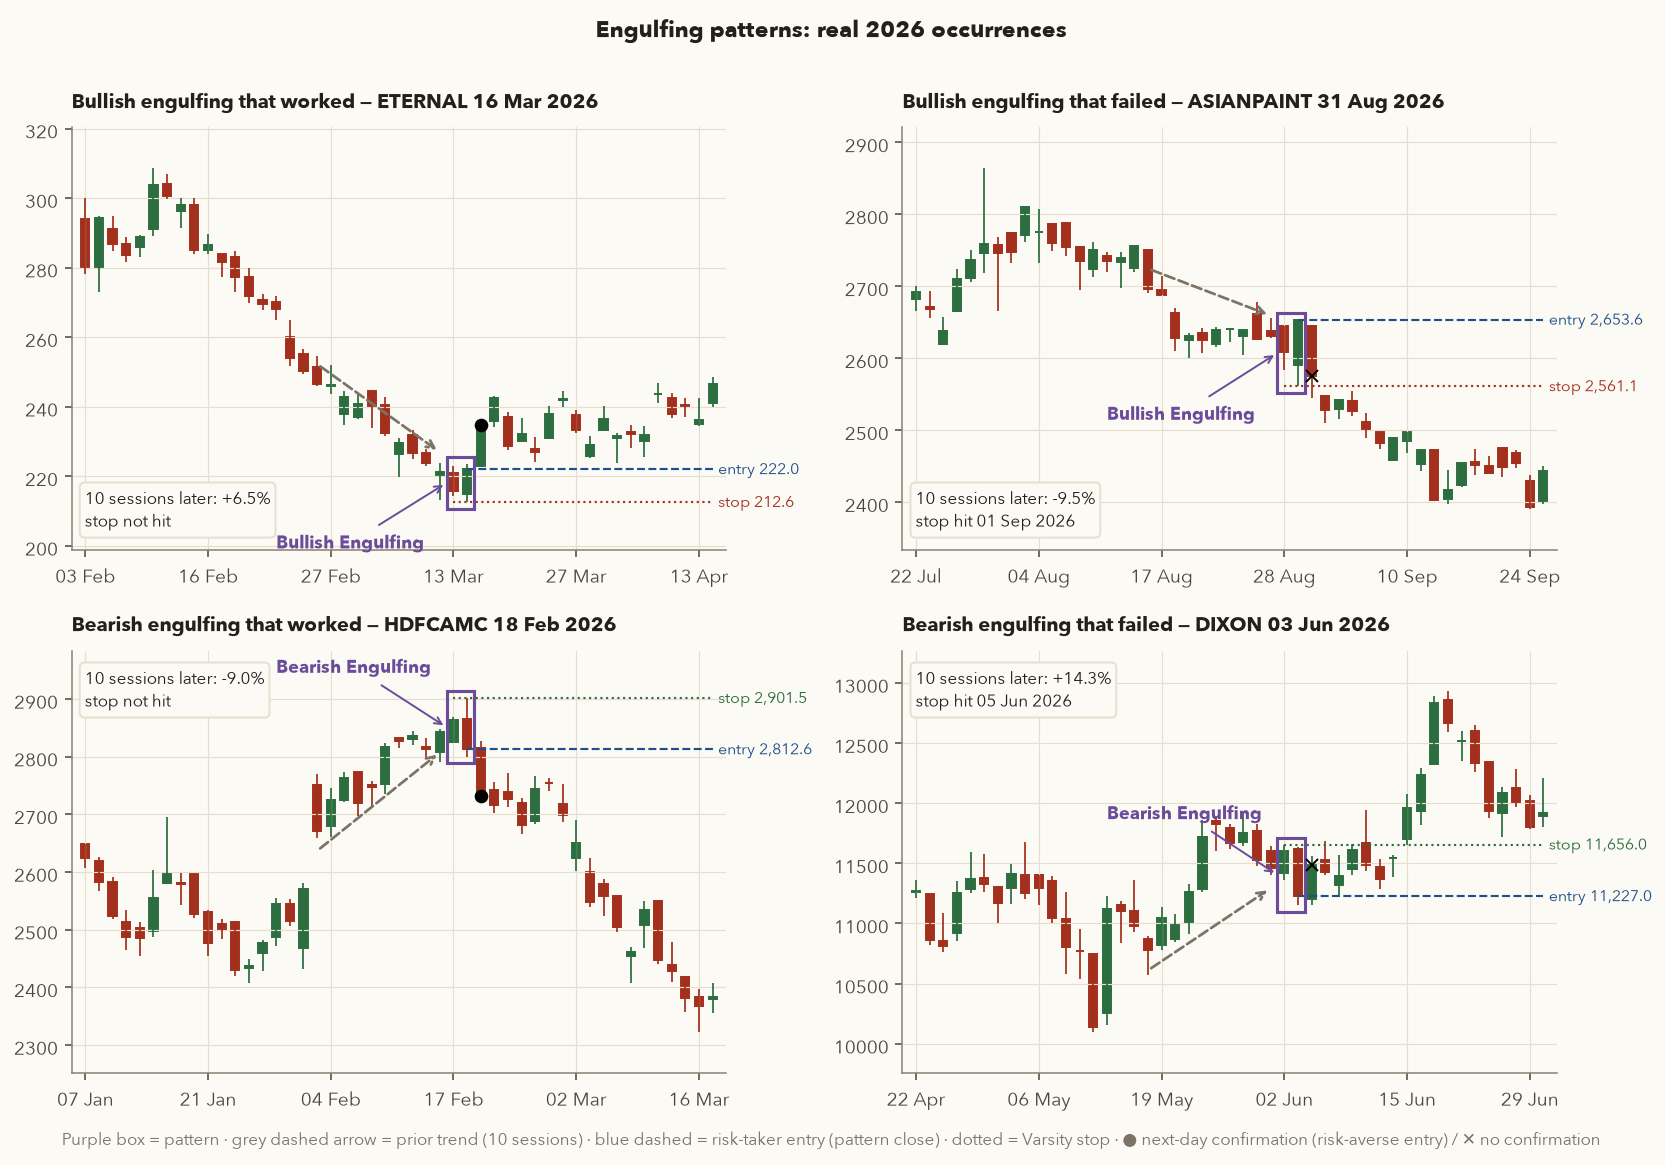
Bullish engulfing after an 11.6% fall
- Prior trend: 250.20 → 221.17 over 10 sessions = −11.6% ✔.
- P1 (13 Mar): O 220.90, H 222.99, L 214.28, C 215.68. Red, body 5.22 (1.26× its 20-day average body, so a genuine red candle, not a doji).
- P2 (16 Mar): O 215.00, H 223.64, L 212.60, C 222.04. Green. Check: O₂ 215.00 ≤ C₁ 215.68 ✔ and C₂ 222.04 > O₁ 220.90 ✔. Engulfing.
- Risk-taker buys ≈ 222.04. Stop = min(214.28, 212.60) = 212.60. Risk 9.44 (4.3%).
- 17 Mar was a strong green day (223.00 → 234.63), so the risk-averse buys ≈ 234.63 with a risk of 22.03 (9.4%). Deeper, again.
- Outcome: stop never hit. +6.5% after 10 sessions, +13.8% after 20 (from P2's close).
A textbook bullish engulfing, on 2× volume, that failed the next day
- Prior 10 sessions: −4.5%. P1 (28 Aug): O 2,645.0, C 2,608.7 (red, body 36.3). P2 (31 Aug): O 2,590.0, H 2,653.6, L 2,561.1, C 2,653.6. It closed at its high on 2.1× average volume. Every box ticked.
- Risk-taker buys ≈ 2,653.6, stop 2,561.1 (3.5% risk).
- 1 Sep opened 2,645.3, fell to 2,545.2 and closed red at 2,575.5. The stop broke the same day. The risk-averse never entered.
- ASIANPAINT was −9.5% 10 sessions later. A perfect-looking pattern with volume confirmation is still only a probability, not a promise.
14.1 A doji right after an engulfing pattern
Varsity describes a setup it finds especially profitable: a bearish engulfing at the top of a rally, then a doji the next day, then a big red candle. The reasoning is that P2 shocks the bulls, the doji leaves them uncertain, and panic plus uncertainty leads to a sharp fall. The broader lesson is to combine patterns and read the chart as a story rather than one candle at a time. We tested this specific claim. Across 37 stocks over 10 years, 323 bearish engulfings were followed by a doji or spinning top. Ten sessions after that third day, the stock was on average +1.69% higher, compared with +1.48% for the 1,230 engulfings without one. The doji did not make the bearish pattern work better in this sample. Read the story, but test the claim.
15. Piercing pattern and dark cloud cover
These are the "partial" versions of engulfing. P2 recovers more than half, but not all, of P1's body.
- \(O_1, C_1\)
- P1's open and close (the first day), in ₹.
- \(O_2, C_2\)
- P2's open and close (the second day), in ₹.
- \(p\)
- Penetration: how much of P1's body P2 wins back, as a fraction of that body (0.5 = 50%).
- The bottom of each fraction is P1's body: \(O_1 - C_1\) for a red P1 (piercing), \(C_1 - O_1\) for a green P1 (dark cloud).
- The top is how far P2's close has moved back into that body from P1's close.
- Divide the two. Above 50% means P2 closed beyond the midpoint of P1's body. At most 100% means it did not go past P1's open; beyond that it would be an engulfing.
- Piercing (after a downtrend): P1 red, P2 green, \(O_2 \le C_1\), P2 closes above the midpoint of P1's body but not above \(O_1\). Dark cloud cover (after an uptrend) is the mirror image: P1 green, P2 red, \(O_2 \ge C_1\). Trade setup and stops are exactly as for engulfing.
Example (Varsity's numbers): if P1's body is 12 points, P2 must win back more than 6 of them, but not more than all 12.
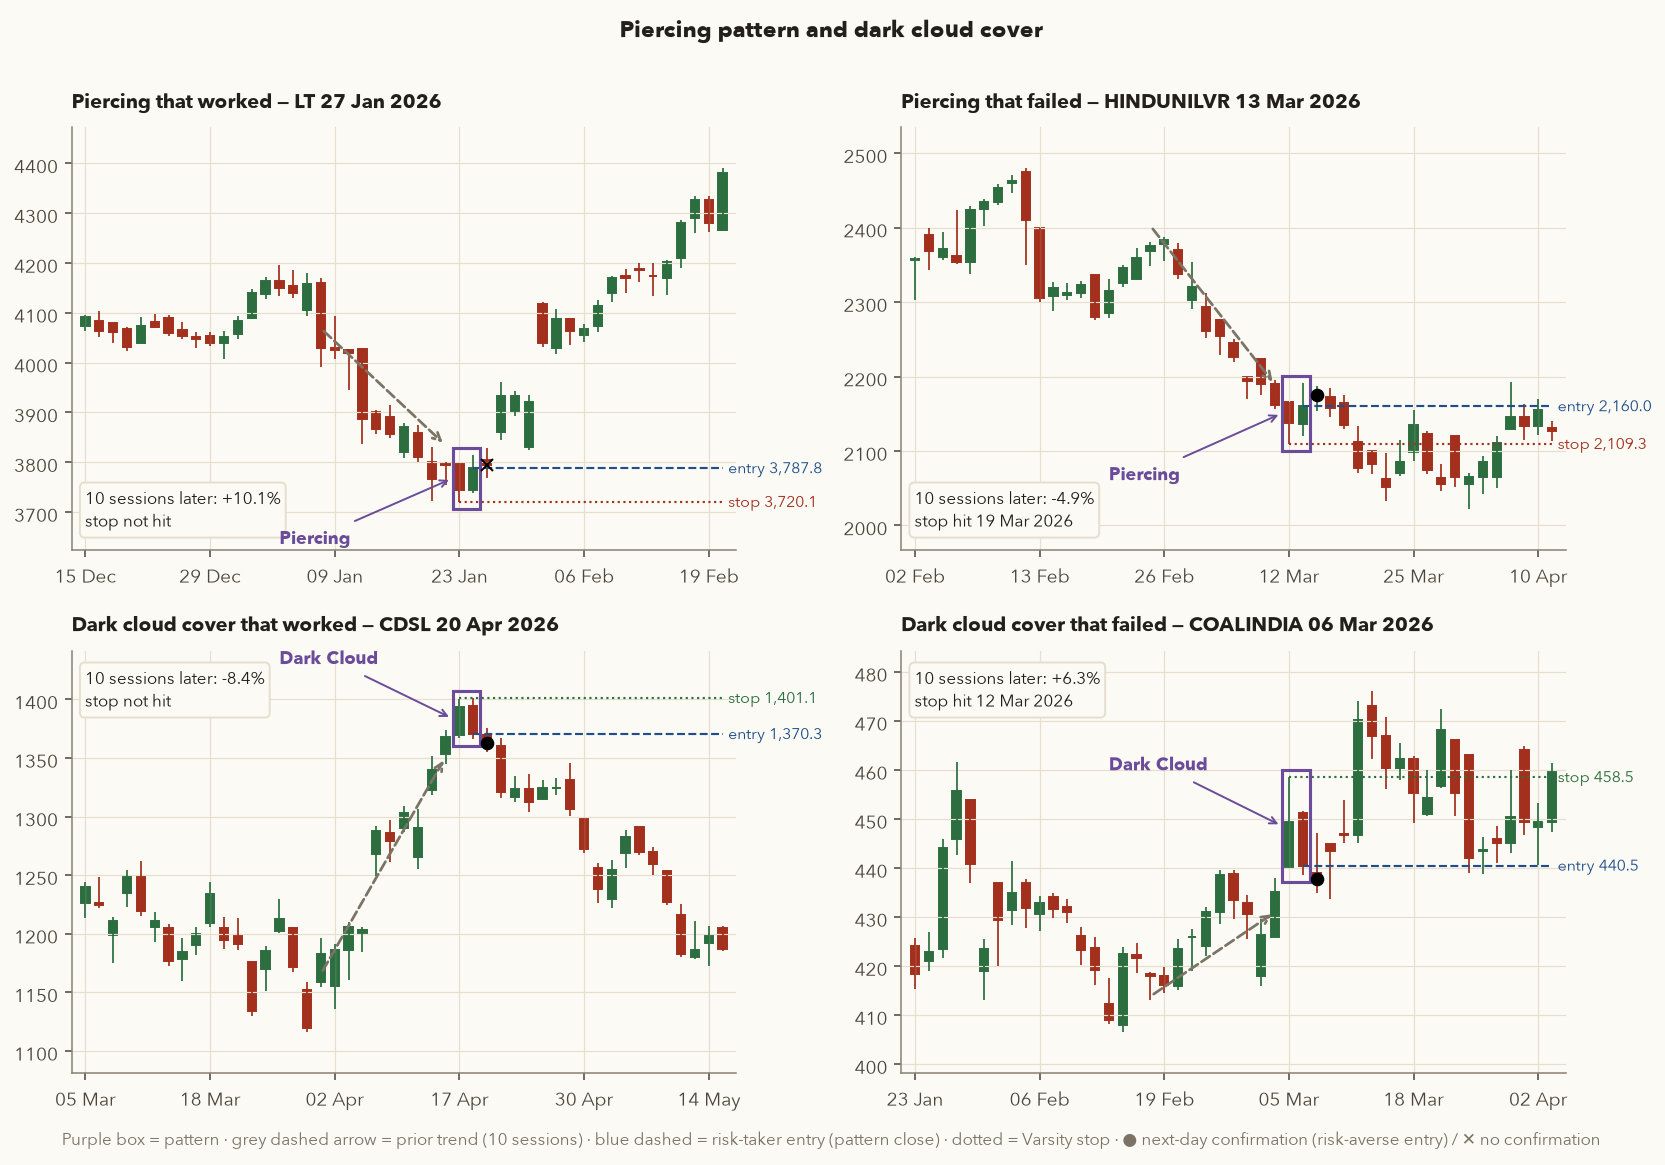
Computing penetration
- Prior trend: 4,157.00 → 3,793.80 over 10 sessions = −8.7% ✔.
- P1 (23 Jan): O 3,798.0, C 3,743.8. Red body = 54.2. Midpoint = (3,798.0 + 3,743.8)/2 = 3,770.9.
- P2 (27 Jan, after the Republic Day holiday): O 3,743.8 (≤ C₁ ✔), C 3,787.8.
- Penetration p = (3,787.8 − 3,743.8)/54.2 = 44.0/54.2 = 81.2%. Above 50% and not engulfing, so it's a piercing pattern ✔.
- Risk-taker buys ≈ 3,787.8. Stop = lowest low of the two days = 3,720.1. Risk 67.7 (1.8%).
- 28 Jan closed slightly red (3,804.3 → 3,794.0), so the risk-averse skipped it. LT was +10.1% after 10 sessions and +12.4% after 20, about +5.6R for the risk-taker.
15.1 Choosing between similar patterns
Stocks in the same sector (TCS and INFY, ICICIBANK and HDFCBANK) often move together, but not identically. On the same day one might print a bearish engulfing and the other a dark cloud cover. All else equal, Varsity prefers the full engulfing, since the stronger move shows more conviction. It also prefers bullish engulfing over piercing. But "all else" rarely is equal. Varsity's later trading checklist asks that a trade meet most of these: (1) a recognisable candlestick pattern, (2) support or resistance near the stop, (3) volume confirmation, (4) agreement with the Dow theory trend (the primary trend defined by higher highs and higher lows, or the reverse; Chapter 3), (5) an acceptable reward-to-risk ratio, (6) indicator confirmation. A weaker pattern that meets 4 checklist items beats a stronger pattern that meets 3. Chapters 3–5 build the rest of that checklist.
16. Harami
Harami is an old Japanese word for "pregnant". A long P1 candle "carries" a small P2 candle of the opposite colour whose body sits inside P1's body.
- \(O_1, C_1\)
- P1's open and close (the first, big candle), in ₹.
- \(O_2, C_2\)
- P2's open and close (the second, small candle), in ₹.
- long
- P1's body is at least its own 20-day average body: the average of \(|C - O|\) over the 20 sessions before P1.
- Bullish: \(C_1 < O_1\) and long, so P1 is a big red candle.
- \(C_2 > O_2\): P2 is green.
- \(O_2 > C_1\) and \(C_2 < O_1\): P2 opens above P1's close and closes below P1's open, so P2's whole body sits inside P1's body.
- The bearish harami is the mirror image: a long green P1, then a small red P2 inside it.
- Prior trend: down for bullish, up for bearish (Section 9.1). Stop: lowest low (bullish) or highest high (bearish) of the two candles.
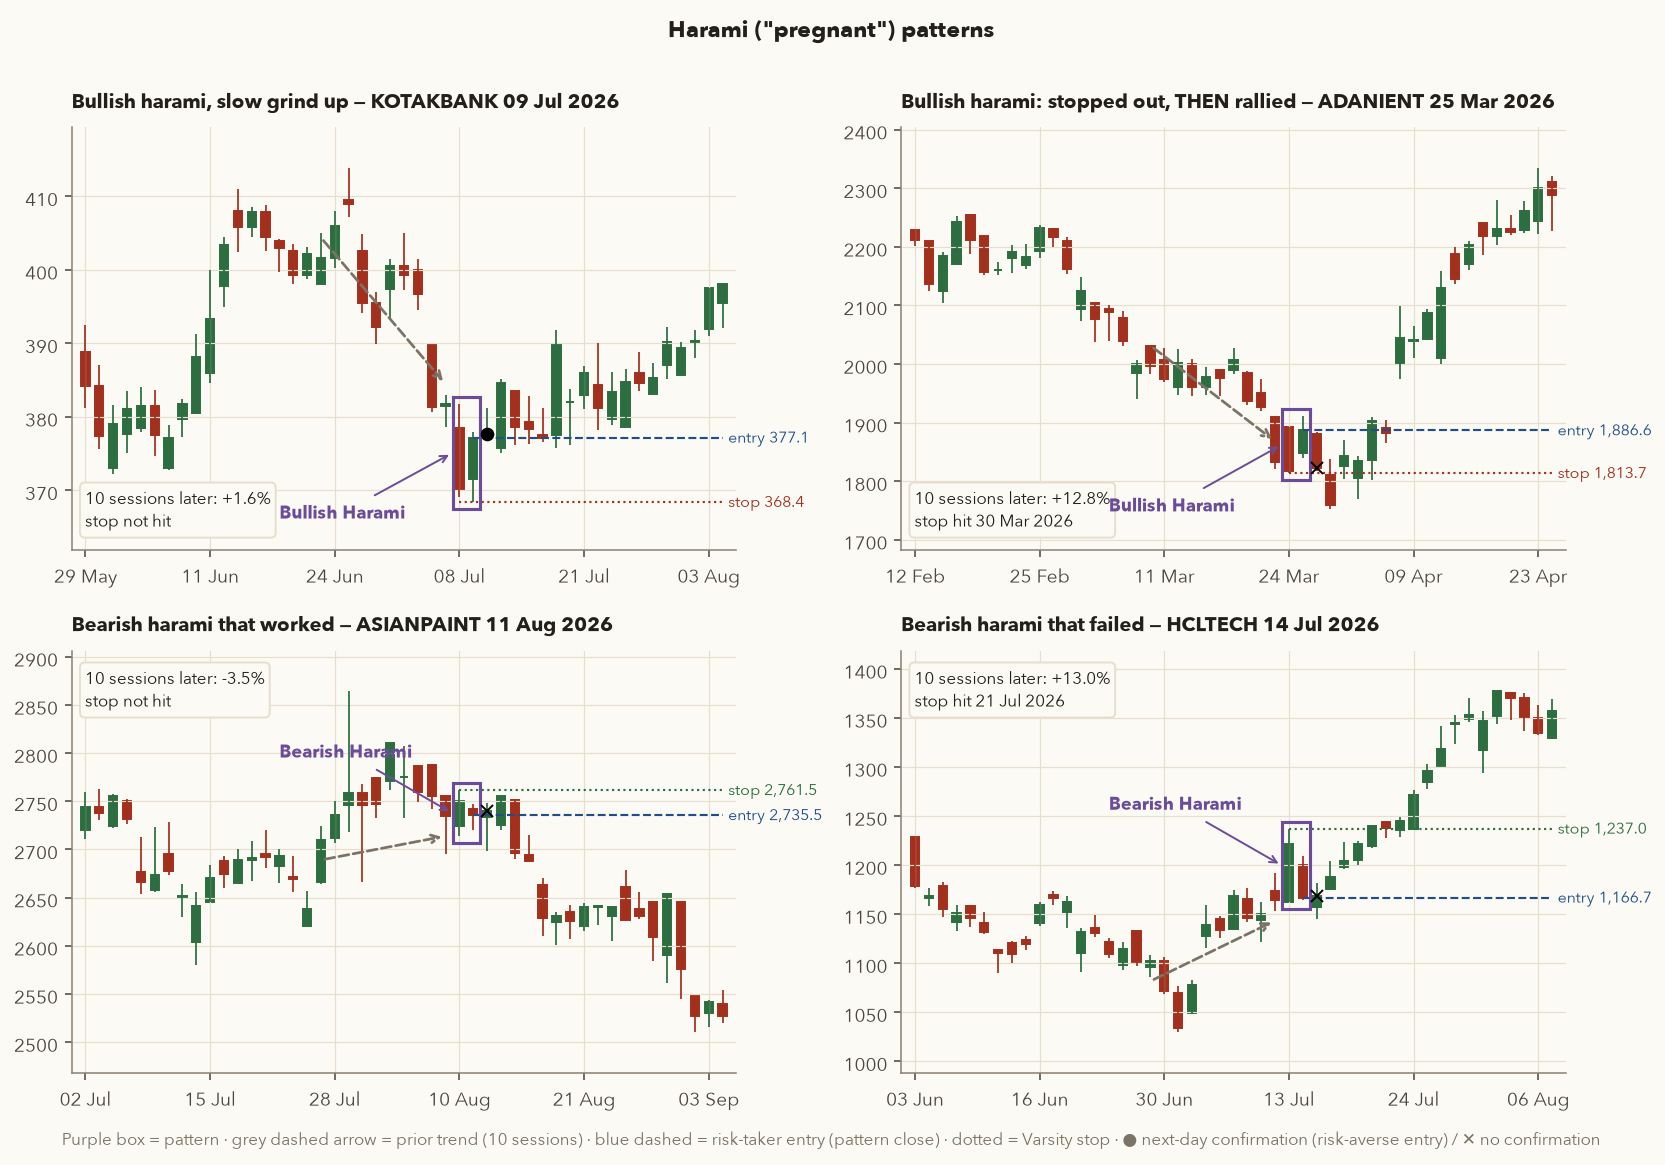
The logic. In a downtrend, P1 is a big red candle at a new low, and sellers look completely in control. P2 then opens higher than P1's close, which sellers didn't expect, and closes green. The candle is small, but it appears when nobody expected it, and that can trigger short-covering (traders who sold short buying back to close their positions) and new buying. A bearish harami is the reverse: after a strong green P1, P2 unexpectedly opens lower and closes red. Because P2 is small, a harami is a weaker signal than an engulfing, and it needs a genuine prior trend. Varsity shows a "harami" after a flat period and explicitly rejects it.
The hardest lesson in trading
- Prior trend: −8.3% over 10 sessions. P1 (24 Mar): O 1,892.7, H 1,893.0, L 1,813.7, C 1,817.9. A red body of 74.8, 2.5× normal.
- P2 (25 Mar): O 1,847.9 (> C₁ ✔), C 1,886.6 (< O₁ ✔), green. A bullish harami.
- Risk-taker buys ≈ 1,886.6, stop = 1,813.7 (3.9% risk). The next session (27 Mar) was red, so the risk-averse stayed out.
- 30 Mar: price broke 1,813.7, and the risk-taker was stopped out for about −1R (−1.05R, because that day opened slightly below the stop).
- Then ADANIENT took off: +12.8% 10 sessions after the pattern and +27.9% after 20.
- Was the stop a mistake? No. On 30 Mar nobody could know what came next. Out of all 729 bullish haramis in our 10-year data, the stop was hit within 10 sessions 63% of the time. Without stops, the losers would have done far more damage than this one missed winner. If you're right about the idea, re-enter on a fresh signal. Don't widen the stop after the fact.
17. Gaps, morning star and evening star
17.1 Gaps
A gap on a daily chart means a stock opens away from the previous close, with no trades in between. A gap-up (open above yesterday's close) shows eager buyers, for example after unexpectedly good results announced in the evening. A gap-down shows eager sellers. For the stars below, "gap" has a specific meaning: the middle candle's body sits beyond the first candle's close, and the third candle opens back across the middle candle's body.
17.2 Morning star (bullish, 3 candles)
- P1: a long red candle in a downtrend. Selling is speeding up.
- P2: gaps down (opens below P1's close), then goes nowhere and forms a doji or spinning top. Sellers had the gap but couldn't extend it. If P2 is a doji, it's called a morning doji star.
- P3: gaps up above P2's body and closes green above P1's open, wiping out P1 completely. (Without P2, P1 and P3 would form a bullish engulfing.)
Trade: both risk-taker and risk-averse buy near P3's close, since the three-day pattern is its own confirmation. Stop: the lowest low of P1–P3. The evening star is the mirror image at the top of an uptrend (long green P1, a doji or spinning top that gaps up, then a red P3 that gaps down and closes below P1's open), with the stop at the highest high of the three.
- P1, P2, P3
- The three candles in order. The subscripts 1, 2, 3 say which candle a price belongs to.
- \(O, C\)
- That candle's open and close, in ₹.
- \(\text{Body}_2, \text{Range}_2\)
- P2's body \(|C_2 - O_2|\) and range (high minus low), in ₹.
- long
- P1's body is at least its own 20-day average body, as for the harami.
- \(\max(O_2, C_2)\)
- The larger of P2's open and close: the top of P2's body.
- prior downtrend
- The Section 9.1 test, measured on the day before P1 (\(n = 3\)).
- P1: red, with a long body.
- P2: a small body, at most 30% of its range (a doji or spinning-top shape), and an open below P1's close: the gap down.
- P3: green, opening above the top of P2's body (the gap up) and closing above P1's open.
- The evening star flips everything: P1 green and long, P2 opens above P1's close, P3 red, opens below the bottom of P2's body \(\min(O_2, C_2)\) and closes below P1's open, after a prior uptrend.
All three conditions, checked
- Prior trend: 454.10 → 413.45 over 10 sessions = −9.0% ✔.
- P1 (27 Mar): O 411.90, C 404.75. Red, body 7.15 (about its average size).
- P2 (30 Mar): O 400.00 < 404.75 (gap down ✔), C 400.65. Body 0.65 is 4.7% of its 13.90 range, so it's a doji.
- P3 (1 Apr): O 415.00 > 400.65 (gap up ✔), C 418.70 > P1 open 411.90 ✔. Morning (doji) star confirmed.
- Entry ≈ 418.70, stop = lowest low = 399.35 (P2's low). Risk 19.35 (4.6%).
- Outcome: stop never hit. +10.5% after 10 sessions (≈ +2.3R).
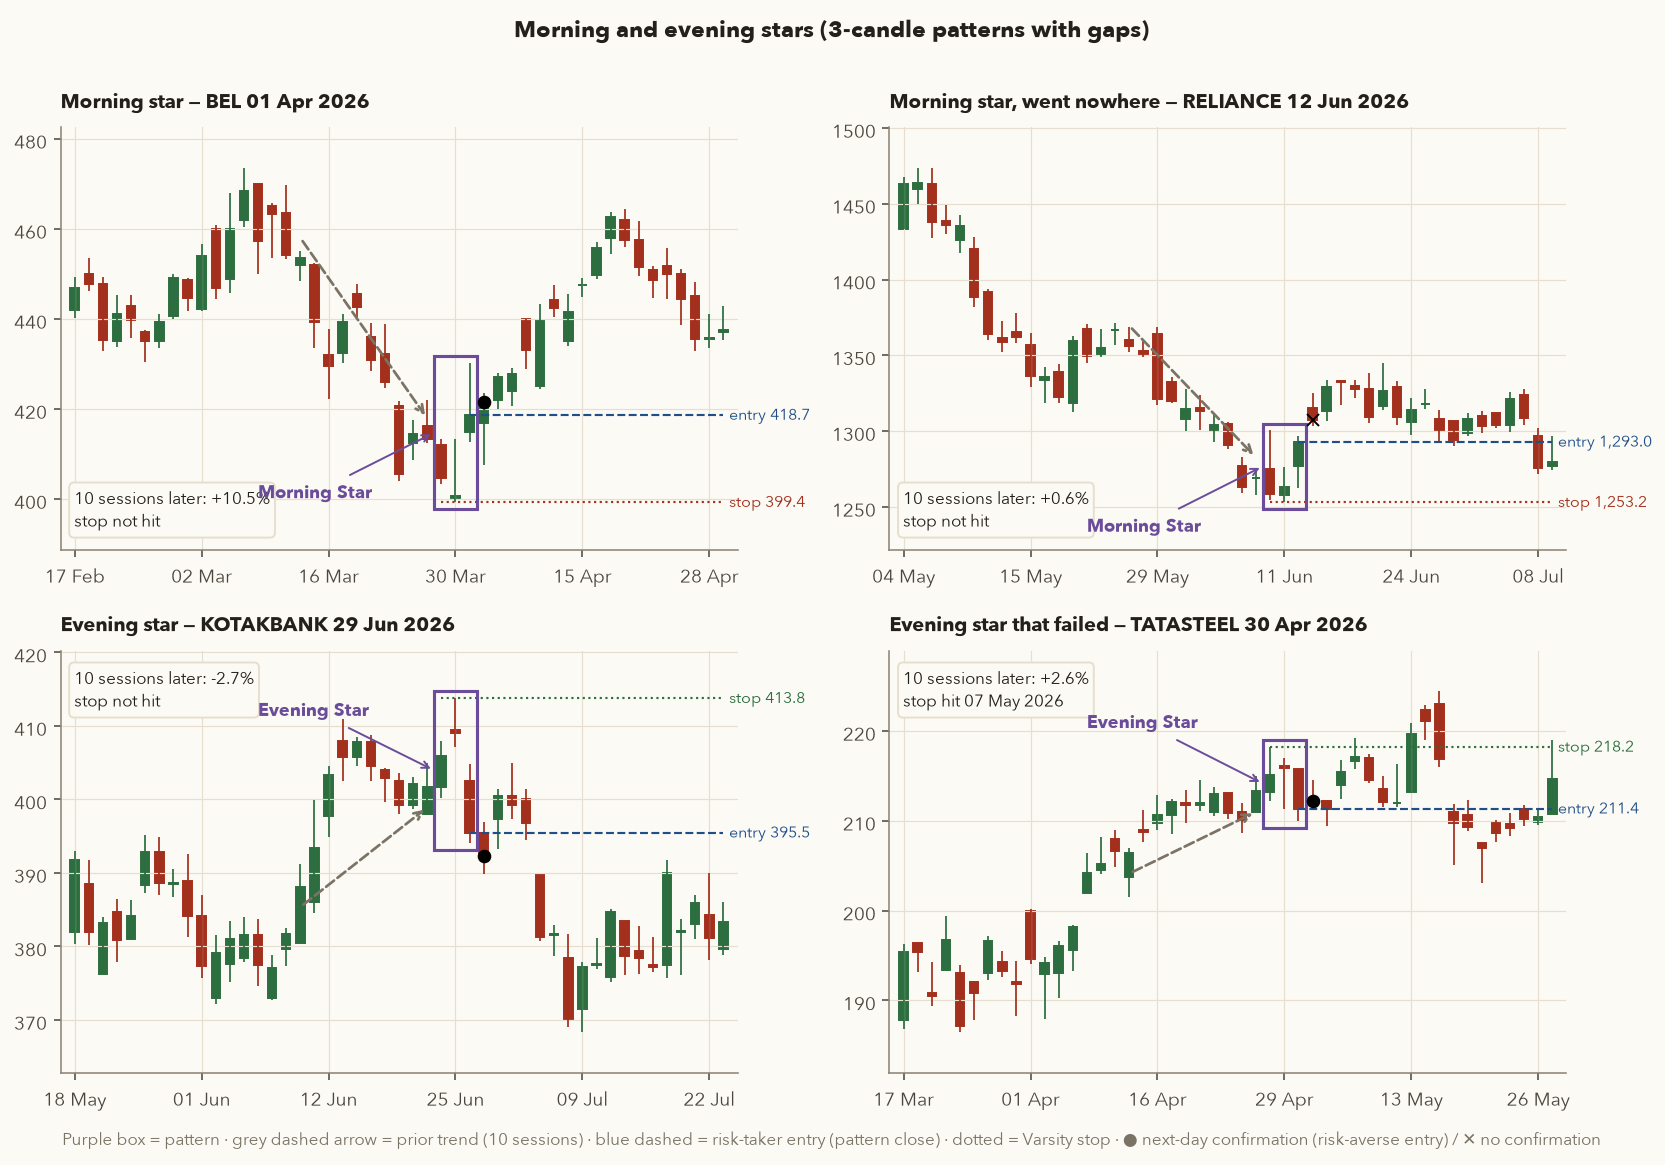
In the 37-stock dataset, strict morning stars appeared only 27 times in 10 years and evening stars 35 times. Gaps between bodies are rare in liquid large caps, and when the rule is met by a few paise, the "gap" means nothing. If you loosen the rule (for example, accept a P3 close above P1's midpoint), you'll find more patterns, but you're then testing a different pattern. Write down which version you trade.
18. All patterns on one page
| Pattern | Candles | Prior trend | Key numeric rule | Action | Stop |
|---|---|---|---|---|---|
| Bullish marubozu | 1 | Any | Green, body ≥ 90% of range | Buy | Low |
| Bearish marubozu | 1 | Any | Red, body ≥ 90% of range | Sell/short | High |
| Spinning top | 1 | Context | Body 10–30% of range, both shadows ≥ 25% | Half size / partial profit | — |
| Doji | 1 | Context | Body ≤ 10% of range | Half size / partial profit | — |
| Hammer | 1 | Down | Lower shadow ≥ 2× body, upper ≤ 10% of range | Buy | Low |
| Hanging man | 1 | Up | Same shape as hammer | Sell/short | High |
| Shooting star | 1 | Up | Upper shadow ≥ 2× body, lower ≤ 10% of range | Sell/short | High |
| Bullish engulfing | 2 | Down | Red P1; green P2 with O₂ ≤ C₁, C₂ > O₁ | Buy | Lowest low |
| Bearish engulfing | 2 | Up | Green P1; red P2 with O₂ ≥ C₁, C₂ < O₁ | Sell/short | Highest high |
| Piercing | 2 | Down | As engulfing, but 50% < penetration ≤ 100% | Buy | Lowest low |
| Dark cloud cover | 2 | Up | Mirror of piercing | Sell/short | Highest high |
| Bullish harami | 2 | Down | Long red P1; green P2 inside its body | Buy | Lowest low |
| Bearish harami | 2 | Up | Long green P1; red P2 inside its body | Sell/short | Highest high |
| Morning star | 3 | Down | Long red, gapped-down doji/spinning top, gapped-up green closing above P1 open | Buy on P3 | Lowest low |
| Evening star | 3 | Up | Mirror of morning star | Sell/short on P3 | Highest high |
Varsity ends the candlestick chapters with the most important point: candlesticks are a way of thinking, not a list of shapes. Once you can read the buyer–seller story, an unnamed shape tells you just as much. You don't need 50 more pattern names.
framework.patterns.detect_candles(df) returns a DataFrame of boolean columns doji, hammer, hanging_man, shooting_star, bullish_engulfing, bearish_engulfing, bullish_harami, bearish_harami, morning_star, evening_star, marubozu, bullish_marubozu, bearish_marubozu. It follows the same ideas, but its defaults are not identical to this chapter's rules. For example, its prior-trend test looks back 5 sessions against a 10-day average instead of 10 sessions and 3%, and it requires the long shadow of a hammer to be at least 60% of the range. So it will flag a slightly different set of days. The exact rules used for every chart and statistic in this chapter are in course/scripts/ch02_patterns.py. Whichever version you use, write its thresholds down and keep them fixed (rule 2).
19. Do candlestick patterns work? 10 years of NSE data
Every example above was chosen to teach something, and I deliberately showed failures next to successes. Hand-picked examples can still prove anything. To find out what patterns actually do, we need every occurrence.
19.1 Method
- Universe: the 37 stocks in the course data (large and mid caps, including RELIANCE, HDFCBANK, TCS, HAL and DIXON), daily data from Oct 2016 to Sep 2026. Events run from 18 Nov 2016 to 1 Sep 2026, so that every event has 20 sessions of future data. Windows touching known data glitches (TMPV's Oct-2025 demerger, a TRENT price discontinuity on 1 Jan 2026, CDSL's listing week) are excluded.
- Detection: the exact numeric rules in this chapter (
ch02_patterns.detect). - Measurement: the close-to-close forward return \(r_{t,h} = C_{t+h}/C_t - 1\) for h = 5, 10 and 20 sessions, measured from the pattern-day close (the risk-taker's entry).
- Baselines: (a) every day for the same stocks, n = 85,490. Over 10 sessions, the average stock day returned +0.84% and rose 54.8% of the time. That's the bull-market drift. (b) A matched baseline: every day that followed the same kind of trend. Days after a downtrend averaged +0.63% (n = 19,249) and days after an uptrend +0.99% (n = 26,684).
- Mechanical trade: enter at the pattern close and exit at Varsity's stop (or at the open if price gaps through it) or after 10 sessions, measured in R. As a yardstick, the same test was run with a long entry on every day (stop at that day's low) and a short entry on every day (stop at that day's high).
19.2 Results
| Pattern | n | Avg 5d | Avg 10d | Avg 20d | % up after 10d | Stop hit ≤10d | Avg R |
|---|---|---|---|---|---|---|---|
| Bullish engulfing | 600 | +0.47% | +0.92% | +2.25% | 54.0% | 53.0% | +0.23 |
| Hammer | 295 | +0.22% | +0.19% | +1.09% | 52.5% | 65.8% | +0.35 |
| Bullish marubozu | 538 | +0.64% | +0.95% | +1.71% | 58.7% | 42.0% | +0.26 |
| Morning star | 27 | +1.47% | +2.32% | +3.43% | 81.5% | 14.8% | +0.59 |
| Bearish engulfing | 1,551 | +0.44% | +1.34% | +2.36% | 58.5% | 66.5% | −0.22 |
| Shooting star | 412 | +0.23% | +0.91% | +1.59% | 55.3% | 73.3% | −0.26 |
| Bearish marubozu | 840 | +0.31% | +0.82% | +1.21% | 53.7% | 57.4% | −0.11 |
| Evening star | 35 | +0.29% | +1.22% | +2.11% | 60.0% | 48.6% | −0.24 |
| Baseline: all days | 85,490 | +0.42% | +0.84% | +1.69% | 54.8% | — | — |
| Random long, stop at day's low | 81,749 | — | — | — | — | — | +0.39 |
| Random short, stop at day's high | 82,132 | — | — | — | — | — | −0.27 |
Returns are averages of close-to-close percentage moves after the pattern. For bearish patterns, a positive number means the stock went up, which is bad for a short. "Avg R" is before brokerage, STT (securities transaction tax) and slippage (the gap between the price you planned and the price you got); Chapter 13 covers costs.
ch02_figures.py.19.3 What the numbers say
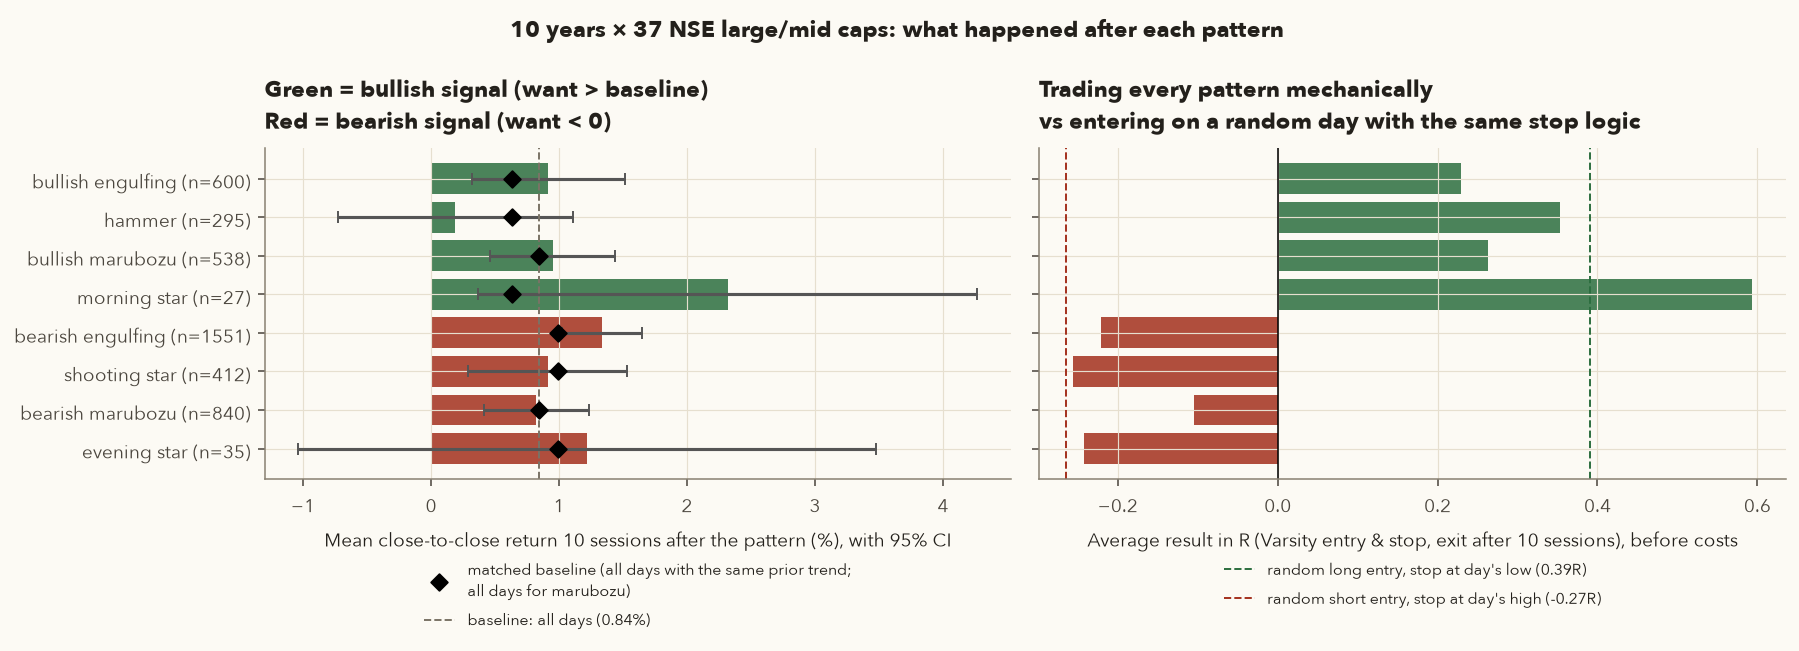
- Bullish patterns barely beat doing nothing. Bullish engulfing averaged +0.92% over 10 sessions, against +0.63% for any day after a downtrend. The 95% interval (±0.61 points) easily includes the baseline. (A 95% interval is the range the true average could plausibly sit in, given how much the individual results vary. If it contains the baseline, the difference may just be luck.) The hammer did worse than the baseline (+0.19%). Bullish marubozus did a little better (+0.95%, up 58.7% of the time) than the +0.84% all-day average.
- Bearish patterns, on their own, lost money for shorts. After bearish engulfing, shooting star, bearish marubozu and evening star, prices on average went up over the next 10–20 sessions. After 1,551 bearish engulfings the average was +1.34%, more than the +0.99% for any day after an uptrend. Strong stocks in a bull market tend to keep rising, and one bearish candle didn't change that. As shorts, every bearish pattern had a negative average R. They were only slightly less bad than shorting on a random day (−0.27R).
- The R numbers don't rescue the patterns. All bullish patterns show a positive average R, but so does buying on any random day with a stop at that day's low (+0.39R, driven by the market's upward drift). The median R was −1 for most patterns. Typically the stop was hit, and a few large winners pulled the average up. This is before costs.
- The stars look best, but the samples are tiny. 27 morning stars at +2.32% have a 95% interval of roughly +0.4% to +4.3%. That's very wide, and 27 cases are too few to rely on.
- Stops get hit a lot. Within 10 sessions the stop was hit 53% of the time for bullish engulfing, 66% for hammers, 73% for shooting stars and 93% for hanging men. Patterns with stops very close to the entry are stopped out by ordinary noise.
- Results drift over time. Bullish engulfing averaged +1.50% (10d) in 2016–mid-2021 and +0.48% in mid-2021–2026. Shooting star went from +1.19% to +0.69%. An "edge" that changes this much between periods is weak.
19.4 Does context help?
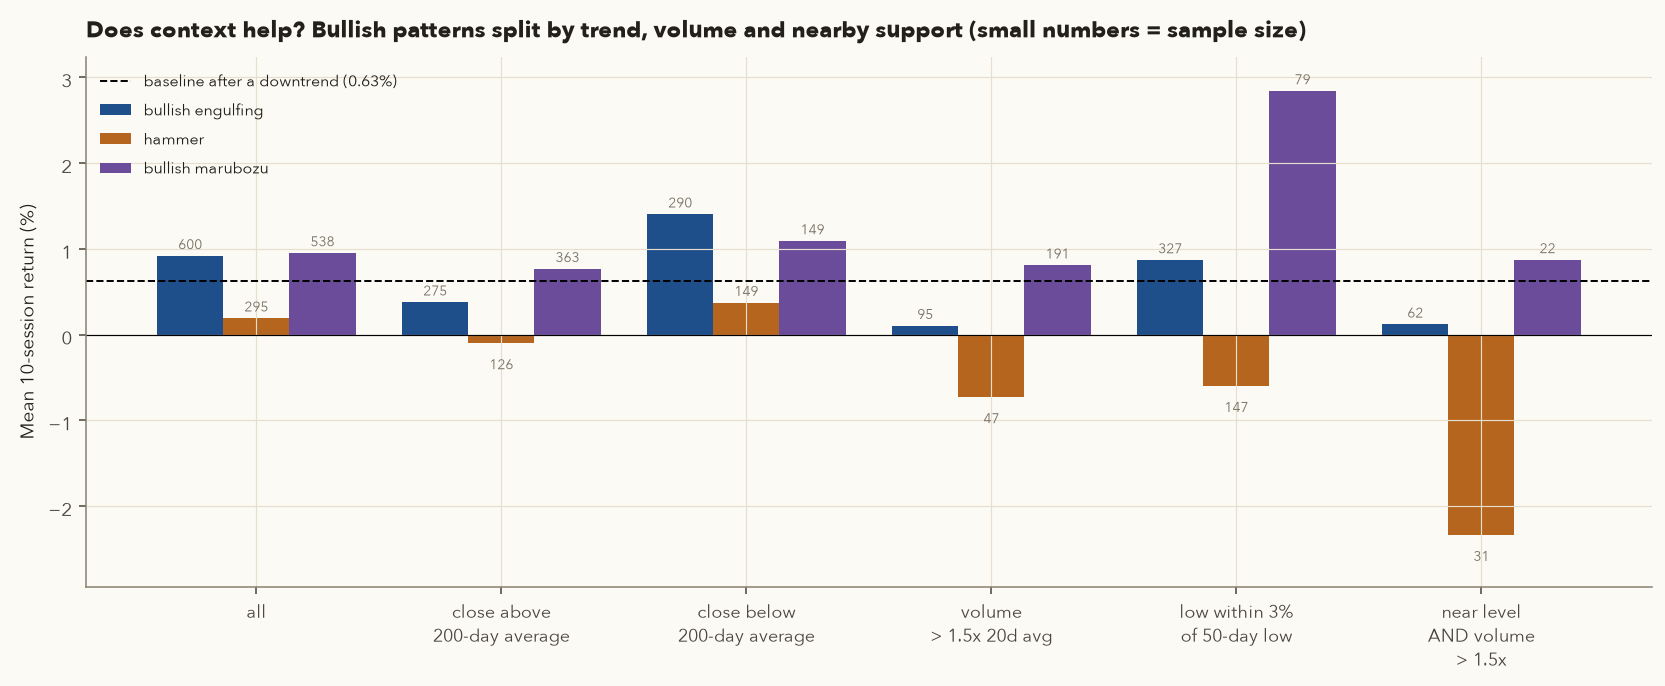
Varsity never meant patterns to be traded alone. They're the first item on a checklist. So we split the bullish patterns by three common filters:
| Filter | Bull. engulfing 10d (n) | Hammer 10d (n) | Bull. marubozu 10d (n) |
|---|---|---|---|
| All | +0.92% (600) | +0.19% (295) | +0.95% (538) |
| Close above 200-day average | +0.38% (275) | −0.10% (126) | +0.77% (363) |
| Close below 200-day average | +1.40% (290) | +0.37% (149) | +1.09% (149) |
| Volume > 1.5× 20-day average | +0.10% (95) | −0.73% (47) | +0.81% (191) |
| Pattern low within 3% of the 50-day low ("near support") | +0.87% (327) | −0.60% (147) | +2.84% (79) |
| Near support AND volume > 1.5× | +0.12% (62) | −2.34% (31) | +0.87% (22) |
Honest reading: no simple filter turned the hammer or bullish engulfing into a reliable edge. Some filters even hurt, and the samples shrink quickly. The marubozu near a 50-day low (+2.84%, 79 cases) is interesting but too small and too likely to be luck to trade on as it stands. Crude filters like these aren't proper context. Chapter 3's support and resistance are drawn more carefully, Chapter 4 adds indicators, and Chapter 12 shows how to test a full rule set (entry + trend filter + stop + target + position size + costs) without fooling yourself.
- Don't buy just because you see a hammer, and don't short just because you see a shooting star. Our data says that alone is roughly a coin-flip, before costs.
- Use candles to time and define risk in a trade you already like for other reasons (trend, a level, relative strength, fundamentals).
- Treat bearish candles in a strong uptrend mainly as a reason to tighten stops or take partial profits, not as a reason to short.
- Any pattern claim, including those in books, courses and Varsity, should be tested against a baseline before you put money on it.
20. Try it yourself
These snippets need a copy of the course repository and Python with pandas and numpy (setup steps are in its framework/README.md). Run them from the repository's root folder, for example with .venv/bin/python, because the file paths are relative to that folder. The full detector and every figure in this chapter can be rebuilt with .venv/bin/python course/scripts/ch02_figures.py.
20.1 Resample daily candles to weekly and monthly
import pandas as pd
DATA = "data/ohlc/"
df = pd.read_csv(DATA + "IDX_NSEI.csv", index_col=0, parse_dates=True)
agg = {"Open": "first", "High": "max", "Low": "min", "Close": "last"}
weekly = df[list(agg)].resample("W-FRI").agg(agg).dropna()
monthly = df[list(agg)].resample("ME").agg(agg).dropna()
print(weekly.loc["2026-09-25"].round(2))      # the week of 21-25 Sep 2026
print(len(df.loc["2025"]), "daily candles in 2025")
Expected: Open 23,330.20, High 23,489.00, Low 23,020.95, Close 23,140.50 (matching Section 7), and 249 daily candles in 2025.
20.2 Find hammers with Varsity's rules, quantified
import pandas as pd
DATA = "data/ohlc/"
df = pd.read_csv(DATA + "BAJFINANCE.csv", index_col=0, parse_dates=True)
o, h, l, c = df.Open, df.High, df.Low, df.Close
body  = (c - o).abs()
upper = h - pd.concat([o, c], axis=1).max(axis=1)
lower = pd.concat([o, c], axis=1).min(axis=1) - l
rng   = h - l
# prior downtrend: down >= 3% over 10 sessions AND below the 20-day average (measured on yesterday's close)
prev = c.shift(1)
down = (prev / c.shift(11) - 1 <= -0.03) & (prev < c.rolling(20).mean().shift(1))
size_ok = (rng / prev).between(0.01, 0.10)          # Varsity's "trade trap" filter
hammer = (lower >= 2 * body) & (upper <= 0.10 * rng) & (body > 0.02 * rng) & size_ok & down
print(df.loc[hammer, ["Open", "High", "Low", "Close"]].loc["2026"].round(2))
Expected 2026 hammers: 22 Jan, 23 Mar (the example in Section 12), 3 Jun and 11 Sep. Try it: change 2 * body to 3 * body and watch how many disappear. That's rule 2, "quantify", in action.
20.3 Bearish engulfing and what happened 10 sessions later
import pandas as pd
DATA = "data/ohlc/"
df = pd.read_csv(DATA + "HDFCAMC.csv", index_col=0, parse_dates=True)
o, c = df.Open, df.Close
o1, c1 = o.shift(1), c.shift(1)
up = (c.shift(2) / c.shift(12) - 1 >= 0.03) & (c.shift(2) > c.rolling(20).mean().shift(2))
bear_engulf = (c1 > o1) & (c < o) & (o >= c1) & (c < o1) & up
fwd10 = c.shift(-10) / c - 1                       # return 10 sessions later
res = pd.DataFrame({"close": c, "fwd10_%": fwd10 * 100})[bear_engulf]
print(res.loc["2026"].round(2))
print("all signals:", len(res.dropna()), " mean fwd10 %:", round(res["fwd10_%"].mean(), 2),
      " baseline fwd10 %:", round(fwd10.mean() * 100, 2))
Expected 2026 signals: 6 Feb at 2,719.80 → −0.15%, and 18 Feb at 2,812.60 → −9.02%, which is the Section 14 example. Across all 41 HDFCAMC signals the average 10-session return was +1.96%, against a +0.71% baseline. On this stock the bearish signal was followed by above-average gains, matching the 37-stock result. Repeat with your favourite stocks.
Wrap the measurements into a function anatomy(df) returning body, upper, lower and range. Then write detect_candles(df) with one boolean column per pattern. Compare your output with course/scripts/ch02_patterns.py. The framework's framework.patterns.detect_candles follows the same design.
21. Practical checklist: reading candles before a trade
- I've looked at the weekly chart first. I know the bigger trend and I'm not fighting it without a reason.
- On the daily chart I can name the prior trend into this pattern (≈ 3%+ over 10 sessions, on the right side of the 20-day average).
- The pattern meets my written numeric rule (body/shadow ratios, engulf or penetration conditions, gaps).
- The signal candle's range is between 1% and 10% of the previous close (trade-trap check).
- I've decided in advance whether I'm the risk-taker (enter on the completion day: ~3:20 pm for non-F&O stocks; for F&O stocks, check by 3:15 pm and use the closing auction, or the futures before 3:40 pm) or the risk-averse trader (enter only after a confirming candle).
- The stop is at the pattern's lowest low (long) or highest high (short). If that's absurdly tight (hanging man), I've widened it to a logical level and resized.
- Position size = (capital × risk%) ÷ risk per share. Risk per trade ≤ 1–2% of capital.
- There's a reason beyond the candle: support or resistance near the stop, a volume surge, a trend filter, or relative strength (Chapters 3–5).
- For short trades I know which instrument I'll use (stock futures or options). Otherwise I treat the bearish candle as an exit or trim signal for my long.
- I'll log the trade with the pattern name so I can measure my own results later (Chapter 12).
22. Key takeaways
- TA builds a trading view (direction, entry, stop, target, holding period) from price and volume. It rests on four assumptions: markets discount everything, the how matters more than the why, prices trend, and history repeats only when the conditions repeat.
- TA tells you when and where you're wrong. FA tells you what to own. Swing traders lean on TA, investors on FA plus TA for timing.
- OHLC summarises any period. Candles show it most clearly: body = open↔close, shadows = high and low, colour = who won. On NSE, the official close is a VWAP or, since Aug 2026 for F&O stocks, a closing-auction price.
- Match the timeframe to your holding period. Swing: daily, checked against weekly. Positional: weekly. Investing: monthly and weekly. Build higher timeframes with first-open, max-high, min-low, last-close.
- Varsity's three rules: buy strength and sell weakness, be flexible but quantify, require a prior trend (the marubozu is the exception). Stops sit at the pattern's lowest low or highest high. Avoid candles with a range under 1% or over 10%.
- Single-candle patterns: marubozu, spinning top, doji, hammer and hanging man, shooting star. Multi-candle: engulfing, piercing and dark cloud, harami, morning and evening star. Each one tells a buyer–seller story you can reason out.
- Over 10 years on 37 NSE stocks, patterns traded alone showed little or no edge over a matched baseline, and bearish patterns in a bull market were usually followed by more gains. Use candles to time entries and define risk inside a broader plan, and always test claims against a baseline.
23. Quiz and exercises
Q1. A stock's daily data: O 456, H 470, L 420, C 435. What colour is the candle? Calculate the body, both shadows and the body as a % of range.
C < O, so it's red (bearish). Body = |435 − 456| = 21. Upper shadow = H − max(O, C) = 470 − 456 = 14. Lower shadow = min(O, C) − L = 435 − 420 = 15. Range = 470 − 420 = 50, so body/range = 21/50 = 42%. (This is Varsity's own bearish-candle example.) It's not a doji (needs ≤ 10%) and not a spinning top (needs ≤ 30%). It's an ordinary red candle.
Q2. Build the weekly candle for these five days: (O,H,L,C) Mon 430/444/425/438, Tue 445/455/438/450, Wed 445/455/430/437, Thu 436/441/428/440, Fri 441/452/439/449.
Weekly O = Monday's open = 430. H = max(444, 455, 455, 441, 452) = 455. L = min(425, 438, 430, 428, 439) = 425. C = Friday's close = 449. Since 449 > 430, it's a green weekly candle with body 19, range 30 and upper shadow 6. Wednesday was red on the daily chart, but the week was clearly up.
Q3. Using our rules, is this a marubozu? Previous close 1,000. Today O 1,002, H 1,061, L 1,000, C 1,055. What would the risk-taker do, and where is the stop?
Body = 53, range = 61, so body/range = 53/61 = 86.9%. Under the 90% rule it's not a marubozu. The upper shadow of 6 is ~10% of range. Range as % of the previous close = 61/1,000 = 6.1%, within 1–10%. This is the "quantify" rule doing its job. A looser rule (say 85%) would accept it, but you must decide the threshold before looking at the outcome. If you did count it, the risk-taker would buy ≈ 1,055 with the stop at the low of 1,000 (risk 55 = 5.2%).
Q4. Hammer or not? Prior 10-session return −6%, close below the 20-day SMA. Today: O 200.0, H 201.0, L 192.0, C 200.6, previous close 201.5.
Body = 0.6. Lower shadow = min(200.0, 200.6) − 192.0 = 8.0, which is 13× the body ✔. Upper shadow = 201.0 − 200.6 = 0.4. Range = 9.0, so the upper shadow is 4.4% of range ✔ (≤ 10%). Body = 6.7% of range, above the 2% floor ✔. Range/previous close = 9.0/201.5 = 4.5% ✔. Prior downtrend ✔. Yes, a hammer. Risk-taker: buy ≈ 200.6, stop 192.0, risk 8.6 (4.3%). With ₹3,00,000 capital and 1% risk (₹3,000), size = ⌊3,000/8.6⌋ = 348 shares.
Q5. P1: O 214, H 220, L 213.3, C 218.75. P2: O 220, H 221, L 207.3, C 209.4, after an uptrend. Name the pattern, the entry and the stop.
P1 is green and P2 red. O₂ 220 ≥ C₁ 218.75 ✔ and C₂ 209.4 < O₁ 214 ✔, so P2's body engulfs P1's body: a bearish engulfing (Varsity's Ambuja Cements example). Risk-taker: short ≈ 209.4 near P2's close (via futures in India). Stop = highest high of P1 and P2 = 221. Risk = 11.6 (5.5%). Risk-averse: short the next day only if it closes red.
Q6. P1 red: O 500, C 480. P2 green: O 478, C 493. Piercing, engulfing, or neither? Calculate the penetration.
P1 body = 20, midpoint 490. O₂ 478 ≤ C₁ 480 ✔. Penetration p = (493 − 480)/(500 − 480) = 13/20 = 65%. That's more than 50% but below 100%, so it's a piercing pattern, provided there was a prior downtrend. If P2 had closed above 500, it would be a bullish engulfing. Below 490, neither (Varsity rejects anything under 50%). Stop: the lower of the two lows.
Q7. Using the real BEL data in Section 17 (P1 27 Mar 2026: O 411.90 C 404.75; P2 30 Mar: O 400.00, H 413.25, L 399.35, C 400.65; P3 1 Apr: O 415.00 C 418.70), check every morning-star condition. Is P2 a doji or a spinning top?
P1 red ✔ (404.75 < 411.90). P2 gap down: O₂ 400.00 < C₁ 404.75 ✔. P2 body = 0.65, range = 413.25 − 399.35 = 13.90, so body/range = 4.7%, under 10%: a doji. That makes it a morning doji star. P3 gap up: O₃ 415.00 > max(400.00, 400.65) ✔. P3 green ✔ and C₃ 418.70 > O₁ 411.90 ✔. Prior 10-session trend −9.0% ✔. Entry ≈ 418.70, stop 399.35, risk 19.35. BEL was +10.5% ten sessions later, about +2.3R.
Q8. In Section 19, bullish engulfing averaged +0.92% over 10 sessions. Why isn't that evidence of an edge?
(1) Baseline: the average day after a downtrend returned +0.63% anyway, and all days +0.84%. The extra is only ~0.3 points. (2) Noise: with n = 600, the standard error is about 0.31 points, so the 95% interval is roughly +0.31% to +1.53%, which comfortably contains the baseline. (3) Stability: the result fell from +1.50% (2016–21) to +0.48% (2021–26). (4) Costs: brokerage, STT, stamp duty and slippage (Chapter 13) eat into a sub-1% edge. (5) The R test: mechanically trading it gave +0.23R, less than buying on random days with a similar stop (+0.39R).
Q9. You're a risk-averse trader. A perfect hammer forms. The next day opens higher, but by 3:15 pm the stock is red for the day. What do you do, and why?
Nothing. Don't buy. Rule 1 (buy strength, sell weakness) requires the confirmation day to close green. A red confirmation day means sellers are still active. HDFCBANK on 17–18 Mar 2026 (Section 12) is a real case: the risk-averse stayed out, and the stock was −11.2% ten sessions later. The cost of this rule is that you'll sometimes miss winners (HAL's shooting star in Section 13). That's a fair trade-off, and you should accept it in advance.
Q10. Exercise: a stock is in a strong uptrend, and you hold it from 20% lower. A shooting star forms on 1.6× average volume. Using this chapter's data and Varsity's spinning-top advice, write a plan.
Facts: across 412 shooting stars, prices on average rose 0.91% over the next 10 sessions and the candle's high was taken out within 10 sessions 73% of the time. Shorting it outright was a losing strategy. A sensible holder's plan: (1) don't short; (2) book part of the profit (e.g. one-third to one-half), as Varsity suggests for indecision at the top of a rally; (3) raise the stop on the rest to below the shooting star's low or a nearby support; (4) if a red confirmation day follows and support breaks, exit more; if the high is taken out, the trend has absorbed the rejection, so keep riding the remainder. This turns a weak signal into risk management instead of a prediction.
Q11. Why is a Heikin-Ashi chart unsuitable for placing a stop-loss? Use the RELIANCE 2 Jan 2026 numbers.
HA values are averages, not trades. On 2 Jan 2026 the real open was 1,580.0, but the HA open was 1,576.44 and the HA low was also 1,576.44. RELIANCE never traded at 1,576.44 that day (the real low was 1,578.2). A stop placed at the "HA low" would sit at a level unrelated to where buyers actually defended price. Read the trend from HA, and set entries and stops from real OHLC candles.
Q12. Two stocks print the same shape today: small body at the top of the range, lower shadow four times the body, almost no upper shadow, range 3% of the previous close. Stock A has fallen 9% in 10 sessions; stock B has risen 7%. Name each candle, the trade, and the stop. Which one does this chapter's data trust less, and why?
Stock A (after a fall) is a hammer: a long setup, stop at the candle's low. Stock B (after a rise) is a hanging man: a short setup (via futures) or a reason to protect a long, stop at the candle's high. The shape is identical, so only the prior trend decides the name (rule 3). Both pass the 1–10% trade-trap check. The hanging man is trusted less: Varsity notes that price still recovered to close near the high, and because the close sits near the high, the stop is very tight. In the 10-year test, 93% of hanging-man stops were hit within 10 sessions (Section 12). A holder of stock B would more sensibly tighten the stop on the long than open a short.
24. Sources
Zerodha Varsity, Module 2 "Technical Analysis" (concepts explained here in our own words):
Ch 1 Background ·
Ch 2 Introducing Technical Analysis ·
Ch 3 Chart Types ·
Ch 4 Getting Started with Candlesticks ·
Ch 5 Single Candlestick Patterns (Part 1) ·
Ch 6 Single Candlestick Patterns (Part 2) ·
Ch 7 Single Candlestick Patterns (Part 3) ·
Ch 8 Multiple Candlestick Patterns (Part 1) ·
Ch 9 Multiple Candlestick Patterns (Part 2) ·
Ch 10 Multiple Candlestick Patterns (Part 3) ·
Ch 11 Support & Resistance (trading checklist).
NSE closing mechanism (as of Aug 2026): ICICI Direct: Closing Auction Session step-by-step guide ·
All India Radio News (2 Aug 2026): NSE to introduce Closing Auction Session. Check against the latest NSE circulars at nseindia.com.
Background reading: Steve Nison, Japanese Candlestick Charting Techniques (1991).
Data: daily OHLCV for 37 NSE stocks and NIFTY 50, Oct 2016 – 30 Sep 2026 (NSE via Yahoo Finance; prices adjusted for splits and bonuses, so older prices may differ from what was quoted on the day). Figures and statistics: course/scripts/ch02_figures.py and course/scripts/ch02_patterns.py.
All examples are historical analysis for education, not recommendations to buy or sell any security. Trading, especially with leverage, can lose more than you expect.