
Support, Resistance, Trends & Chart Patterns
1. What you'll learn and why it matters
Chapter 2 taught you to read one candle and small groups of candles. This chapter steps back and looks at the shape of a chart over weeks and months. These are the tools almost every swing trader and position trader uses to answer four practical questions:
- Which way is the market going? (trend, Dow Theory, multi-timeframe analysis)
- Where are buyers and sellers likely to show up? (support, resistance, role reversal, Fibonacci, 52-week levels)
- Is a move real or a trap? (breakouts, volume confirmation, gaps)
- Where do I get in, where do I get out, and is it worth it? (chart patterns, measured-move targets, the reward-to-risk ratio and Varsity's checklist)
Swing trading (days to weeks): support and resistance give you your stop-loss and target, and chart patterns give you the setup. Positional and long-term investing: the weekly trend and the 52-week range tell you whether to add to a position now or wait for a better price. Fundamentals tell you what to buy; price structure helps with when. Futures: leverage makes every rupee of stop distance count. Futures traders lean heavily on clean support and resistance levels, because a vague stop gets very expensive when it is multiplied by a lot size (Chapter 9).
Every example below uses real NSE prices from 2025–2026, computed with Python from the course data set (data/ohlc, daily OHLCV to 30 Sep 2026). You will see the tools work, and you will also see them fail. The failures teach more. No pattern in this chapter is a guarantee. They are ways of organising probabilities and placing stops sensibly.
A note on the prices you will see. Old prices are adjusted for later splits and bonus issues, the way most charting platforms show them. For example, KOTAKBANK split its shares 1:5 in Jan 2026, so the "440" resistance in Section 4 actually traded at about ₹2,200 in 2025. Likewise HDFCBANK (1:1 bonus, Aug 2025), NESTLEIND (Aug 2025), BAJFINANCE (Jun 2025) and HDFCAMC (Nov 2025) are shown on their post-adjustment scale. Patterns and percentages are unaffected, but old news articles and contract notes will quote the unadjusted rupee figures.
Every chart here is historical analysis. Nothing in this chapter recommends buying or selling any security. Several setups that "worked" lost money for anyone who entered a few days later or without a stop. Always size positions so that a failed pattern costs you a small, pre-decided amount (Chapter 11).
2. Trends: higher highs, higher lows
The plain-language idea
Prices do not move in straight lines. They zig-zag. A trend describes the direction of the zig-zag:
- Uptrend: each rally peaks above the previous peak (higher high, HH) and each dip stops above the previous dip (higher low, HL).
- Downtrend: lower highs (LH) and lower lows (LL).
- Sideways (range): highs and lows keep repeating at roughly the same levels.
The logic: why trends persist
Varsity lists "prices move in trends" as one of the core assumptions of technical analysis. The reasons are behavioural. Big investors (mutual funds, insurers, foreign institutional investors or FIIs) cannot build or sell a position in a day. They accumulate over weeks, and that keeps buying pressure on a stock. News also spreads gradually: analysts revise estimates one after another, and late investors chase what has already worked. A higher low means buyers stepped in earlier than last time, so they are getting more eager. A lower high means sellers are getting more eager. Structure is a direct record of who is gaining control.
How to identify swings objectively
The hard part is deciding which wiggles count. Two common methods:
- Window method: a swing high is a bar whose high is the highest of the k bars on either side (e.g. k = 5 for short swings, 10–20 for bigger ones).
- Percentage (zig-zag) method: a swing is only confirmed after price reverses by at least x% from the extreme (we use 6–8% for stocks and 3–4% for the Nifty in this chapter).
- \(x\)
- The reversal size you choose, as a decimal (8% = 0.08).
- \(\text{Peak}\)
- The highest high since the last confirmed swing low, in ₹. It is the candidate swing high.
- \(\text{Trough}\)
- The lowest low since the last confirmed swing high, in ₹. It is the candidate swing low.
- \(\text{Low}_t, \text{High}_t\)
- The low and high on day \(t\), the session you are checking.
- While price is rising, keep updating the highest high so far. That is the Peak.
- Each day, check whether the day's low has fallen at least \(x\) below the Peak. If it has, the Peak becomes a confirmed swing high, and you start tracking the Trough instead.
- Swing lows work the same way upside down: confirmed once a day's high rises at least \(x\) above the Trough.
- A swing is known only after price has reversed by \(x\), so the most recent swing is always unconfirmed.
Example (TITAN, \(x\) = 8%): the high of 3,726.5 on 1 Jul 2025 needed a low at or below \(3726.5 \times 0.92 = 3428.4\). The low on 8 Jul was 3,435.0, not quite enough. On 9 Jul the low was 3,420.6, so 3,726.5 became a confirmed swing high that day, six sessions after it was made.
With a 1% tolerance, two highs or lows within 1% of each other count as "equal" (EH or EL). Equal levels are the raw material of double tops, double bottoms and support or resistance.
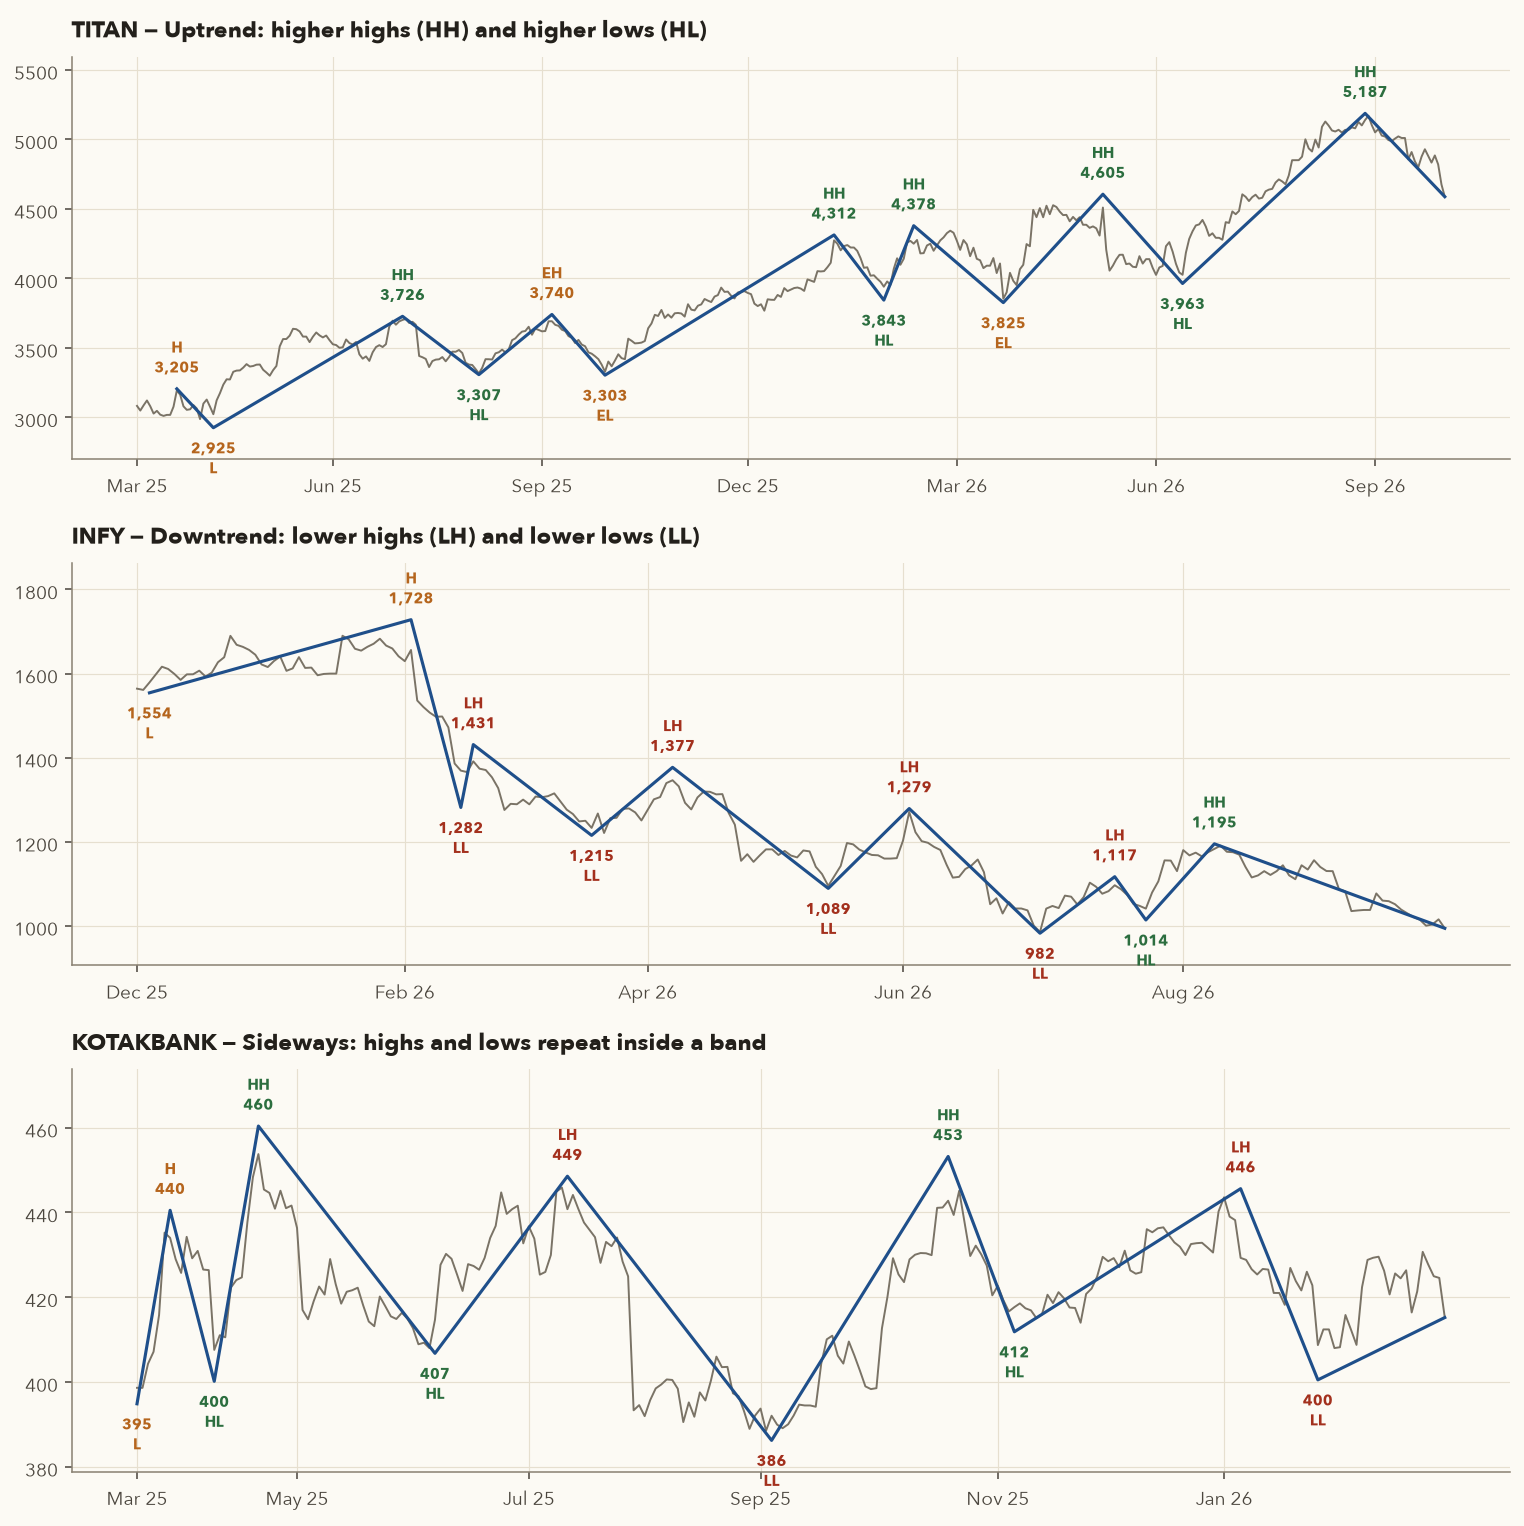
Reading the uptrend swing by swing
- Swing low 2,925 (7 Apr 2025) → swing high 3,726.5 (1 Jul 2025). First leg up.
- Dip to 3,307 (1 Aug 2025): above 2,925, so it is a higher low.
- Rally to 3,740 (4 Sep 2025): only 0.4% above 3,726.5, so it is effectively an equal high. Momentum is stalling.
- Dip to 3,303.1 (26 Sep 2025): equal to the 3,307 low. Buyers defend the same price twice, which forms a support zone at ~3,300.
- Breakout to 4,312.1 (7 Jan 2026), then 4,378.4 (11 Feb), 4,605 (8 May) and 5,186.7 (27 Aug 2026): a sequence of higher highs, with higher lows at 3,843.1 (29 Jan), 3,825 (23 Mar, equal) and 3,962.8 (11 Jun).
- Conclusion: from Jan 2026 the primary structure was up. At each point it stayed up until a close below the most recent higher low (3,843.1 in Feb–May, then 3,962.8 from mid-June). The 30 Sep 2026 close of 4,587 is a pullback inside that structure, not yet a reversal.
Trade in the direction of the structure. In an uptrend, look to buy dips near higher lows, not to short rallies. The trend stays valid until price closes below the last higher low (for an uptrend) or above the last lower high (for a downtrend). That level is also a natural place for a stop.
- Changing the swing size to suit your opinion. Choose k or x% before you look, and keep it the same.
- Treating one opposite swing as a reversal. In the INFY panel, one higher low and one higher high (Jul–Aug 2026) did not end the downtrend. A reversal needs a sequence: a higher low and a higher high, and then a hold above that higher low.
- Ignoring the timeframe. A daily downtrend can be a pullback inside a weekly uptrend (Section 13).
3. Trendlines and channels
What they are
A rising trendline joins two or more higher lows. A falling trendline joins two or more lower highs. A line parallel to the trendline through the opposite extreme forms a channel. Varsity points out that horizontal support and resistance cannot be drawn when a stock trades at all-time highs or keeps making new highs. In that situation a sloping trendline plays the support role.
The logic
In a steady uptrend, buyers are willing to pay a little more each week. The trendline is a picture of that rising "willingness to pay". When price falls back to the line, it is reaching the price at which buyers have recently stepped in. A close below the line says buyers are no longer paying up at the usual pace. That does not prove a reversal, but the trend has lost momentum.
The calculation
- \(x\)
- A trading-session number: count sessions 1, 2, 3 … (weekends and holidays are not counted).
- \(x_1, P_1\)
- The session number and price of the first swing low (anchor 1), in ₹.
- \(x_2, P_2\)
- The session number and price of the second swing low (anchor 2), in ₹.
- \(m\)
- The slope: how many ₹ the line rises per session (negative for a falling line).
- \(\text{Line}(x)\)
- The trendline's price on session \(x\), in ₹.
- \(\text{High}_x\)
- The high on session \(x\), in ₹.
- \(x_n\)
- The last session you look at (today, or the end of the period you are studying).
- \(W\)
- The channel width, in ₹: the biggest distance between a high and the trendline from anchor 1 to \(x_n\). "max" means "the largest of".
- \(\text{Channel line}(x)\)
- The upper boundary, parallel to the trendline and \(W\) above it.
- Slope: the price rise between the two lows divided by the number of sessions between them.
- Line value on any session: start at \(P_1\) and add \(m\) for every session after \(x_1\). A close below this value is a break of the line.
- For each session from \(x_1\) to \(x_n\), measure how far the high sits above the line. The largest gap is \(W\).
- Add \(W\) to the line to draw the upper channel line.
Drawing and validating a rising trendline
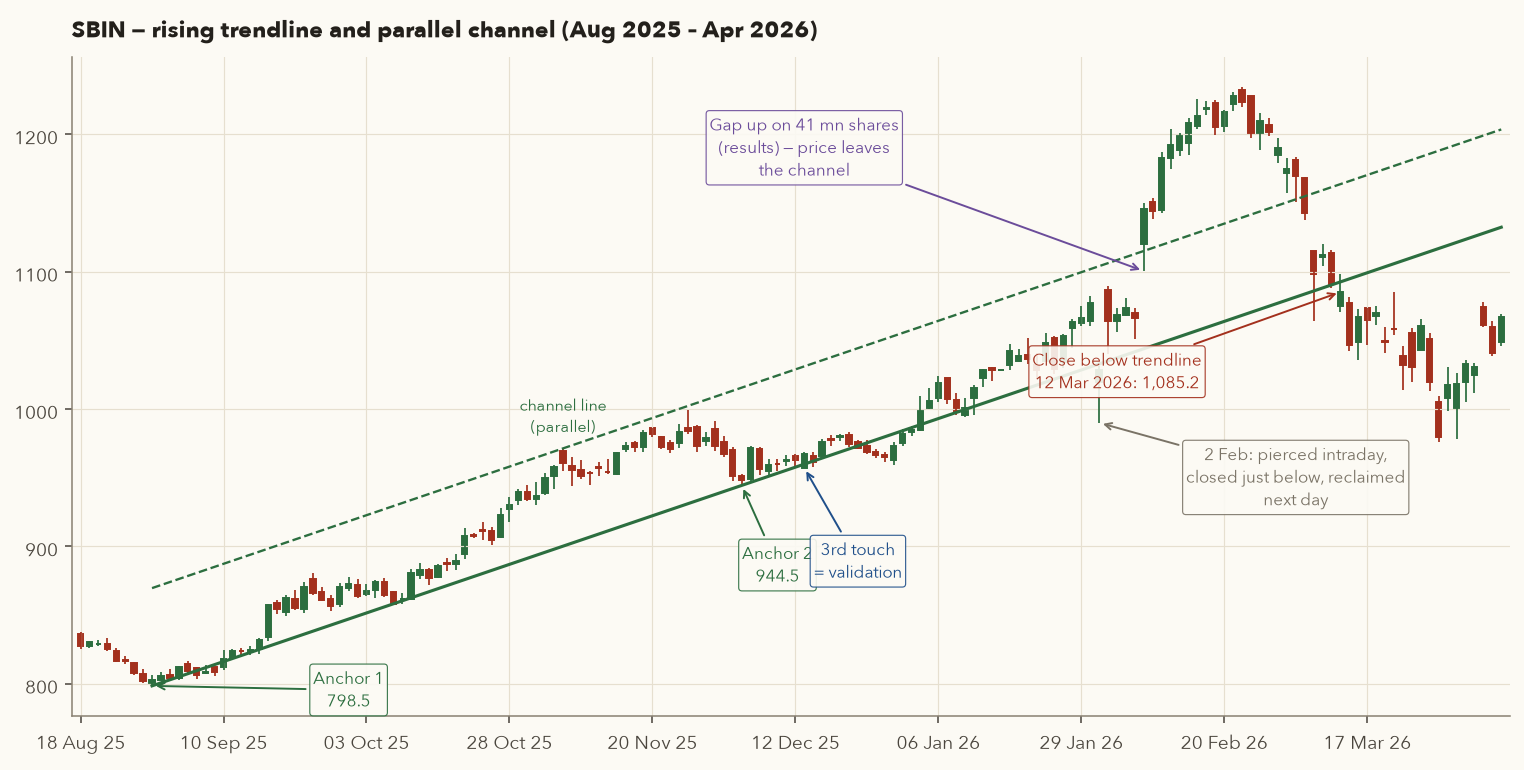
- Anchor 1: swing low 798.5 on 29 Aug 2025. Anchor 2: swing low 944.45 on 4 Dec 2025, 66 sessions later.
- Slope \( m = (944.45 - 798.5)/66 = 145.95/66 = 2.21 \) rupees per session. The line rises about ₹2.21 every trading day.
- Projected value 7 sessions after anchor 2 (15 Dec 2025): \( 944.45 + 2.21 \times 7 = 959.93 \). The actual low that day was 957.25, only 0.28% below the line. That is a third touch, which validates the line. Two points always make a line; the third touch shows the market respects it.
- Channel: the largest distance from the line to a high (before Feb 2026) was 71.18 (6 Nov 2025 high 971.4). Adding 71.18 to the line gives the upper channel boundary.
- A wobble: on 2 Feb 2026 (a market-wide sell-off day) SBIN fell to 990 and closed at 1,028.7, 0.41% below the line value of 1,032.9. The next day it closed at 1,064.2, back above. Treat a line as a zone, not a laser.
- Leaving the channel: on 9 Feb 2026 SBIN gapped up (prior high 1,073.6, open 1,120, close 1,146) on 3.51× its 10-day average volume. It ran to 1,234.7 by 24 Feb.
- The break: on 12 Mar 2026 SBIN closed at 1,085.2, below the line value of 1,092.6. That close ended the trendline that had held for six months.
- Use wicks or bodies consistently. This chapter uses lows for rising lines and highs for falling lines.
- A line becomes more significant with more touches, longer duration and a gentler slope. Very steep lines (like SBIN after the Feb gap) break quickly.
- Judge a break on closes, ideally by a margin of about 1% or two consecutive closes. Intraday pokes, like 2 Feb above, often reverse.
- On long charts (several years), use a log scale so that equal percentage moves look equal.
4. Support and resistance
Definitions
Support is a price zone below the current price where buying has repeatedly stopped declines. Resistance is a zone above the current price where selling has repeatedly stopped rallies. Varsity defines them relative to the current market price: the same horizontal line is resistance if price is below it and support if price is above it.
Why S&R works: three forces
- Memory and regret. Investors who bought near a top and watched the price fall often sell when the price comes back to their purchase price ("let me just get my money back"). That supply caps rallies at old highs. People who missed buying at a low often place orders there if the price returns, which creates demand at old lows.
- Supply and demand of large players. A fund that wants to accumulate 1 crore shares below ₹400 will absorb every dip to ₹400 for weeks. The chart sees a floor at 400. That is Dow's "accumulation" (Section 8).
- Round numbers and self-fulfilment. Levels such as Nifty 22,000, 25,000 and 26,000, or a stock at ₹1,000, attract large option positions (open interest, Chapter 10), stop orders and media attention. Because many traders watch the same level, orders cluster there and the level "works" partly because people expect it to.
Varsity's summary: support and resistance show where a reversal is possible, not certain. History tends to repeat, but it is not obliged to.
Varsity's 4-step construction method
- Load enough history. Varsity suggests 3–6 months for very short-term trades and 12–18 months for swing trades. Older levels are less relevant.
- Find price-action zones. Mark at least three places where price either hesitated (stalled after a move up or down) or reversed sharply (a V-shaped turn).
- Align them. The zones must sit at about the same price, and they should be well spaced in time. Varsity's example puts the second zone at least a couple of weeks after the first, and says the further apart the zones, the stronger the level. This chapter uses a stricter rule of about 4 weeks (20 sessions). Three touches over six months mean much more than three touches in one week.
- Draw the line and widen it into a zone. Fit a horizontal line through the zones. If it is above the current price it is resistance; if below, it is support. Then allow a small margin either side. S&R is a band, not a single price.
- \(P_i\)
- The touches: swing highs (for resistance) or swing lows (for support) where price turned at about the same level, in ₹ or points. \(i\) numbers them 1, 2, 3 …
- \(\pm 1.5\%\)
- How close the touches must be: roughly within 1.5% either side of a middle price, so the group spans at most about 3%.
- Zone
- The band from the lowest touch to the highest. \([a,\ b]\) means "from \(a\) to \(b\)".
- \(\#\text{touches}\)
- The number of touches in the group (# = "number of").
- gap between touches
- Trading sessions from one touch to the next. 20 sessions is about 4 weeks.
- List the swing highs (or swing lows) in your look-back period.
- Group the ones that sit within about ±1.5% of each other.
- The zone runs from the lowest to the highest price in the group.
- Count it as a real level only if there are at least 3 touches, each at least 20 sessions after the one before. Touches closer together than that count as one.
Applying the 4 steps to the index (18-month look-back)
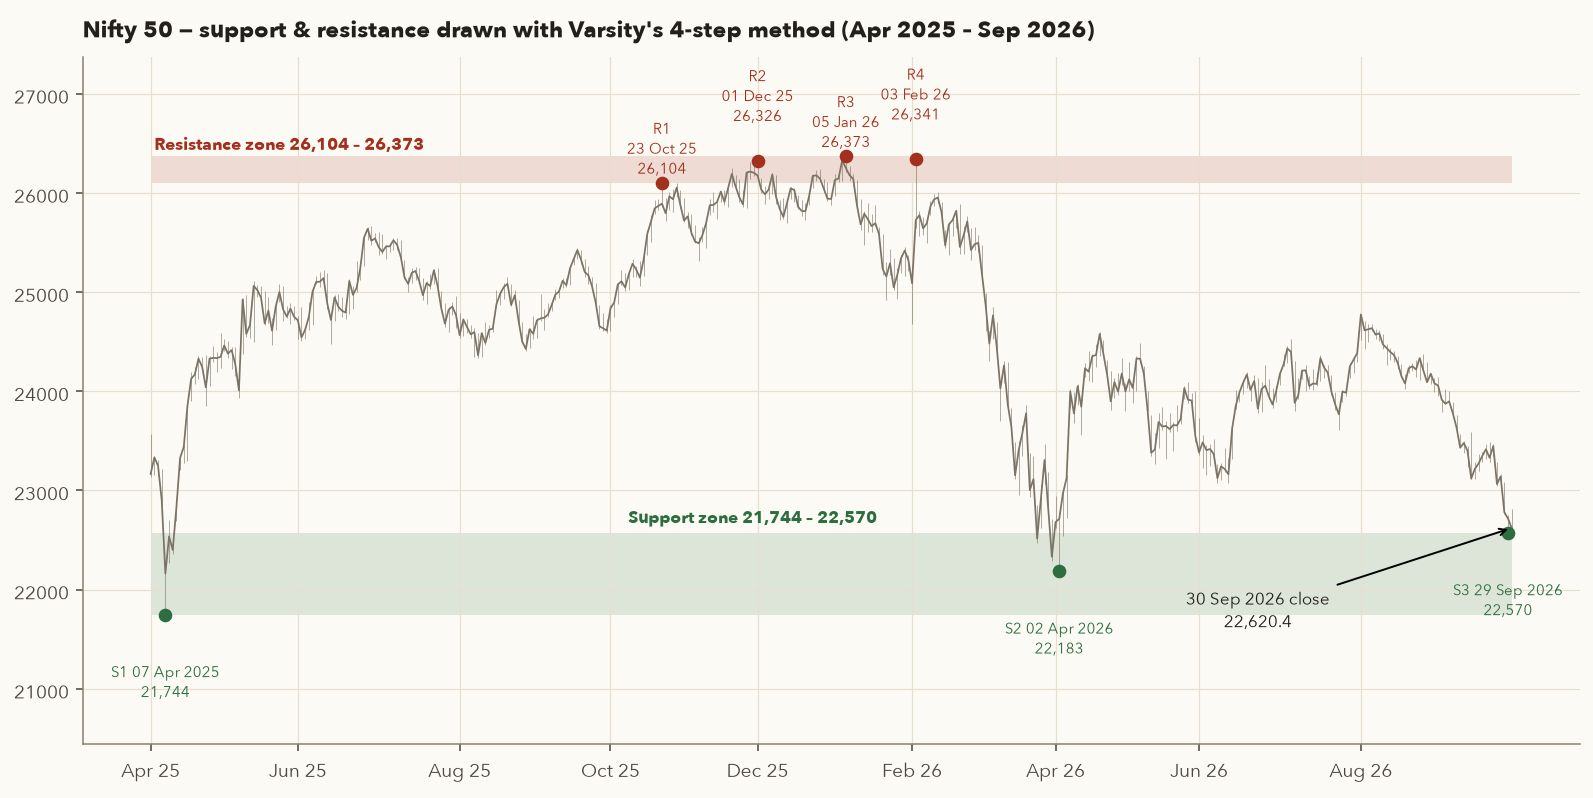
- Resistance touches (3% zig-zag swing highs above 26,000): 26,104.2 (23 Oct 2025), 26,325.8 (1 Dec 2025), 26,373.2 (5 Jan 2026), 26,341.2 (3 Feb 2026). They are 26, 24 and 19 sessions apart. The last gap is one session short of the 20-session rule, but the first three touches pass it on their own.
- Resistance zone: 26,104 – 26,373, about 1% wide, comfortably inside the ±1.5% test. Every attempt to go above it in four months failed. Each failure is a group of sellers saying "enough".
- Support touches (3% zig-zag swing lows below 22,600; where two lows fall within 20 sessions of each other, only the lower one is kept): 21,743.65 (7 Apr 2025), 22,182.55 (2 Apr 2026) and 22,569.65 (29 Sep 2026).
- Support zone: 21,744 – 22,570. Be honest about this one: it fails the rule above. The three lows span 3.8%, more than the ±1.5% test allows. Only the last two (22,183 and 22,570, 1.7% apart) group together, and two touches are not enough. So this is a candidate zone drawn by judgement, a band of old lows that the index keeps reacting near, not a confirmed level. Its third touch was also still in progress at the data cut-off. Treat it as much weaker evidence than the resistance zone.
- Where are we? The 30 Sep 2026 close of 22,620.45 was just 0.23% above the top of the support zone. Purely on structure, this is a "decision zone": either buyers defend it a third time, or a close below ~21,744 would mark a fresh breakdown. Structure alone does not tell you which. That is why you wait for confirmation (Sections 6–7) instead of predicting.
A year-long range and what happened when support gave way
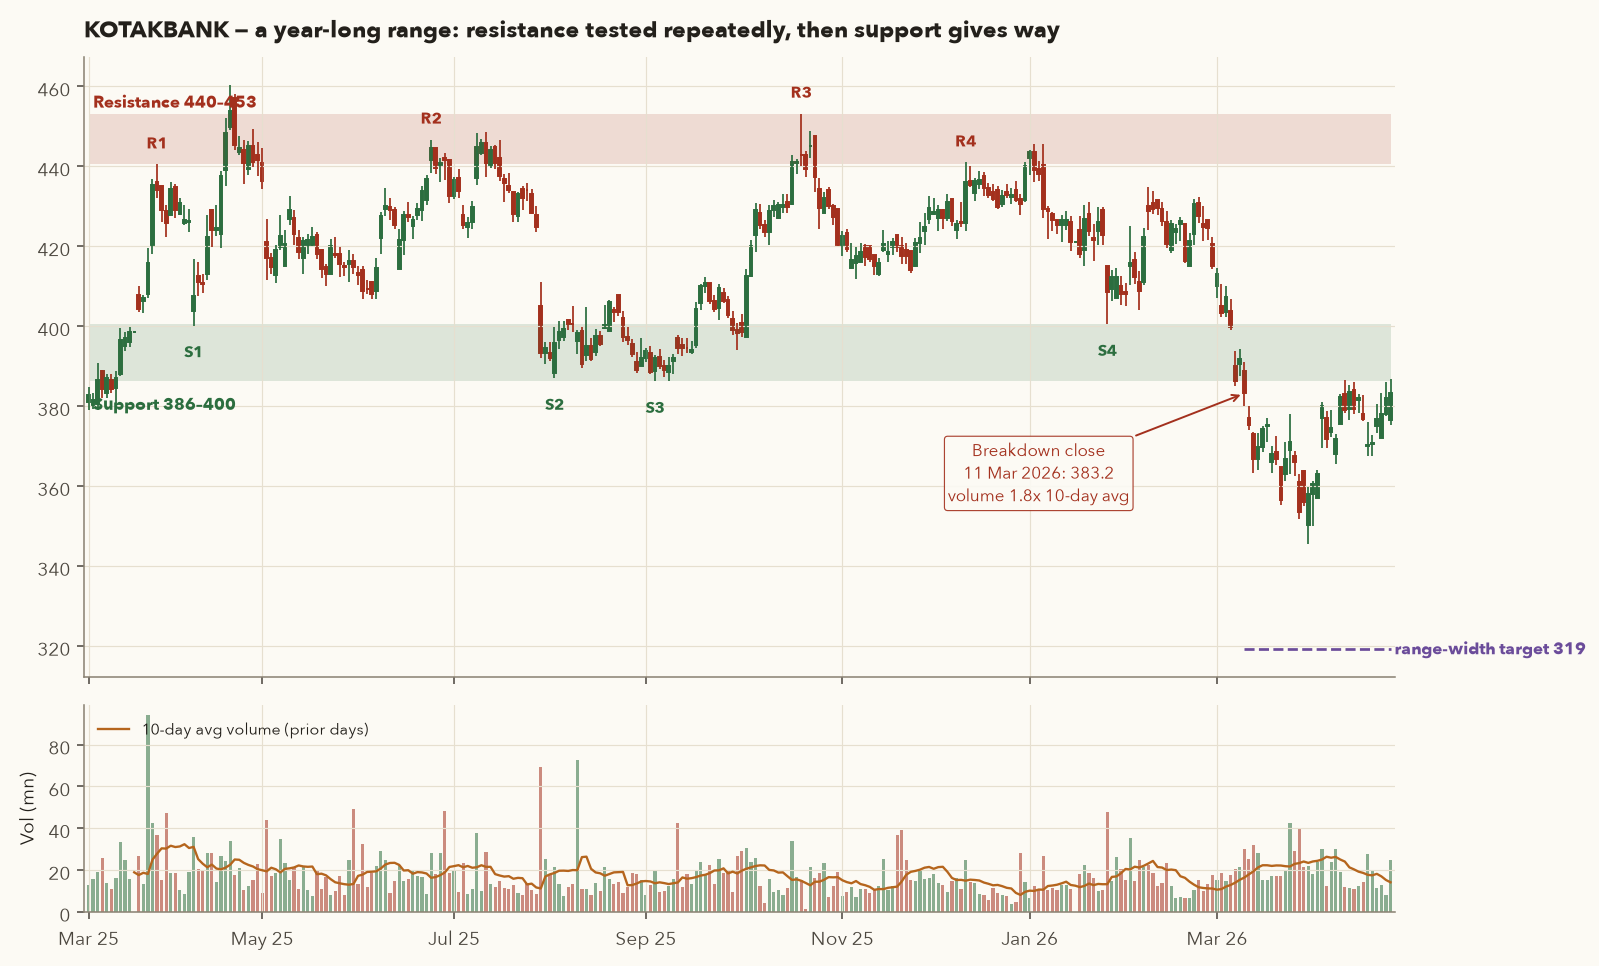
- Swing highs within ±1.5% and ≥20 sessions apart: 440.5 (25 Mar 2025), 446.72 (24 Jun 2025), 453.2 (20 Oct 2025), 441.0 (11 Dec 2025) → resistance 440.5 – 453.2. The 22 Apr 2025 spike to 460.4 was a brief poke above the zone that did not last.
- Swing lows: 400.16 (7 Apr 2025), 387.0 (31 Jul), 386.22 (3 Sep), 400.5 (27 Jan 2026) → support 386.22 – 400.5.
- Breakdown: on 11 Mar 2026 KOTAKBANK closed at 383.2, below the bottom of the support zone, on 1.83× its 10-day average volume.
- Range-width target (Varsity's rule for range breakouts, Section 6): width \( = 453.2 - 386.22 = 66.98 \), so target \( = 386.22 - 66.98 = 319.24 \).
- Outcome: the stock fell to 345.5 on 2 Apr 2026 (−9.8% from the breakdown close) but did not reach 319. Measured targets are rough guides, not promises. By 30 Sep 2026 it had recovered to 417.
Using S&R in a trade (Varsity's approach)
- Long trade: enter near support after a bullish signal. Put the stop just below the support zone (or the pattern low, if that is lower). Put the target just below the next resistance.
- Short trade: the mirror image. Enter near resistance, stop just above it, target just above the next support. Reminder from Chapter 2: in India you cannot carry a short in the cash market overnight, so a swing short needs stock futures or options (Chapters 9–10). Until then, read every "short" setup in this chapter as a signal to exit or avoid a long.
- Varsity's final checklist adds a sanity test: the pattern's stop and the nearest S&R level should be close to each other, within about 4%. If the nearest support is far below your logical stop, the setup has no structural anchor, and Varsity suggests dropping it.
- At all-time highs there is no overhead resistance to draw. Use trendlines, measured moves or trailing stops instead.
- The more obvious a level, the more stops sit just beyond it. Big players sometimes push price through a level to trigger those stops before reversing. That is one reason to place stops a little beyond the zone, not exactly at it.
- Old levels fade. A level from 3 years ago with no recent touches is weak.
In your framework: framework.indicators.pivots(df) returns swing highs and lows, and framework.patterns.support_resistance(df) clusters them into zones using the same touch-count and spacing rules as above.
5. Role reversal: old ceilings become floors
When resistance is decisively broken, it often turns into support, and broken support often turns into resistance. Varsity calls this role reversal.
The logic: imagine a stock repeatedly fails at ₹2,480. Sellers there were happy to exit. When it finally breaks above ₹2,480 and runs, people who sold at 2,480 regret it and want back in "at the price I sold". People who missed the breakout want to buy the first dip. Both groups put buy orders around 2,480, so the old ceiling becomes a floor. On the downside, people who bought at a support that later broke want to sell at break-even when price returns to it, so old support becomes resistance.
Resistance → support (with a shake-out)
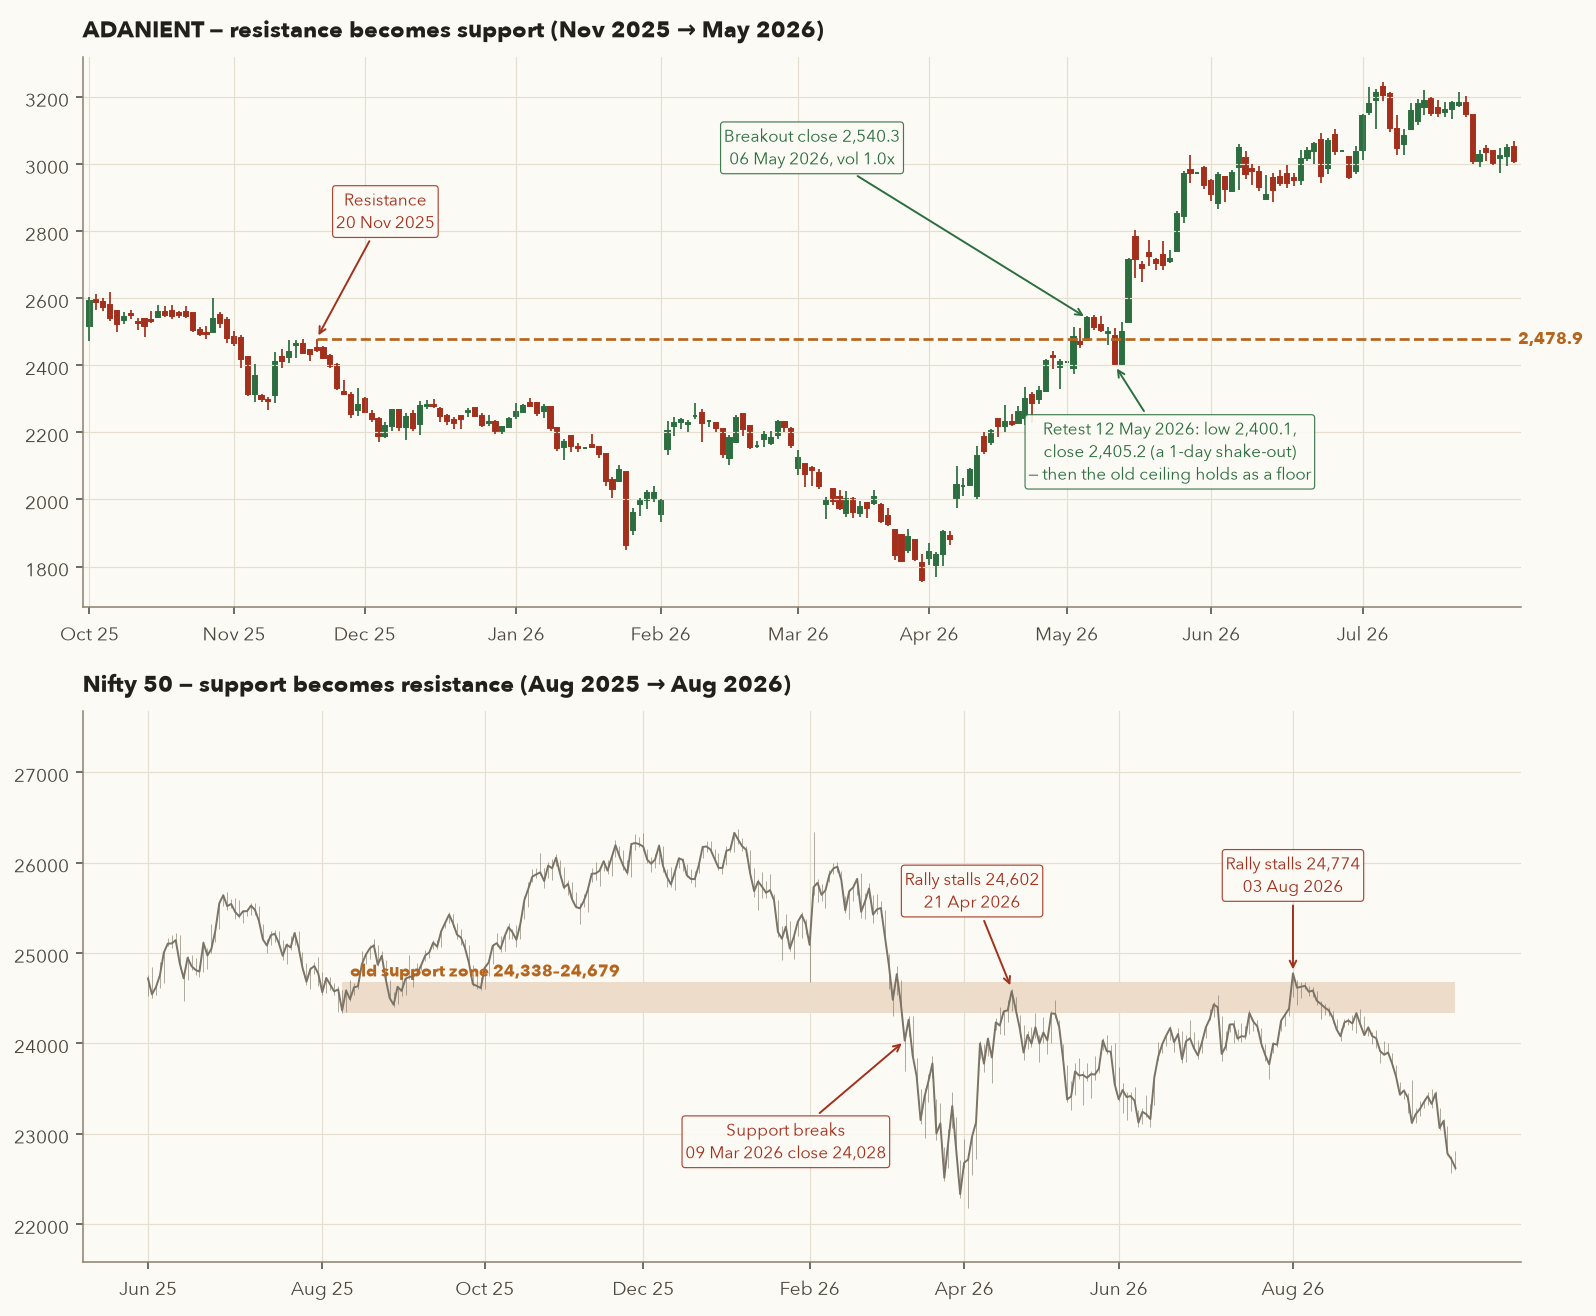
- Resistance: the 20 Nov 2025 swing high of 2,478.9 capped the stock, and it fell to ~1,750 by Mar 2026.
- Breakout: on 6 May 2026 ADANIENT closed at 2,540.3 (2.5% above the level), but on only 1.04× average volume, which is a lukewarm signal.
- Retest: on 12 May 2026 it dropped to 2,400.1 and closed at 2,405.2, 3% below the old level. A trader with a tight stop at 2,470 would have been stopped out.
- Reclaim: the next day it closed at 2,498.0, back above the level. On 14 May it closed at 2,712.9 on 4.39× volume. It went on to 3,245 by 6 Jul 2026.
- Lesson: role reversal is real but noisy. Give the zone room: put stops below the retest swing low, not exactly at the level, and size the position so that the wider stop still risks only your planned amount.
Support → resistance (twice)
- Support zone: the 8 Aug 2025 swing low of 24,337.5 and the 2 Feb 2026 low of 24,679.4 → zone 24,338 – 24,679.
- On 9 Mar 2026 the Nifty closed at 24,028, below the zone. Old support is now potential resistance.
- The April rebound stalled at 24,601.7 (21 Apr 2026), inside the zone. The July–August rebound stalled at 24,774.3 (3 Aug 2026), just above it.
- After the August failure the index slid to 22,620 by 30 Sep 2026. The August high (24,774) also sat almost exactly on the 61.8% Fibonacci retracement of the Jan–Apr fall (24,772; Section 11), just above the top of the zone. When two independent tools point to roughly the same price, it is called confluence.
6. Breakouts and false breakouts
A breakout is a close beyond a well-established resistance (upside) or support (downside). Varsity notes that ranges form when there is no strong trigger, such as quiet results or waiting for an announcement. They end when something changes the balance of buyers and sellers.
What separates a real breakout from a trap
Varsity's two key tests are volume (well above average, which shows institutional participation) and momentum (price keeps moving away from the level over the next 3–4 sessions instead of drifting back). Additional filters that many traders use:
- Close, not intraday: the breakout bar must close beyond the level.
- Margin: the close is beyond the level by at least about 1% (or a fraction of ATR, Chapter 4), not 0.1%.
- Context: breakouts in the direction of the higher-timeframe trend succeed more often.
- Room: there should be space to the next resistance, at least 1.5× your risk (Varsity's minimum RRR).
- Resistance
- The top of the range (its highest high), in ₹. For an upward breakout this is also the breakout level.
- Support
- The bottom of the range (its lowest low), in ₹.
- Resistance − Support
- The range width (its height), in ₹.
- \(\text{Target}_{\uparrow}\)
- The price target for an upward breakout (\(\uparrow\) = up), in ₹.
- Stop
- The stop-loss, placed just under the old resistance, in ₹.
How it works: measure the height of the range and add it on top of the breakout level. For a downward breakout, subtract the height from support and put the stop just above it. Then check the reward-to-risk: target minus entry should be at least 1.5 times entry minus stop.
A breakout that passed every test
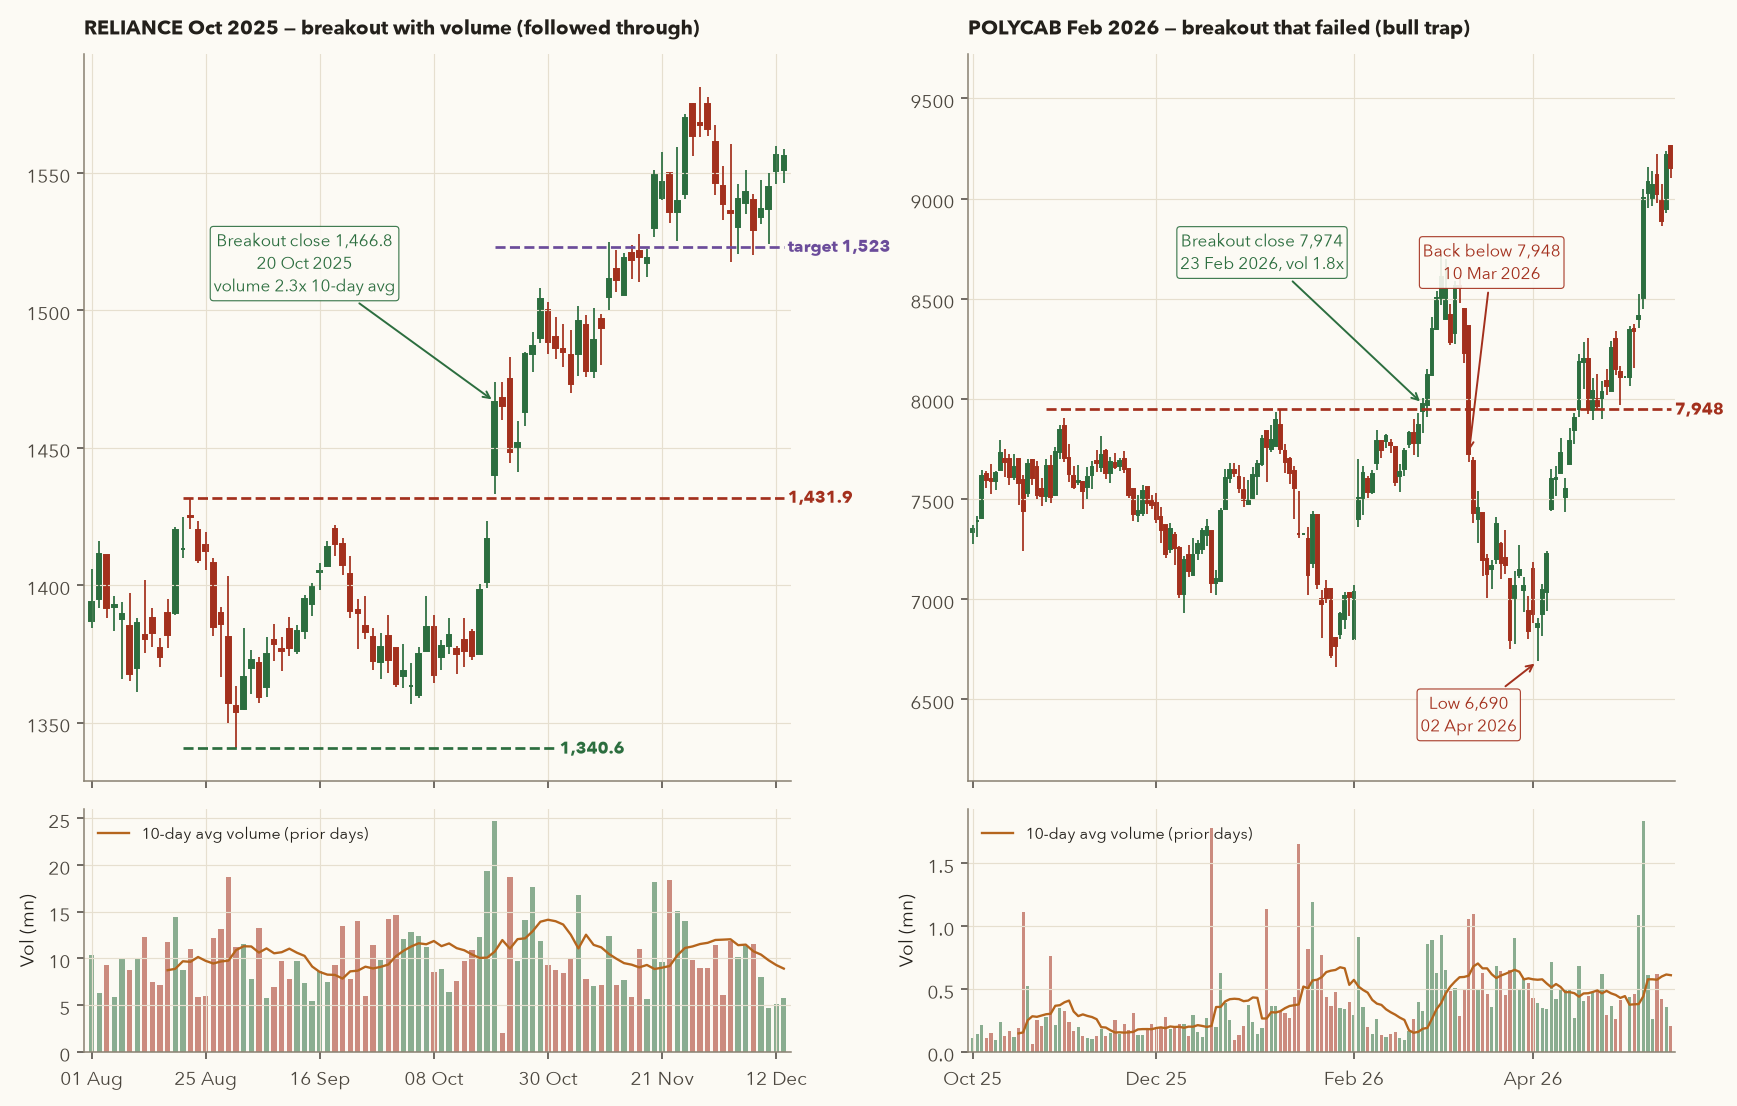
- Range 20 Aug – 15 Oct 2025: low 1,340.6, high 1,431.9, width 91.3.
- Breakout: 20 Oct 2025 close 1,466.8, which is 2.4% above 1,431.9. Volume was 24.72 mn shares against a prior 10-day average of 10.73 mn, so \( 24.72/10.73 = 2.3\times \).
- Follow-through: the next three closes were 1,465.2, 1,448.4 and 1,451.6. All stayed above 1,431.9, which passes the 3–4 day momentum test.
- Target \( = 1{,}431.9 + 91.3 = 1{,}523.2 \), reached on 12 Nov 2025 (15 sessions later).
- Trade plan check: entry 1,466.8, stop just below the range top at ~1,425 → risk ≈ 41.8; reward ≈ 56.4 → RRR ≈ 1.35. That is below Varsity's 1.5 minimum. An honest, rule-following trader would have skipped or reduced this good-looking breakout. Rules sometimes cost you a winner. That is acceptable.
A breakout that failed: a bull trap
- Resistance: double top at 7,903 (31 Oct 2025) and 7,948 (8 Jan 2026).
- Breakout: 23 Feb 2026 close 7,974, only 0.33% above 7,948, on a respectable 1.79× volume. It ran to 8,722 by 27 Feb.
- Failure: by 10 Mar 2026 it closed back below the level at 7,723. It then fell to 6,690.5 on 2 Apr 2026, 16% below the breakout close.
- Twist: POLYCAB later made a new high of 10,126 on 22 Jun 2026. Both the "failure" and the eventual success were real, on different timeframes.
- Lesson: a thin margin above the level was a warning sign. A stop just below 7,948 (or the 7,684 retest low) limited the damage to a few percent, while the stock fell 16%.
Varsity insists on this: even with good volume, momentum is not guaranteed. A failed breakout often falls fast, because the traders who bought it all have stops in the same place. Decide your exit before you enter.
In your framework: framework.strategies.breakout_52w(df) and framework.strategies.donchian_trend(df) are rule-based breakout systems; Chapter 12 backtests them honestly with costs.
7. Volume: does the crowd agree?
What volume is
Volume is the number of shares that changed hands in a period. Every trade has a buyer and a seller, so 100 shares traded counts as volume 100, not 200. A price move on heavy volume means many participants, and probably large institutions ("smart money"), agreed with the move. A move on thin volume may just reflect a lack of sellers or buyers that day.
Varsity's volume-price table
| Price | Volume (vs 10-day average) | Varsity's reading |
|---|---|---|
| Up | Higher | Bullish: smart money is buying |
| Up | Lower | Caution: the rally may be weak (possible bull trap) |
| Down | Higher | Bearish: smart money is selling |
| Down | Lower | Caution: the fall may be weak (possible bear trap) |
- \(V_t\)
- The volume (number of shares traded) on day \(t\), the day you are checking.
- \(V_{t-i}\)
- The volume \(i\) sessions earlier. With \(i\) running from 1 to 10, these are the 10 sessions before day \(t\); day \(t\) itself is left out.
- \(\tfrac{1}{10}\sum_{i=1}^{10}\)
- Add up those 10 volumes (\(\Sigma\) means "sum") and divide by 10: their average.
- \(\text{Volume ratio}_t\)
- Day \(t\)'s volume as a multiple of a normal day's.
How it works: divide today's volume by the average of the previous 10 sessions. Above 1 is higher-than-normal volume and below 1 is lower. Read it as "times normal": 4.11 means about four times an ordinary day's volume.
Was the breakdown day "high volume"?
- Volume on 29 Oct 2025: 4,400,454 shares.
- Average of the previous 10 sessions (14–28 Oct): 1,071,905 shares.
- Ratio \( = 4{,}400{,}454 / 1{,}071{,}905 = 4.11 \). Volume was more than four times normal.
- Price fell from 2,823.25 to 2,699.0 (−4.4%) and closed below its neckline (Section 9). Price down on high volume reads as bearish in the table, and it confirmed the pattern.
Quiet range, loud breakdown
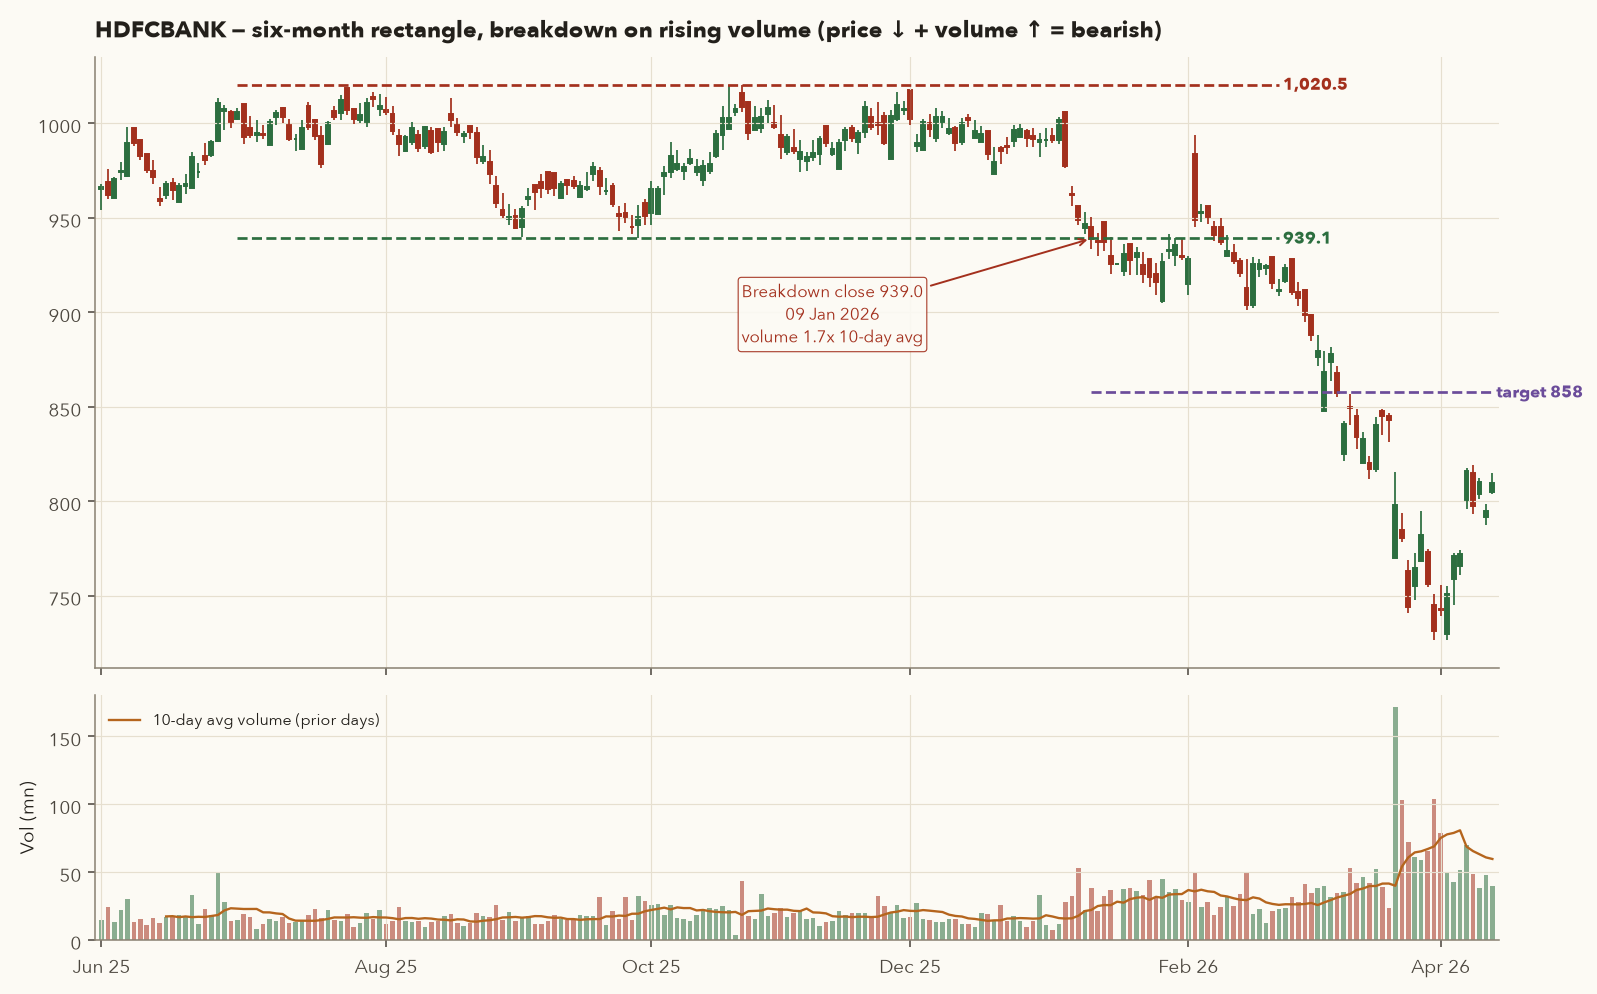
- For six months HDFCBANK traded in a rectangle between 939.1 and 1,020.5 (width 81.4). Average daily volume was 17.57 mn shares.
- On 9 Jan 2026 it closed at 939.0, a hair below the floor, on 1.73× average volume. (A 0.01% break is not decisive on its own; the first close more than 1% below the floor came on 14 Jan at 925.45.) The breakdown leg then averaged 40.34 mn shares a day (9 Jan – 31 Mar 2026), 2.3 times the range average.
- Range target \( 939.1 - 81.4 = 857.7 \), reached on 4 Mar 2026. The stock kept falling to 726.65 (30 Mar 2026).
- The volume expansion showed that sellers were not a handful of retail traders. This was distribution by large holders.
Honest check: is the table a trading signal by itself?
We tested the table on every trading day for 35 large-cap stocks in the course data (Jan 2016 – Sep 2026, 81,524 stock-days), measuring the dividend-adjusted return over the next 10 sessions:
| Day type | Days | Avg next-10-day return | % of times positive |
|---|---|---|---|
| Price up, volume above 10-day avg | 17,340 | 0.93% | 55.6% |
| Price up, volume below 10-day avg | 24,260 | 0.88% | 55.1% |
| Price down, volume above 10-day avg | 13,783 | 0.72% | 54.9% |
| Price down, volume below 10-day avg | 26,141 | 0.85% | 54.6% |
| All days | 81,524 | 0.85% | 55.0% |
| Big up day (>3%) on >1.5× volume | 2,409 | 1.15% | 54.4% |
| Big up day (>3%) on ≤1.5× volume | 1,868 | 1.99% | 59.8% |
| Big down day (>3%) on >1.5× volume | 1,241 | 0.32% | 52.4% |
| Big down day (>3%) on ≤1.5× volume | 1,927 | 1.94% | 61.2% |
What this tells us. On ordinary days the four rows are almost identical, so the table is not a stand-alone daily signal. The useful part is in the big-move rows: heavy-volume down days were followed by much weaker returns (0.32%) than light-volume down days (1.94%). That matches Varsity's "price down + volume up = bearish". Volume matters most at decision points: breakouts, breakdowns and pattern completions. Use it as confirmation there, not as a signal on every candle. (The sample is today's large caps, which carries survivorship bias, so treat the absolute returns with caution.)
8. Dow Theory
Charles Dow (co-founder of the Wall Street Journal) wrote about market behaviour around 1900. His ideas, organised by later writers, are the foundation of most of this chapter. Varsity summarises them as the following tenets, rephrased here in eight points.
The tenets
- The market discounts everything. Known information, and the crowd's expectations about what is still unknown, is reflected in price quickly.
- There are three kinds of trend running at once:
- Primary trend: the main direction, lasting from about a year to several years.
- Secondary trend: a correction against the primary trend, lasting weeks to months (a pullback in a bull market, a rally in a bear market).
- Minor trends: day-to-day noise, lasting days to a few weeks.
- The primary trend moves in phases. Accumulation, markup (public participation) and distribution, followed by markdown. These are described below.
- Indices must confirm each other. A trend is more trustworthy when related indices move together. Dow used the industrial and transport averages; in India you might compare the Nifty 50 with Nifty Bank or the broader indices.
- Volume must confirm the trend. In an uptrend, volume should expand on rallies and shrink on dips.
- A sideways range can replace a secondary trend. Instead of a pullback, the market can simply go flat for a while.
- The closing price matters most. Intraday spikes can be noise; the close is the price the market agreed on at the end of the day.
- A trend stays in force until it gives a clear signal that it has reversed. In practice that signal is the swing rule from Section 2: an uptrend is intact until price closes below the last higher low. Until then, assume continuation rather than trying to call the top.
Closing prices are now set more carefully than before. From 3 Aug 2026, NSE introduced a Closing Auction Session (CAS) for stocks that have F&O contracts. Continuous trading in these stocks stops at 3:15 pm, orders are collected roughly 3:20–3:30 pm, and the official close is the single auction price that matches the most volume, determined around 3:30–3:35 pm. Index and stock F&O now trade until 3:40 pm. Separately, from 7 Sep 2026 NSE revised its morning pre-open session (9:00–9:15 am): market and limit orders until 9:05, limit orders only from 9:05 to 9:10, and matching and opening-price discovery from 9:10 to 9:12. Gaps (Section 10) are created in this session. (Sources: Zerodha Z-Connect and Kotak Neo summaries of the NSE changes, Aug–Sep 2026; check NSE circulars for the latest.)
The market cycle: four phases
- Accumulation: after a long decline, informed investors quietly buy. Price goes sideways at low levels, and support forms.
- Markup: the floor holds, the news improves, trend followers join and the price rises quickly.
- Distribution: at high prices and peak optimism, informed investors sell to latecomers. Price stalls, and repeated failures create resistance.
- Markdown: supply overwhelms demand and the price falls, often fast. Eventually it reaches levels where accumulation starts again.
One full cycle in 14 months
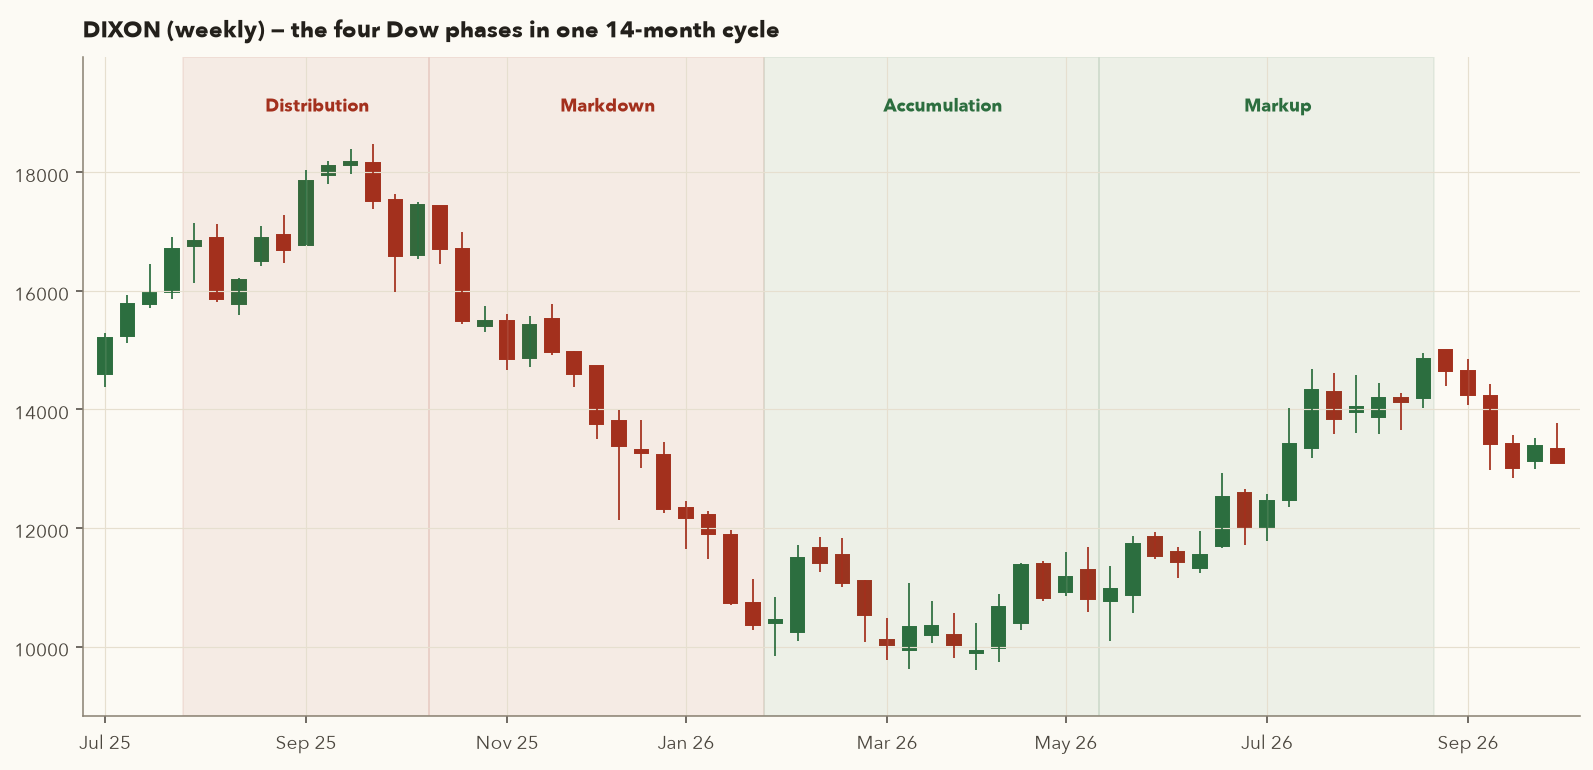
- Distribution (Aug–mid-Oct 2025): repeated tops between ~16,500 and 18,471 (peak 25 Sep 2025), with wide swings and no progress.
- Markdown (Oct 2025–Jan 2026): a staircase of lower highs to below 10,000. From the 18,471 peak to the 9,600 low (30 Mar 2026) is a fall of 48.0%.
- Accumulation (Feb–May 2026): three lows at 9,835, 9,630 and 9,600 (a triple bottom, Section 9). Price stayed in a 9,600–11,850 band for months.
- Markup (mid-May–Aug 2026): the neckline broke on 15 Jun 2026 and price reached 15,000 on 24 Aug 2026. It closed Sep 2026 at 13,100.
- Caveat: these labels are drawn in hindsight. In real time, accumulation looks exactly like "a stock that keeps falling and then goes nowhere". That is why you wait for the structure (higher low plus a neckline break) rather than guessing the phase.
Index confirmation and the closing-price tenet
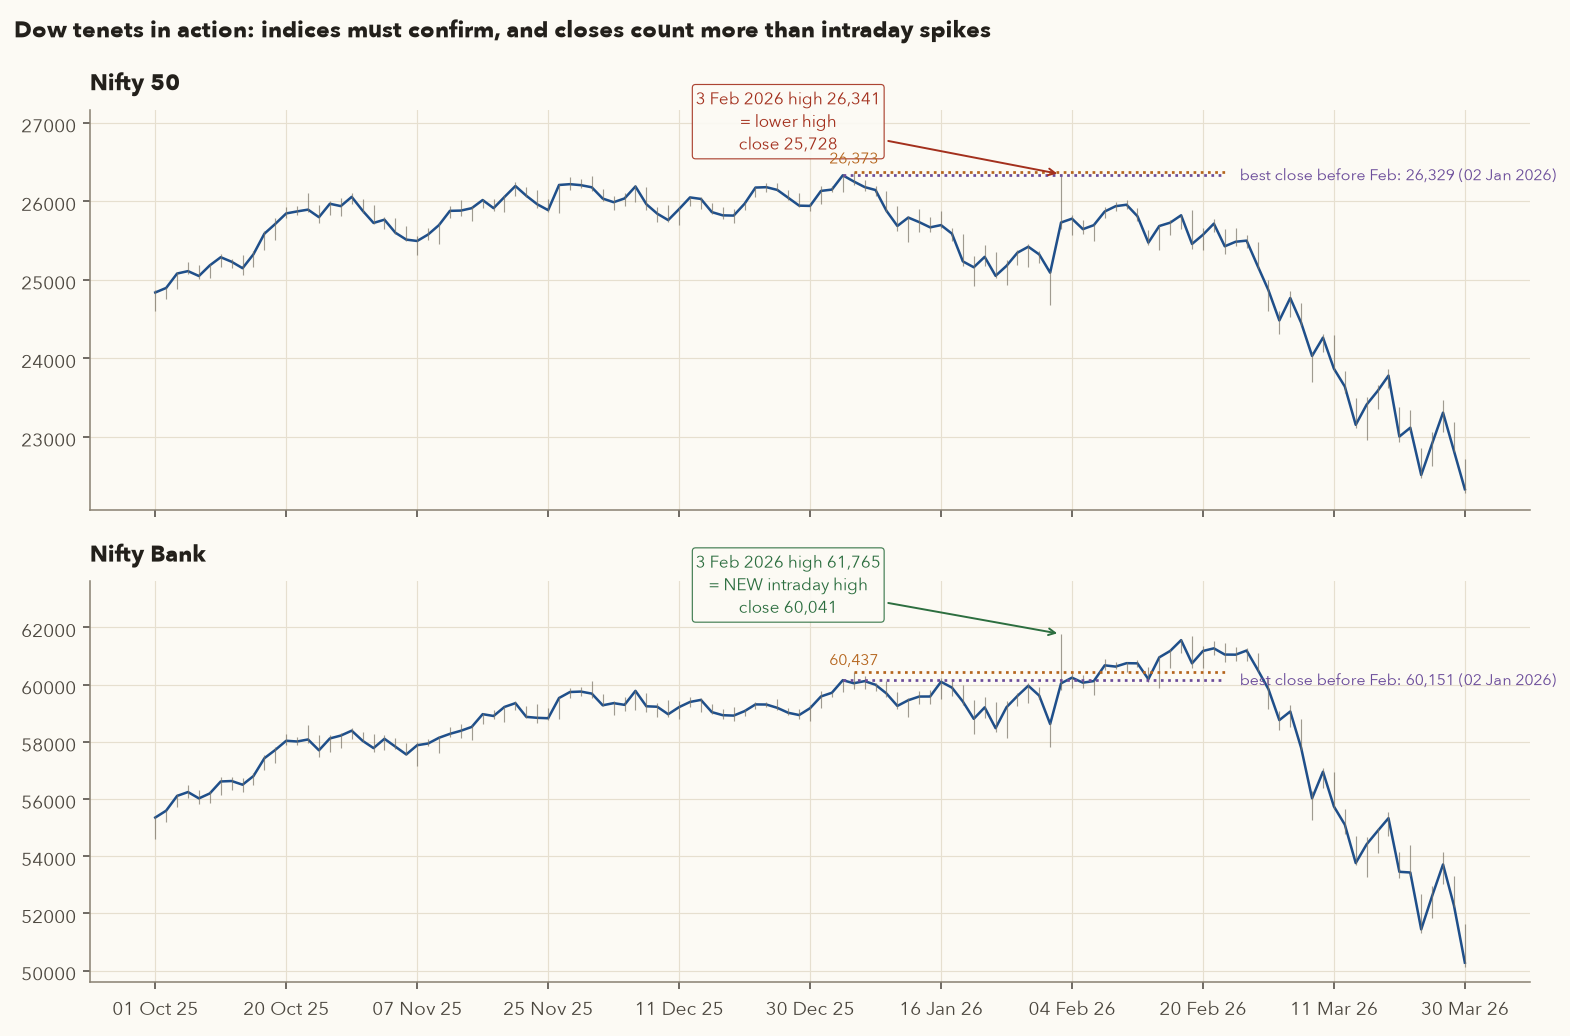
- On 3 Feb 2026 the market gapped up sharply on news of an India–US trade deal. Nifty Bank printed a new intraday high of 61,764.85, above its 5 Jan high of 60,437.35. On intraday highs alone, the bank index made a "new high".
- The Nifty 50 reached only 26,341.2 that day, below its 5 Jan high of 26,373.2. The broad index did not confirm.
- On closing prices, neither index confirmed: Nifty Bank closed at 60,041.3, below its best close of 60,150.95 (2 Jan), and the Nifty closed at 25,727.55, well below its best close of 26,328.55 (2 Jan).
- Outcome: by 30 Mar 2026 the Nifty had fallen to 22,283.85 (−15.4% from the 3 Feb high) and Nifty Bank to 50,105.25 (−18.9%).
- Lesson: a new high that only one index makes, and only intraday, is weak evidence. Dow would have asked for both indices to make new closing highs.
Using Dow Theory as a trader
- Identify the primary trend on the weekly chart and trade mainly in its direction.
- Treat secondary trends as your entry opportunities. A pullback in a primary uptrend is where swing traders buy.
- Varsity's caution: if you take a bullish candlestick signal during a secondary downtrend inside a primary uptrend, it can work, but be quick. Use tighter targets and exit if the move stalls.
- Dow's patterns (double and triple tops and bottoms, ranges and flags) are covered next, with the other classic patterns.
9. Classic chart patterns and measured moves
Chart patterns are recurring shapes produced by the tug-of-war between buyers and sellers. They fall into two families:
- Reversal patterns, which mark the end of a trend: double and triple tops and bottoms, head & shoulders and its inverse, and the cup (rounding) base.
- Continuation patterns, which are pauses within a trend: triangles, rectangles (ranges), flags and pennants. Triangles and rectangles can break either way, so treat the direction as unknown until the breakout.
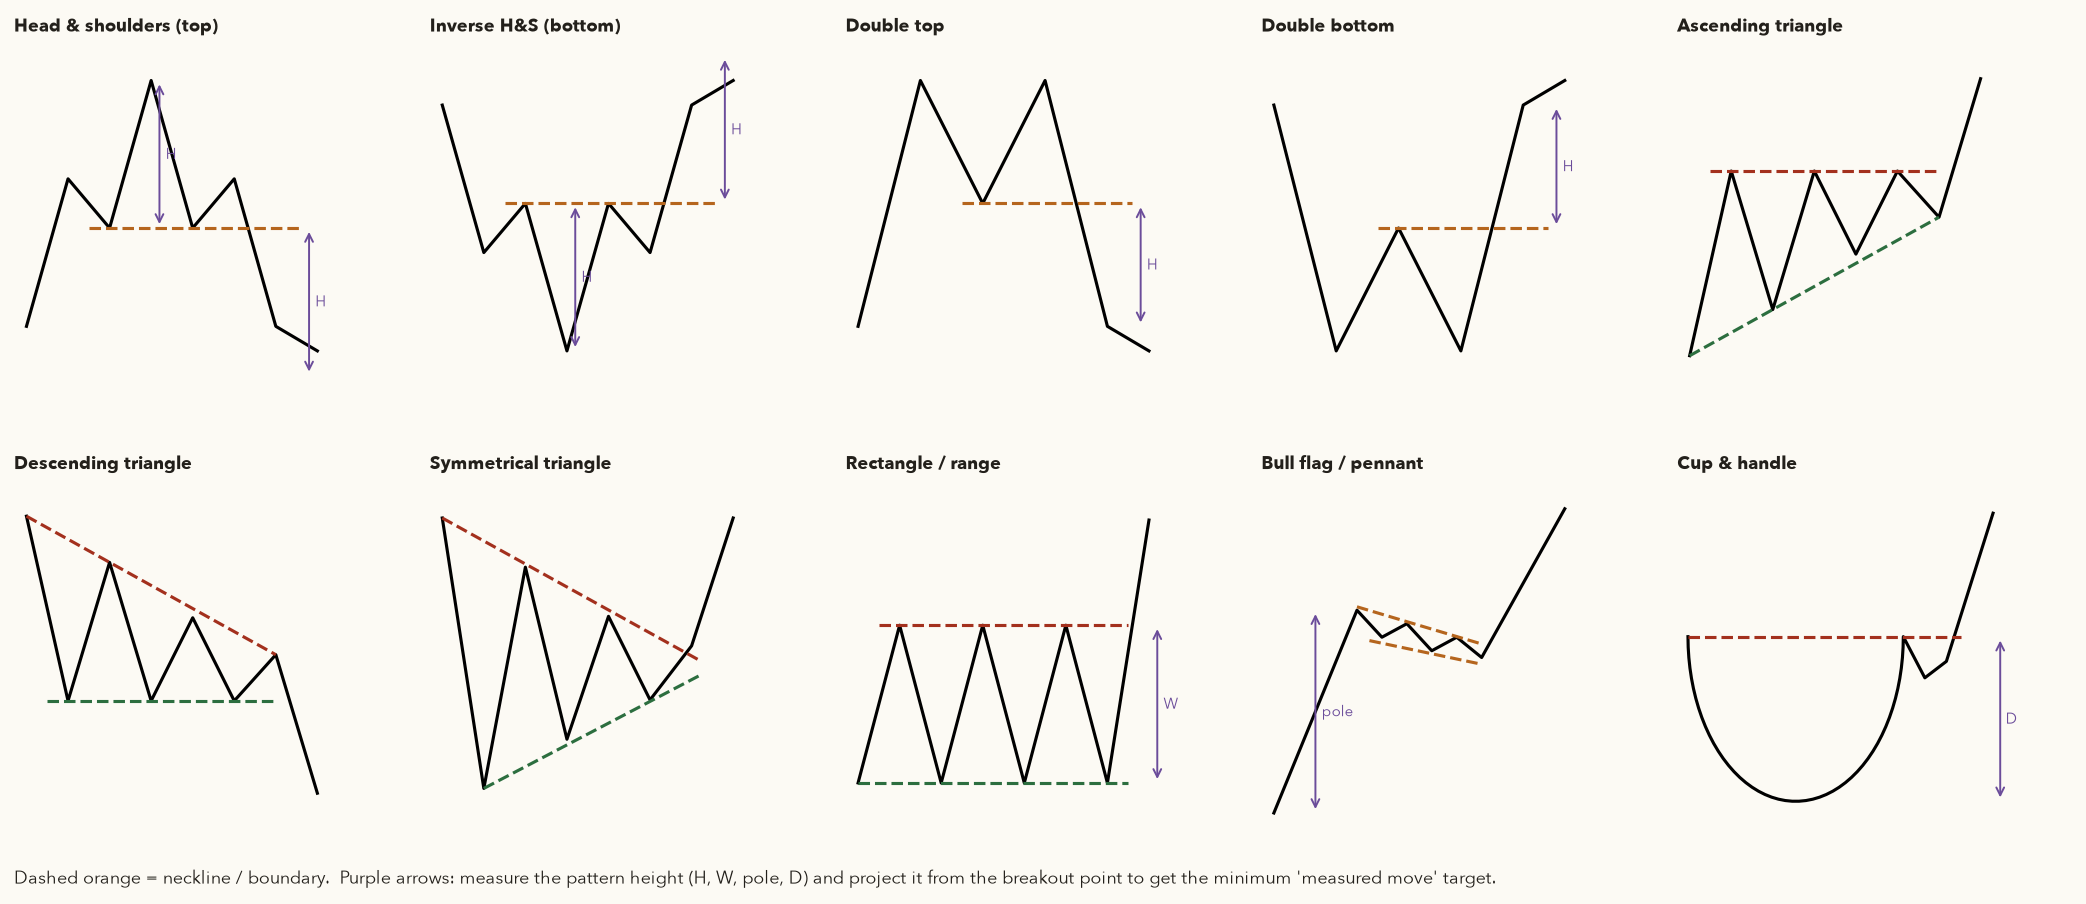
This section has a real example of every pattern in the gallery below, and each one ends with the same trade card: entry, stop, risk, target, reward-to-risk and what actually happened. First the rules that produce those numbers.
The measured-move rule
- Breakout level
- The price line whose break confirms the pattern (the neckline or boundary), in ₹.
- \(H\)
- The pattern height, in ₹: peak-to-neckline (double top, head & shoulders), range width (rectangle), triangle base, pole length (flag) or cup depth (cup and handle). The table below lists exactly what to measure for each pattern.
- \(\pm\)
- Plus for an upward breakout, minus for a downward one.
- Entry, Stop
- Your entry price and stop-loss price, in ₹.
- RRR
- Reward-to-risk ratio: the rupees you aim to make for each rupee you risk. The bars \(|\ |\) drop any minus sign, so it works for shorts too.
- Measure the pattern's height \(H\).
- Project it from the breakout level: add it for an upward break, subtract it for a downward one. That gives the minimum target.
- Divide the distance from entry to target by the distance from entry to stop. Varsity wants at least 1.5.
The logic: the height of a pattern measures how far the two sides were prepared to push each other before one side gave up. Once one side gives up, the move often travels at least that far again. Treat this as a rule of thumb that is often roughly right, not a law.
Entry, stop and target: one recipe for every pattern
Every pattern has a trigger line: the neckline, boundary or flag edge whose break completes it. The table gives the trigger, the stop, the height and the target for each pattern in this chapter. "Beyond" means above for an upward break and below for a downward one.
| Pattern | Entry: first close beyond… | Stop | Height \(H\) | Target |
|---|---|---|---|---|
| Double / triple top | the neckline (lowest low between the tops) | Halfway back: neckline + \(H/2\). Safe stop: above the highest top | highest top − neckline | neckline − \(H\) |
| Double / triple bottom | the neckline (highest high between the bottoms) | Halfway back: neckline − \(H/2\). Safe stop: below the lowest bottom | neckline − lowest bottom | neckline + \(H\) |
| Head & shoulders | the neckline (line through the two troughs) | Above the right shoulder. Safe stop: above the head | head − neckline value under the head | neckline value on the break day − \(H\) |
| Inverse head & shoulders | the neckline (line through the two peaks) | Below the right shoulder. Safe stop: below the head | neckline value above the head − head | neckline value on the break day + \(H\) |
| Ascending triangle (up break) | the flat top | Below the last rising low | flat top − first low (the base) | flat top + \(H\) |
| Descending triangle (down break) | the flat floor | Above the last falling high | first high − flat floor (the base) | flat floor − \(H\) |
| Symmetrical triangle | either sloping line | Beyond the last swing point on the other side | first high − first low (the base) | line value on the break day ± \(H\) |
| Rectangle (range) | the top or bottom of the range | Just back inside the range, about 0.5% past the broken line (Varsity). Safe stop: the middle of the range | range top − range bottom | broken line ± \(H\) |
| Bull / bear flag, pennant | the flag or pennant edge in the direction of the pole | Beyond the far side of the flag or pennant | pole length: the start of the sharp move to its end | breakout close ± pole length |
| Cup with handle | the rim (the higher of the two rims) | Below the handle low. No handle: below the last swing low, often the cup bottom | rim − cup low | rim + \(H\) |
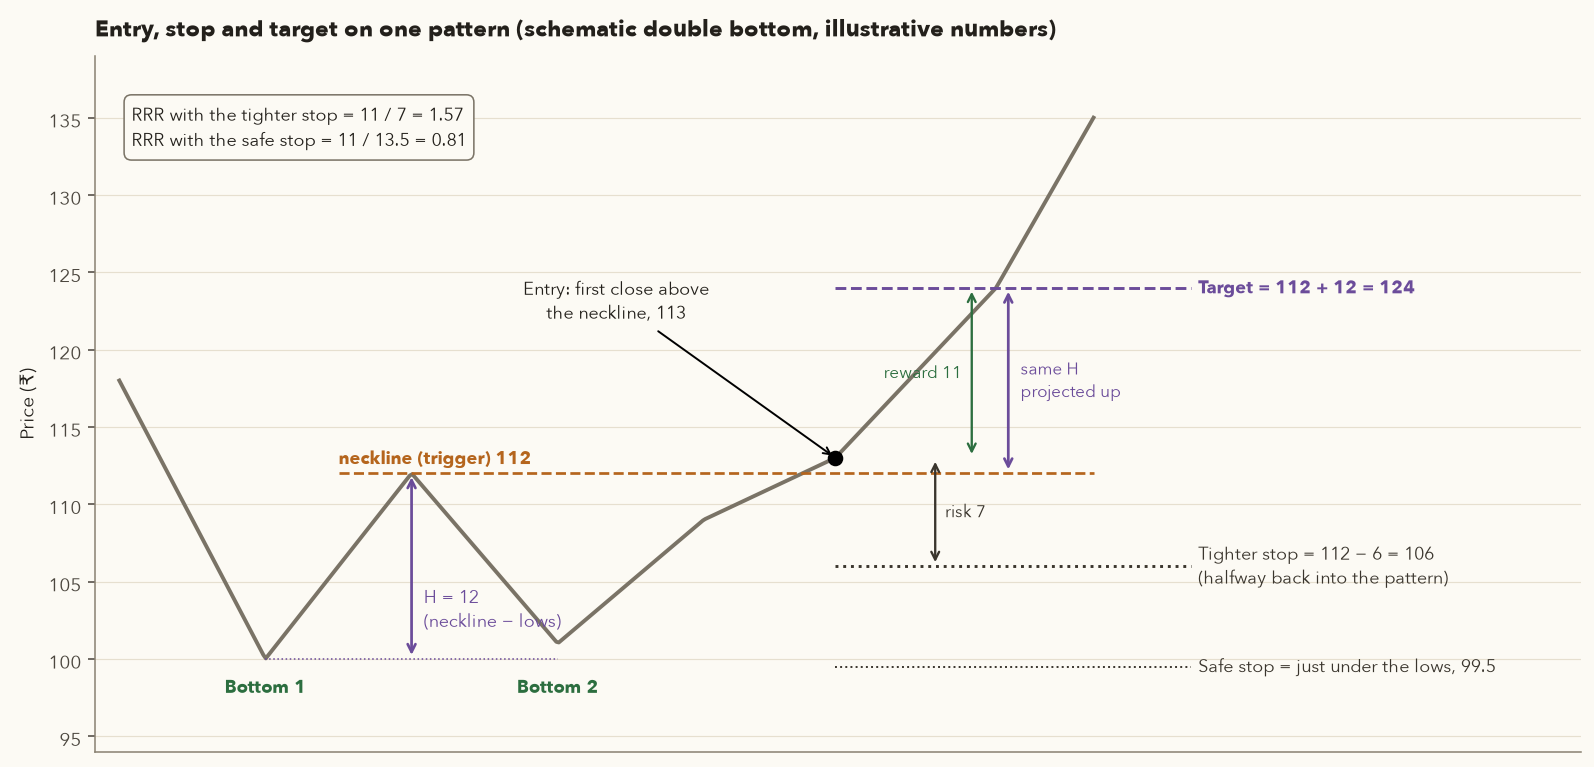
Why tops and bottoms need the halfway stop. The "safe" stop for a double bottom sits under the lows, a full \(H\) below the neckline. The target is only \(H\) above the neckline, and you enter a little above it. So the risk is always bigger than the reward, and the RRR is always below 1. Every double and triple top or bottom in this section shows it. A close back halfway into the pattern already tells you the breakout has failed, so that is where this chapter puts the working stop.
- Neckline
- The trigger line of the top or bottom, in ₹.
- \(H\)
- The pattern height, in ₹: highest top minus neckline, or neckline minus lowest bottom.
- \(\mp\)
- Minus for a bottom (the stop goes under the neckline), plus for a top (the stop goes above it).
- \(g\)
- The gap between your entry and the neckline, in ₹: how far beyond the line the confirming close was.
- \(\text{RRR}_{\text{safe}}\)
- The reward-to-risk ratio with the stop beyond the far side of the pattern.
- \(\text{RRR}_{\text{half}}\)
- The reward-to-risk ratio with the halfway stop.
- Reward = target − entry = \(H - g\), because the target is \(H\) past the neckline and you entered \(g\) past it.
- With the safe stop, risk = \(H + g\). The top of the fraction is smaller than the bottom, so the RRR is below 1 whatever the numbers.
- With the halfway stop, risk = \(H/2 + g\). If you enter right at the neckline (\(g = 0\)), the RRR is 2. The further past the line you enter, the lower it gets.
Example (the schematic below): neckline 112, lows 100, so \(H = 12\). Entry at 113, so \(g = 1\). Safe RRR = 11 / 13.5 = 0.81. Halfway stop = 112 − 6 = 106, so RRR = 11 / 7 = 1.57.
Plan the trade before you enter, in this order:
- Draw the trigger line and measure \(H\) as in the table.
- Wait for a close beyond the line. A close less than 1% beyond it is weak evidence. The safer filters from Section 6 are a close at least 1% beyond the line, or two closes in a row beyond it. Volume above its 10-day average (Section 7) adds weight. The trade cards below use that day's close as the entry. If you do your analysis after the close (the EOD workflow in Section 14), you would enter at the next day's open, at a slightly different price.
- Set the stop from the table and work out the risk per share: |entry − stop|.
- Set the target = trigger ± \(H\), and compare it with the next support or resistance level. Use whichever comes first as your first target (the checklist in Section 14 does the same).
- Compute the RRR = reward ÷ risk. If it is below your minimum (Varsity's is 1.5), skip the trade. Never move the stop closer than the table allows just to pass this test. A stop belongs where the pattern is proven wrong.
- Size the position from the risk: shares = (capital × risk %) ÷ risk per share. With ₹5,00,000 and 1% risk, a ₹50 risk per share allows 100 shares. Chapter 11 covers this in depth, and
framework.risk.position_size(capital, risk_pct, entry, stop)does the arithmetic. - Manage the trade. The stop only ever moves in your favour. Many traders book part of the position (say half) at the first support or resistance level, or at +1R (a gain equal to the risk), and trail a stop on the rest. Expect throwbacks: price often comes back to retest the broken line, and the stop in the table is placed to survive them. When the target is hit, exit or trail tightly. Reaching the target tells you nothing about what happens next.
- Remember gaps. A stop is an instruction, not a guarantee. If the stock opens beyond your stop, you are filled at the open, and the loss can be much bigger than planned (the HDFCBANK rectangle below). Size positions so that a gap through the stop hurts but does not cripple you.
Two more rules from experience. Bigger patterns matter more: a weekly pattern built over 6 months outweighs a daily one built over 6 days. And bearish patterns in the cash market are mostly a signal to exit or avoid a long. A retail swing short needs stock or index futures (Chapters 9–10). The short "trade cards" below assume futures.
9.1 Double and triple tops and bottoms
A double top means price tests the same high twice and fails. Varsity requires the tops to be at least about two weeks apart; small differences in height are fine. A triple top means three failures, which Varsity regards as stronger. The pattern is confirmed only when price closes below the neckline, the low between the tops. Bottoms are the mirror image.
Double top: step-by-step target
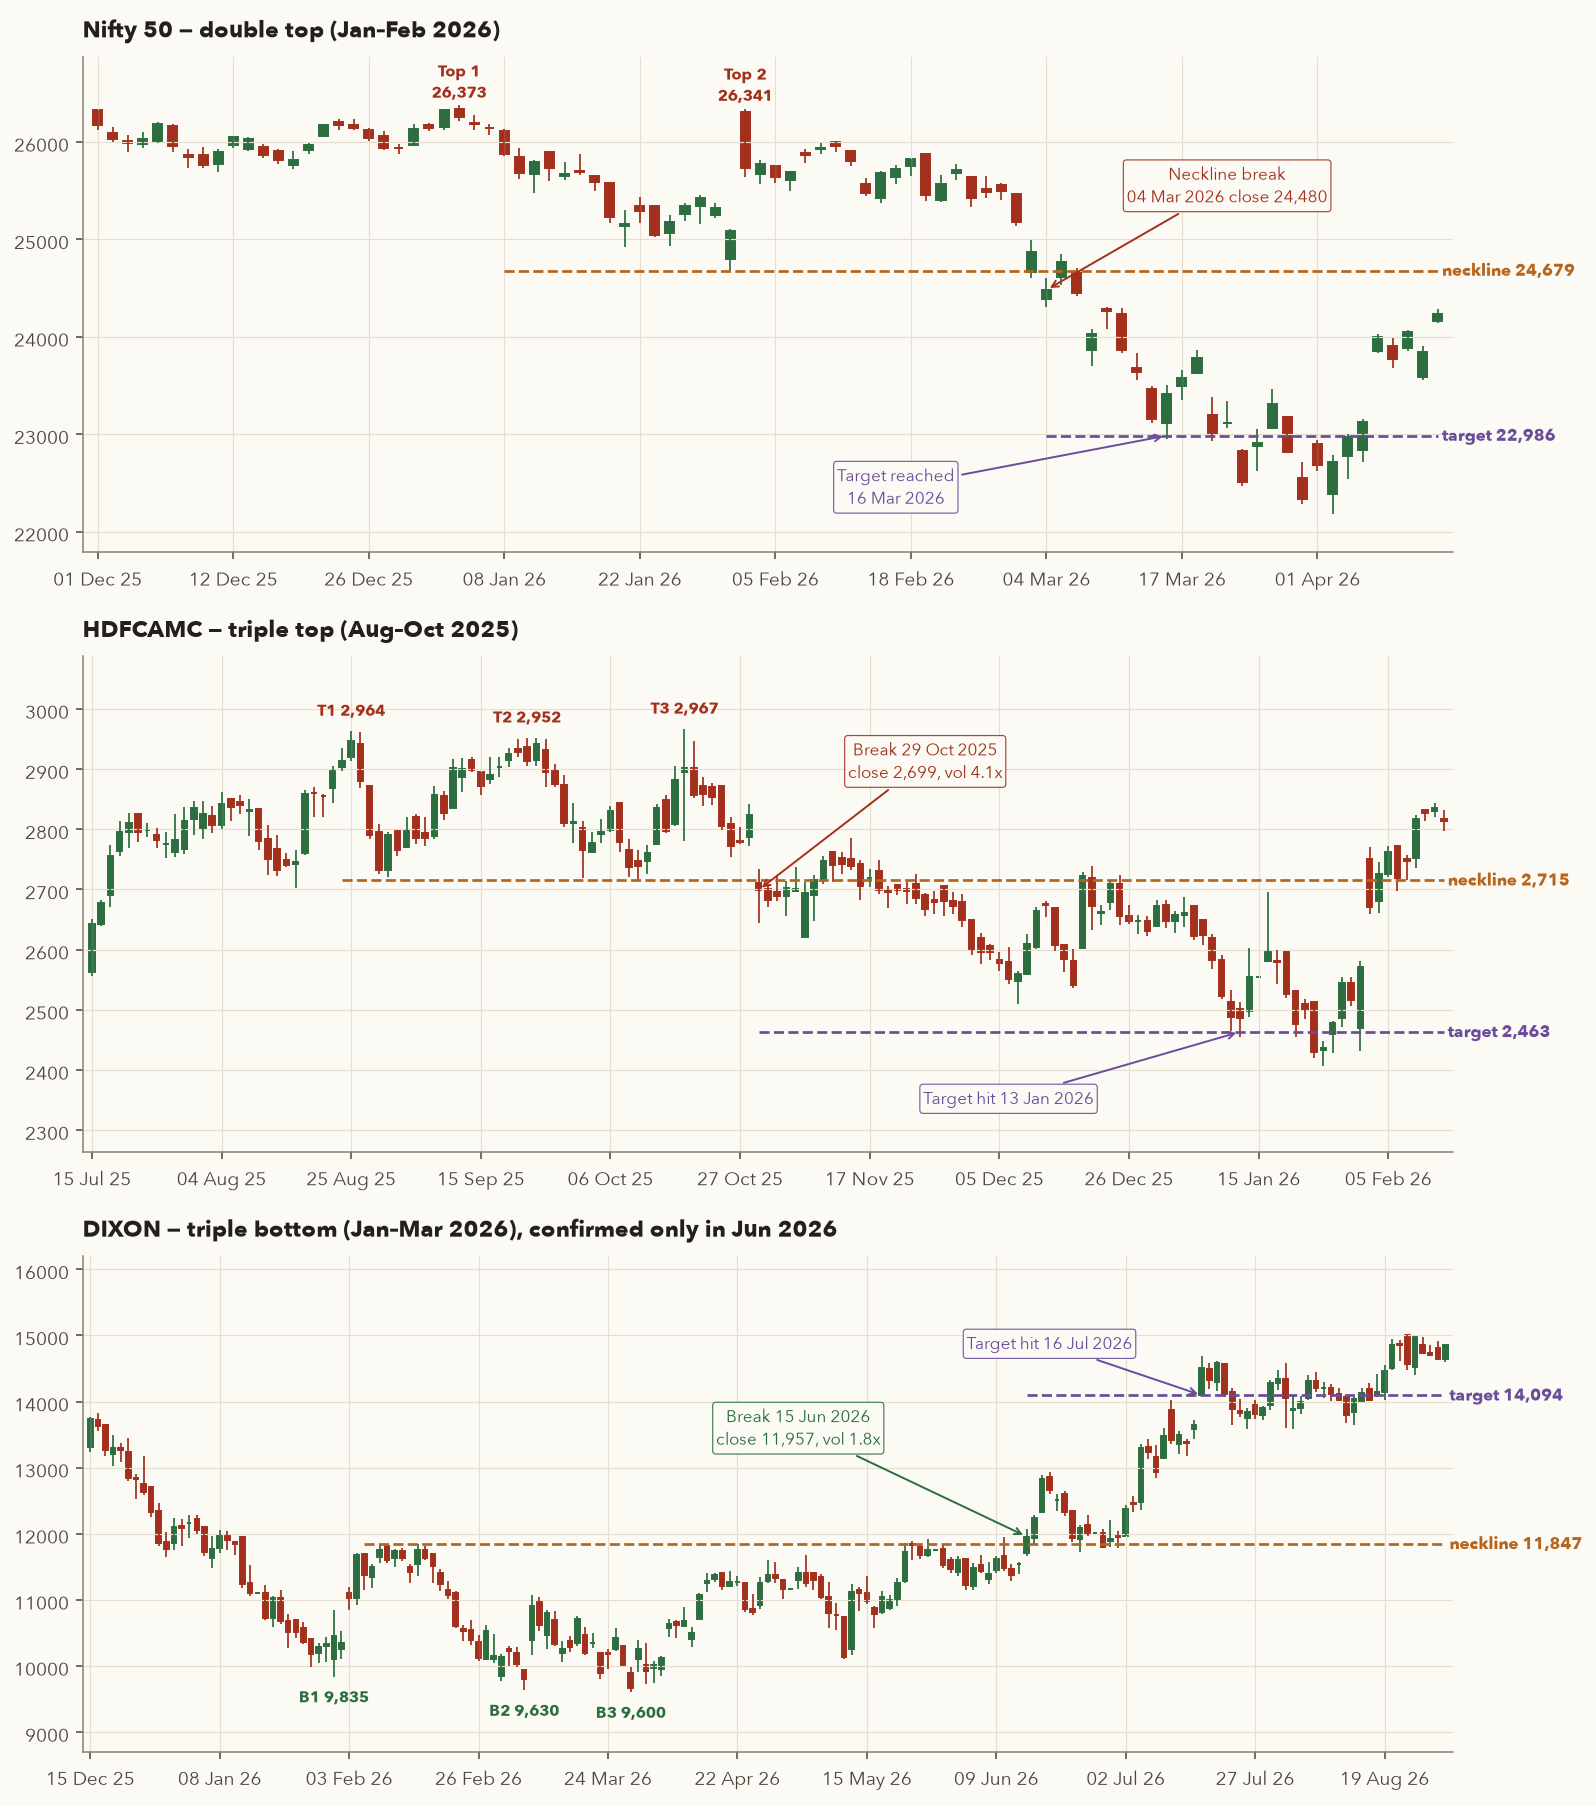
- Top 1: 26,373.2 (5 Jan 2026). Top 2: 26,341.2 (3 Feb 2026), 19 sessions later and 0.12% lower. That counts as "equal".
- Neckline: the lowest point between the tops, 24,679.4 (2 Feb 2026).
- Height \( H = 26{,}373.2 - 24{,}679.4 = 1{,}693.8 \).
- Confirmation: the first close below the neckline came on 4 Mar 2026 at 24,480.5, 0.8% below it.
- Target \( = 24{,}679.4 - 1{,}693.8 = 22{,}985.6 \). It was reached on 16 Mar 2026, and the low went on to 22,182.55 (2 Apr).
- Stops: the halfway stop is \( 24{,}679.4 + 1{,}693.8/2 = 25{,}526.3 \). The safe stop is above the highest top, 26,373.2.
| Trade card (short, Nifty futures) | Entry | Stop | Risk | Target | RRR | Outcome |
|---|---|---|---|---|---|---|
| Halfway stop | 24,480.5 | 25,526.3 | 1,045.8 | 22,985.6 | 1.43 | Target hit 16 Mar 2026 |
| Safe stop | 24,480.5 | 26,373.2 | 1,892.7 | 22,985.6 | 0.79 | Target hit 16 Mar 2026 |
Both versions worked, but neither passes a 1.5 minimum. The halfway version comes close (1.43), and a trader whose minimum is 1.0 would have taken it. The safe stop risks ₹1.27 for every ₹1 of reward, which is a poor bet even when it wins.
Double bottom with a halfway stop
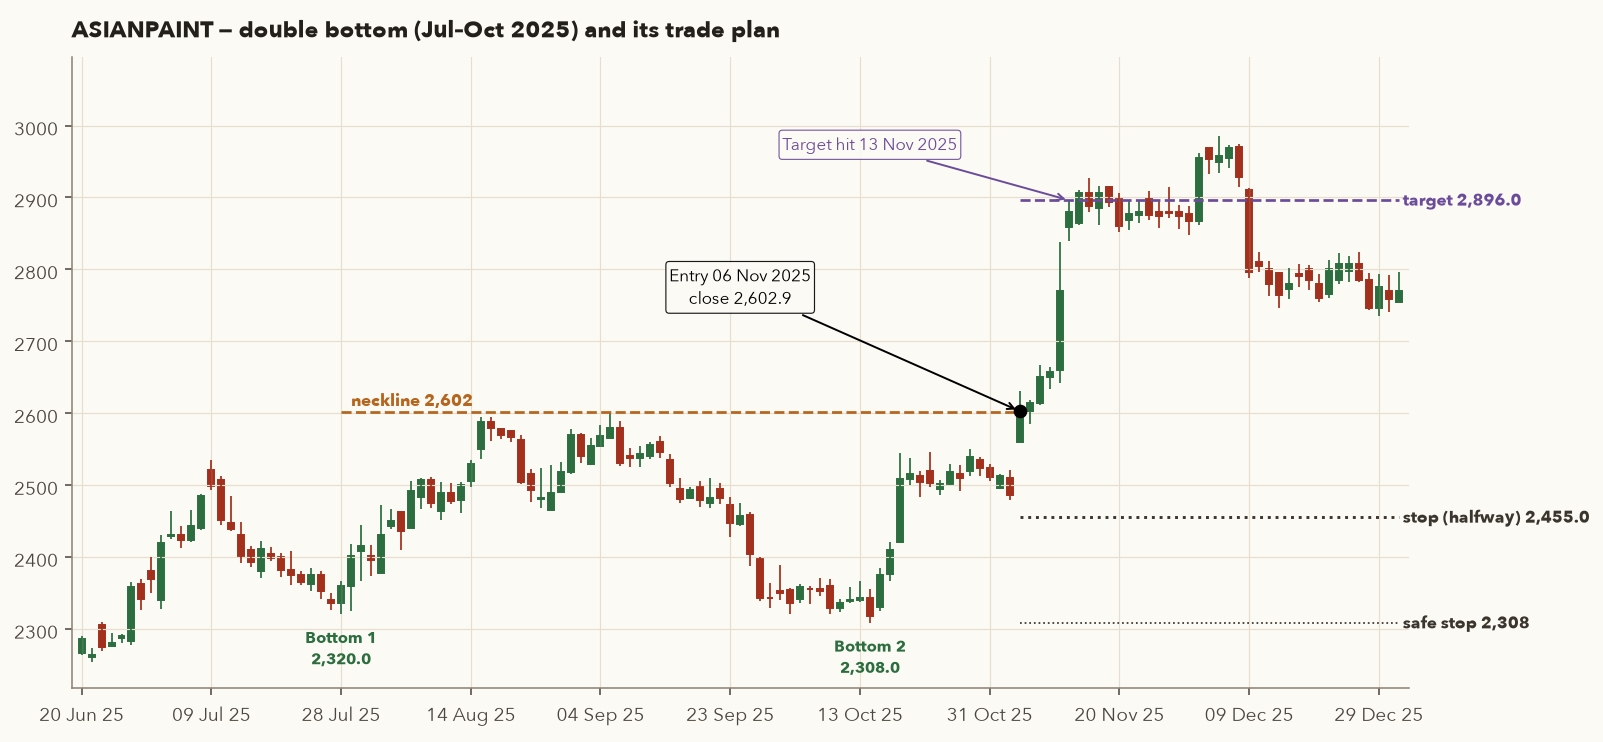
- Bottom 1: 2,320.0 (28 Jul 2025). Bottom 2: 2,308.0 (14 Oct 2025), 53 sessions later and 0.5% lower, so the two count as equal.
- Neckline: the highest high between the bottoms, 2,602.0 (5 Sep 2025). Price had stalled near 2,600 several times in August and September.
- Height \( H = 2{,}602.0 - 2{,}308.0 = 294.0 \). Target \( = 2{,}602.0 + 294.0 = 2{,}896.0 \).
- Confirmation: 6 Nov 2025 closed at 2,602.9 on 7.65× average volume. The volume was convincing, but the close was only 0.03% above the line. The stricter 1% filter confirmed on 10 Nov at 2,650.4.
- Stops: halfway \( = 2{,}602.0 - 147.0 = 2{,}455.0 \); safe = below the lows, 2,308.0.
| Trade card (long) | Entry | Stop | Risk | Target | RRR | Outcome |
|---|---|---|---|---|---|---|
| Halfway stop | 2,602.9 | 2,455.0 | 147.9 (5.7%) | 2,896.0 | 1.98 | Target hit 13 Nov 2025 |
| Safe stop | 2,602.9 | 2,308.0 | 294.9 (11.3%) | 2,896.0 | 0.99 | Target hit 13 Nov 2025 |
The target came only five sessions after entry. Entering at the neckline itself is what made the halfway RRR close to its maximum of 2: the gap \(g\) was almost zero. A trader who waited for the 1% filter would have entered 47.5 higher at 2,650.4, with a lower RRR of 1.25.
Triple top with volume confirmation
- Tops: 2,963.75 (25 Aug), 2,952.5 (22 Sep), 2,967.25 (16 Oct 2025). All within 0.5% of each other and about 4 weeks apart.
- Neckline: the lower of the two intervening lows, 2,715.25 (9 Oct; the other was 2,721.0 on 1 Sep).
- Break: 29 Oct 2025 close 2,699.0 on 4.11× volume (the worked calculation in Section 7).
- \( H = 2{,}967.25 - 2{,}715.25 = 252 \) → target \( 2{,}715.25 - 252 = 2{,}463.25 \).
- Stops: halfway \( = 2{,}715.25 + 126 = 2{,}841.25 \); safe = above the third top, 2,967.25.
| Trade card (short, futures) | Entry | Stop | Risk | Target | RRR | Outcome |
|---|---|---|---|---|---|---|
| Halfway stop | 2,699.0 | 2,841.25 | 142.25 (5.3%) | 2,463.25 | 1.66 | Target hit 13 Jan 2026 |
| Safe stop | 2,699.0 | 2,967.25 | 268.25 (9.9%) | 2,463.25 | 0.88 | Target hit 13 Jan 2026 |
With the safe stop this short fails Varsity's test, which is how many good-looking patterns end. The halfway stop passes at 1.66. For an investor holding the stock, the breakdown was simply a signal to reduce exposure or tighten a stop.
Triple bottom: patience required
- Bottoms: 9,835 (30 Jan), 9,630 (9 Mar), 9,600 (30 Mar 2026). Neckline: the 10 Feb high of 11,847.
- The neckline did not break until 15 Jun 2026 (close 11,957, 1.81× volume), 52 sessions after the third bottom. Buying "because it looks like a bottom" in April meant months of waiting and a possible drawdown.
- \( H = 11{,}847 - 9{,}600 = 2{,}247 \) → target \( 11{,}847 + 2{,}247 = 14{,}094 \).
- Stops: halfway \( = 11{,}847 - 1{,}123.5 = 10{,}723.5 \); safe = below the lowest bottom, 9,600.
| Trade card (long) | Entry | Stop | Risk | Target | RRR | Outcome |
|---|---|---|---|---|---|---|
| Halfway stop | 11,957 | 10,723.5 | 1,233.5 (10.3%) | 14,094 | 1.73 | Target hit 16 Jul 2026 (gap open at 14,101) |
| Safe stop | 11,957 | 9,600 | 2,357 (19.7%) | 14,094 | 0.91 | Target hit 16 Jul 2026 |
Even the halfway stop is 10% away, because the pattern is big. That is not a reason to tighten it. It is a reason to buy fewer shares: the position size, not the stop, absorbs the size of the pattern.
We ran a crude automated scan on 38 instruments in the course data from Jan 2025 to Sep 2026. It looked for two zig-zag (6%) peaks or troughs within 2.5% of each other and at least 10 sessions apart, then checked whether the measured target was hit within 60 sessions of the neckline break.
| Pattern | Never broke neckline | Broke, target hit ≤60 sessions | Broke, target missed | Hit rate after break |
|---|---|---|---|---|
| Double/triple top | 24 | 37 | 68 | 35% |
| Double/triple bottom | 39 | 39 | 49 | 44% |
Even after confirmation, the full measured target was reached well under half the time. The four examples above were chosen to teach the method, so they flatter it. That is why sensible traders take partial profits at the first resistance, trail the rest, and keep the stop discipline that makes a 35–45% hit rate profitable when winners are bigger than losers (Chapter 11).
9.2 Head & shoulders (and the inverse)
A head & shoulders top has three peaks: a left shoulder, a higher head and a lower right shoulder. The neckline joins the two troughs between them and can slope. Varsity's Innerworth module reads it as a map of crowd psychology. The left shoulder is the last confident rally. At the head, enthusiasm peaks and then fails. The weak right shoulder shows buyers are tiring. The neckline break is where hope turns to fear. Volume is ideally heaviest at the left shoulder and head and lighter on the right shoulder. Treat the pattern as unconfirmed until the neckline breaks. An "almost head & shoulders" proves nothing. The inverse head & shoulders is the same shape upside down, at the end of a downtrend.
Because the right shoulder is lower than the head, a stop above the right shoulder is closer than the head, and it usually gives a workable RRR. That is the stop used in the trade cards below.
- \(P_{\text{head}}\)
- The price at the top of the head, in ₹.
- \(\text{Neck}(x)\)
- The neckline's value on session \(x\), in ₹. The neckline is a straight line through the two troughs, worked out like the trendline in Section 3, so its value changes from session to session when it slopes.
- \(x_{\text{head}}\)
- The session of the head.
- \(x_{\text{break}}\)
- The session of the neckline break (the first close below the neckline).
- \(H\)
- The height of the head above the neckline, in ₹.
- Find the neckline's value directly below the head and subtract it from the head's price. That's \(H\).
- On the day of the break, take the neckline's value that day and subtract \(H\). That's the target.
- For an inverse head & shoulders (a bottom), flip it: \(H\) = neckline value above the head minus the head's low, and the target is the neckline value on the break day plus \(H\).
Head & shoulders top, with a scary throwback
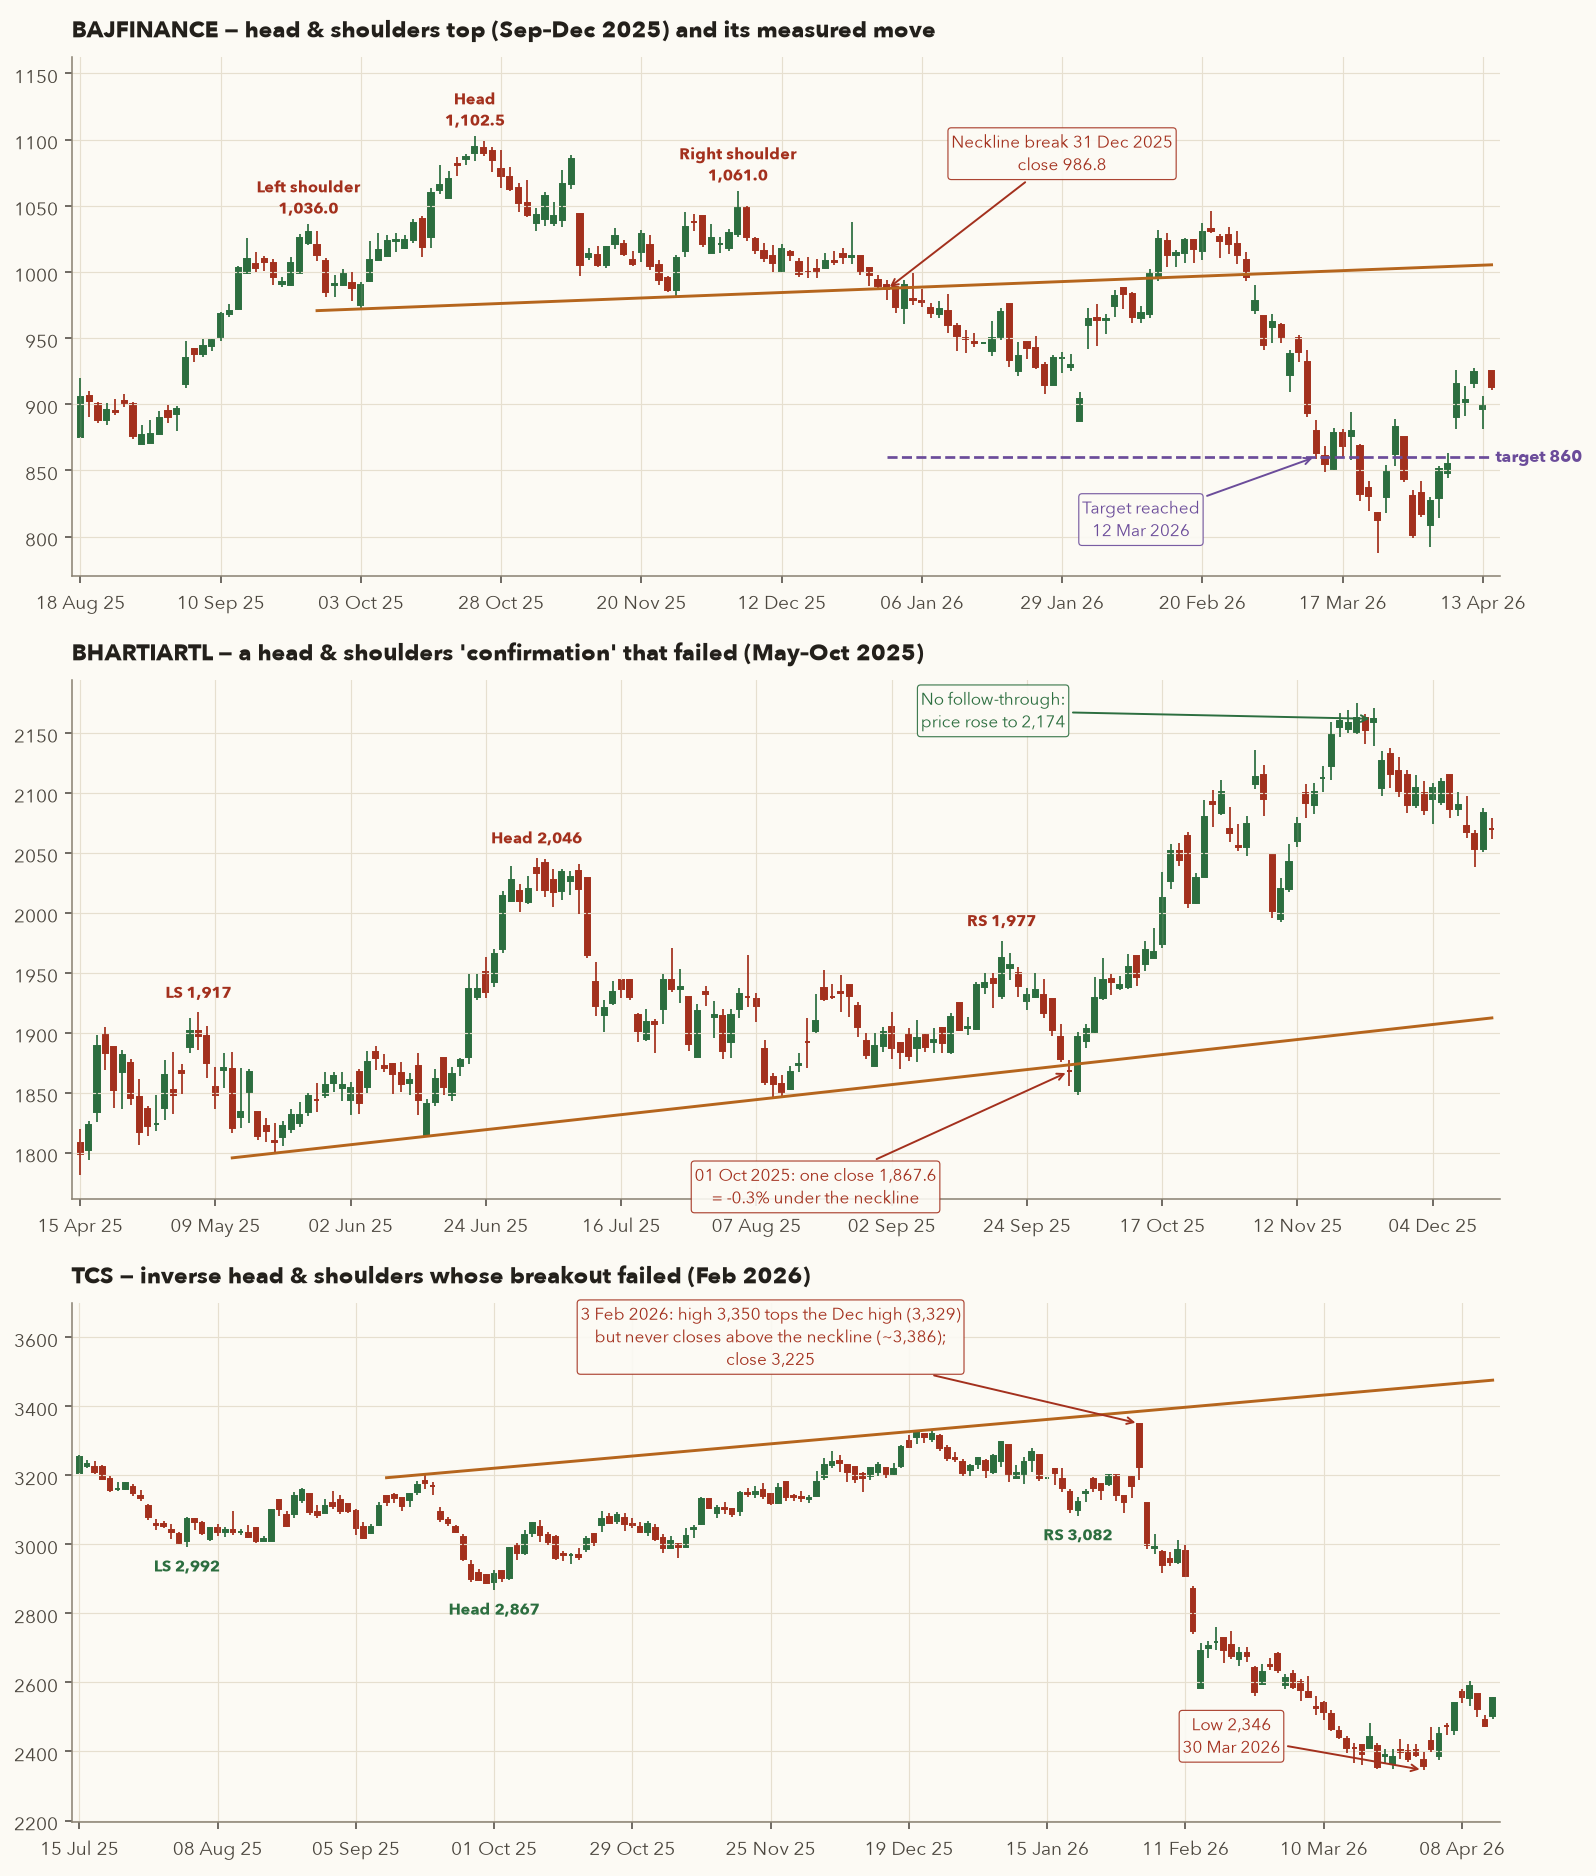
- Left shoulder 1,036.0 (24 Sep 2025), head 1,102.5 (23 Oct), right shoulder 1,061.0 (5 Dec).
- Neckline through the troughs 972.0 (3 Oct) and 981.3 (26 Nov). It slopes up slightly; its value below the head is 975.36.
- \( H = 1{,}102.5 - 975.36 = 127.14 \).
- Break: 31 Dec 2025 close 986.8, below the neckline value of 987.5 that day, on 1.95× volume. Target \( = 987.5 - 127.14 = 860.36 \).
- Note how thin that break was: 0.07% below the line. On 2 Jan 2026 the stock closed back above it (990.45). With the stricter filter recommended in the BHARTIARTL example below (two consecutive closes at least 1% beyond the neckline), confirmation came on 7 Jan 2026 at 968.8. That is a later, lower entry, but it avoids most one-day false signals.
- Throwback: in Feb 2026 price rallied back above the neckline, with 11 closes above it between 12 and 26 Feb and a high of 1,046 on 23 Feb. A tight stop 1% above the neckline (997.37) would have been hit as early as 5 Jan. The stop above the right shoulder (1,061) survived.
- Target reached on 12 Mar 2026, and the low reached 787.9 on 23 Mar.
| Trade card (short, futures) | Entry | Stop | Risk | Target | RRR | Outcome |
|---|---|---|---|---|---|---|
| First close below (31 Dec) | 986.8 | 1,061.0 | 74.2 (7.5%) | 860.36 | 1.70 | Target hit 12 Mar 2026 |
| Two-close filter (7 Jan) | 968.8 | 1,061.0 | 92.2 (9.5%) | 860.36 | 1.18 | Target hit 12 Mar 2026 |
The filter costs something: a later entry is closer to the target and further from the stop, so the RRR falls from 1.70 to 1.18. The stop above the head (1,102.5) would have cut the first entry's RRR to 1.09. The right-shoulder stop is the one that makes this trade worth taking.
Inverse head & shoulders that worked, slowly
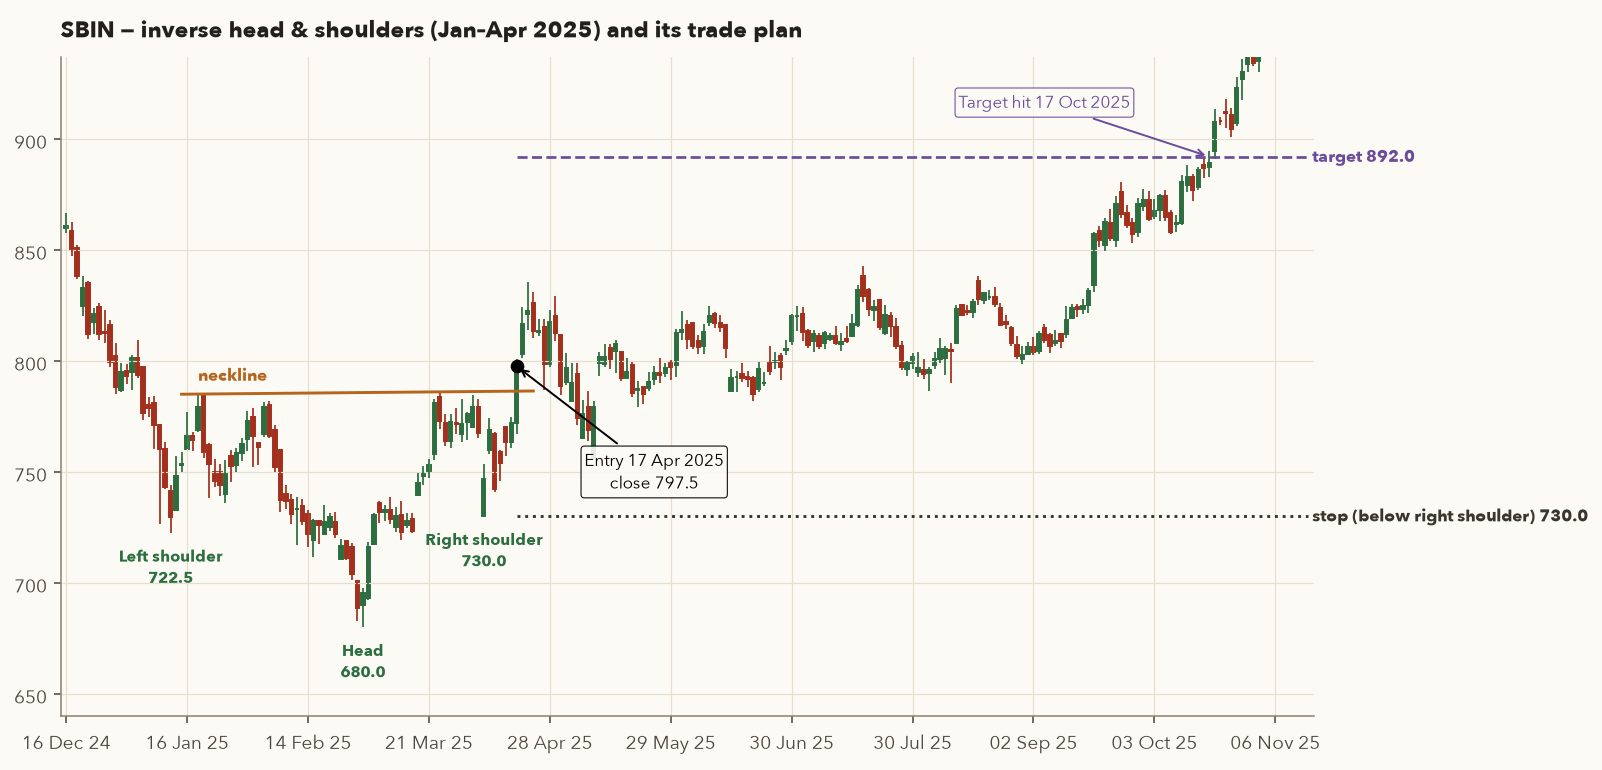
- Left shoulder 722.5 (13 Jan 2025), head 680.0 (3 Mar), right shoulder 730.0 (7 Apr, the day of the global tariff sell-off).
- Neckline through the two peaks between them: 785.0 (20 Jan) and 786.0 (25 Mar). It is almost flat. Its value above the head is 785.68.
- \( H = 785.68 - 680.0 = 105.68 \).
- Break: 17 Apr 2025 close 797.45, 1.4% above the neckline value of 786.32 that day, on 2.77× volume. That passes the 1% filter on the first day.
- Target \( = 786.32 + 105.68 = 892.0 \). Stop: below the right shoulder, 730.0.
| Trade card (long) | Entry | Stop | Risk | Target | RRR | Outcome |
|---|---|---|---|---|---|---|
| Below right shoulder | 797.45 | 730.0 | 67.45 (8.5%) | 892.0 | 1.40 | Target hit 17 Oct 2025 |
An RRR of 1.40 is just under Varsity's 1.5, so a strict trader would have passed, and the trade worked. That is the same lesson as the RELIANCE breakout in Section 6: rules sometimes cost you a winner, and over many trades they save you more than they cost. Note also the time: the target came six months after entry, after four months of sideways closes between about 770 and 830. A measured move says how far, never how soon.
A "confirmed" H&S that went the other way
- Left shoulder 1,917 (May), head 2,045.8 (Jul), right shoulder 1,976.8 (Sep 2025). Rising neckline through 1,799.5 (20 May) and 1,845.7 (11 Aug).
- On 1 Oct 2025 there was one close, at 1,867.6, just 0.29% below the neckline (1,873.1). Strictly by the book, that is a confirmed top.
- Instead the stock reversed and rallied to 2,174.5 by 21 Nov 2025, 16% above the "breakdown".
- Lesson: use a confirmation filter, such as a close at least 1% beyond the neckline, two consecutive closes, or above-average volume. Here no filter ever confirmed: 1 Oct was the only close below the line. Even with a filter, always use a stop.
| Trade card (short, futures) | Entry | Stop | Risk | Target | RRR | Outcome |
|---|---|---|---|---|---|---|
| First close below (1 Oct) | 1,867.6 | 1,976.8 | 109.2 (5.8%) | 1,651.08 | 1.98 | Stopped 16 Oct 2025 (−1R) |
| With the 1% filter | No trade: price never closed 1% below the neckline. | |||||
The plan looked excellent on paper (RRR 1.98), and the stop did its job: a loss of one planned unit of risk, instead of the 16% the stock rallied.
Inverse H&S that never completed
- Left shoulder 2,991.6 (4 Aug 2025), head 2,866.6 (1 Oct), right shoulder 3,082.0 (21 Jan 2026). Neckline through the highs 3,203.0 (18 Sep) and 3,328.6 (22 Dec), rising to about 3,386 by early Feb.
- On 3 Feb 2026 TCS opened at its high of 3,350, above the December high but still below the neckline, and closed at 3,225.3.
- The pattern was never confirmed. Price fell to 2,346.2 by 30 Mar 2026. Anyone who bought "in anticipation" of the breakout and held without a stop lost more than a quarter of their capital in that stock within two months.
| Trade card | Entry | Stop | Risk | Target | RRR | Outcome |
|---|---|---|---|---|---|---|
| By the recipe | No trade: there was never a close above the neckline. | |||||
| Early buyer (3 Feb close) | 3,225.3 | 3,082.0 | 143.3 (4.4%) | — | — | Stopped the next day, 4 Feb 2026 |
Even the early buyer who at least used the right-shoulder stop lost only 4.4%, against a 27% fall for the one who didn't.
9.3 Triangles, rectangles, flags and pennants
- Ascending triangle: flat resistance with rising lows. Buyers keep paying more while sellers defend one price, which is usually (not always) resolved upward.
- Descending triangle: flat support with falling highs. The mirror image, with a bearish bias.
- Symmetrical triangle: lower highs and higher lows converging. Neither side dominates, so wait for the break.
- Rectangle (range): flat top and flat bottom (KOTAKBANK in Section 4, HDFCBANK in Section 7). Target = range width.
- Flag / pennant: a sharp, almost vertical move (the pole) followed by a short, tight, low-volume pause. In a flag the pause is a small parallelogram, often sloping slightly against the pole. In a pennant it is a small symmetrical triangle. Varsity describes the pole as a sustained, almost vertical rally and the pause as lasting about 5–15 sessions. Retail traders book profits during the pause while institutions hold, and the trend often resumes abruptly. Target = pole length added to (or, for a bear flag, subtracted from) the breakout.
- first high, first low
- The first reaction high and first low at the start of the triangle, where it is widest (the base), in ₹. For an ascending or descending triangle, one of them is the flat line.
- \(H\)
- The height of the base, in ₹.
- Breakout level
- The value of the broken line on the breakout day, in ₹. For a flat line this is simply its price.
- \(\pm\)
- Plus for an upward breakout, minus for a downward one.
How it works: measure the triangle at its widest point, at the start, and project that height from wherever price breaks out. The lines converge, so the triangle is narrower at the break, but the target still uses the base.
Ascending triangle that broke up (and fell short of target)
- Flat top ≈ 1,929.5, tested in mid-May and again 3–8 Jul 2026. Rising lows: 1,756.8 (3 Jun) → 1,834.0 (22 Jun).
- Breakout: 9 Jul 2026 close 1,938.7 on 2.65× volume.
- \( H = 1{,}929.5 - 1{,}756.8 = 172.7 \) → target 2,102.2. Stop: below the last rising low, 1,834.0.
| Trade card (long) | Entry | Stop | Risk | Target | RRR | Outcome |
|---|---|---|---|---|---|---|
| Below last rising low | 1,938.7 | 1,834.0 | 104.7 (5.4%) | 2,102.2 | 1.56 | Stopped 11 Sep 2026 (−1R) |
| Same, half booked at +1R | Half sold at 2,043.4 on 31 Jul (+1R), half stopped at 1,834.0 (−1R): about break-even before costs. | |||||
The high was 2,046.9 on 31 Jul, 66% of the way to the target. By late August price was back below the breakout level, and the stop was hit in September. Booking part of the position at +1R turned a full loss into a scratch. This is what "take partial profits" means in practice.
Ascending triangle that broke down
- Flat top 1,245; rising lows 1,155 (19 Jun) → 1,188.5 (14 Jul 2025).
- On 24 Jul 2025 the stock closed at 1,161.05 on 5.36× volume, breaking the rising line instead of the flat top. The low reached 1,084.7 on 14 Aug.
- Lesson: a pattern's usual bias is not a promise. Trade the break that actually happens.
| Trade card | Entry | Stop | Risk | Target | RRR | Outcome |
|---|---|---|---|---|---|---|
| Long (upside break) | No trade: price never closed above the flat top. | |||||
| Short on the actual break | 1,161.05 | 1,245.0 | 83.95 (7.2%) | 1,114.26 | 0.56 | Skip (RRR too low). Target was hit 28 Jul |
The short's target is the rising line's value on the break day (1,204.26) minus \(H\) (1,245 − 1,155 = 90). The close came 3.6% below the line, after most of the move had already happened, so the RRR was poor. Skipping it was correct even though the target was hit two sessions later. For a holder of the stock, though, the break of the rising line was a clear signal to exit.
Descending triangle: flat floor, falling highs
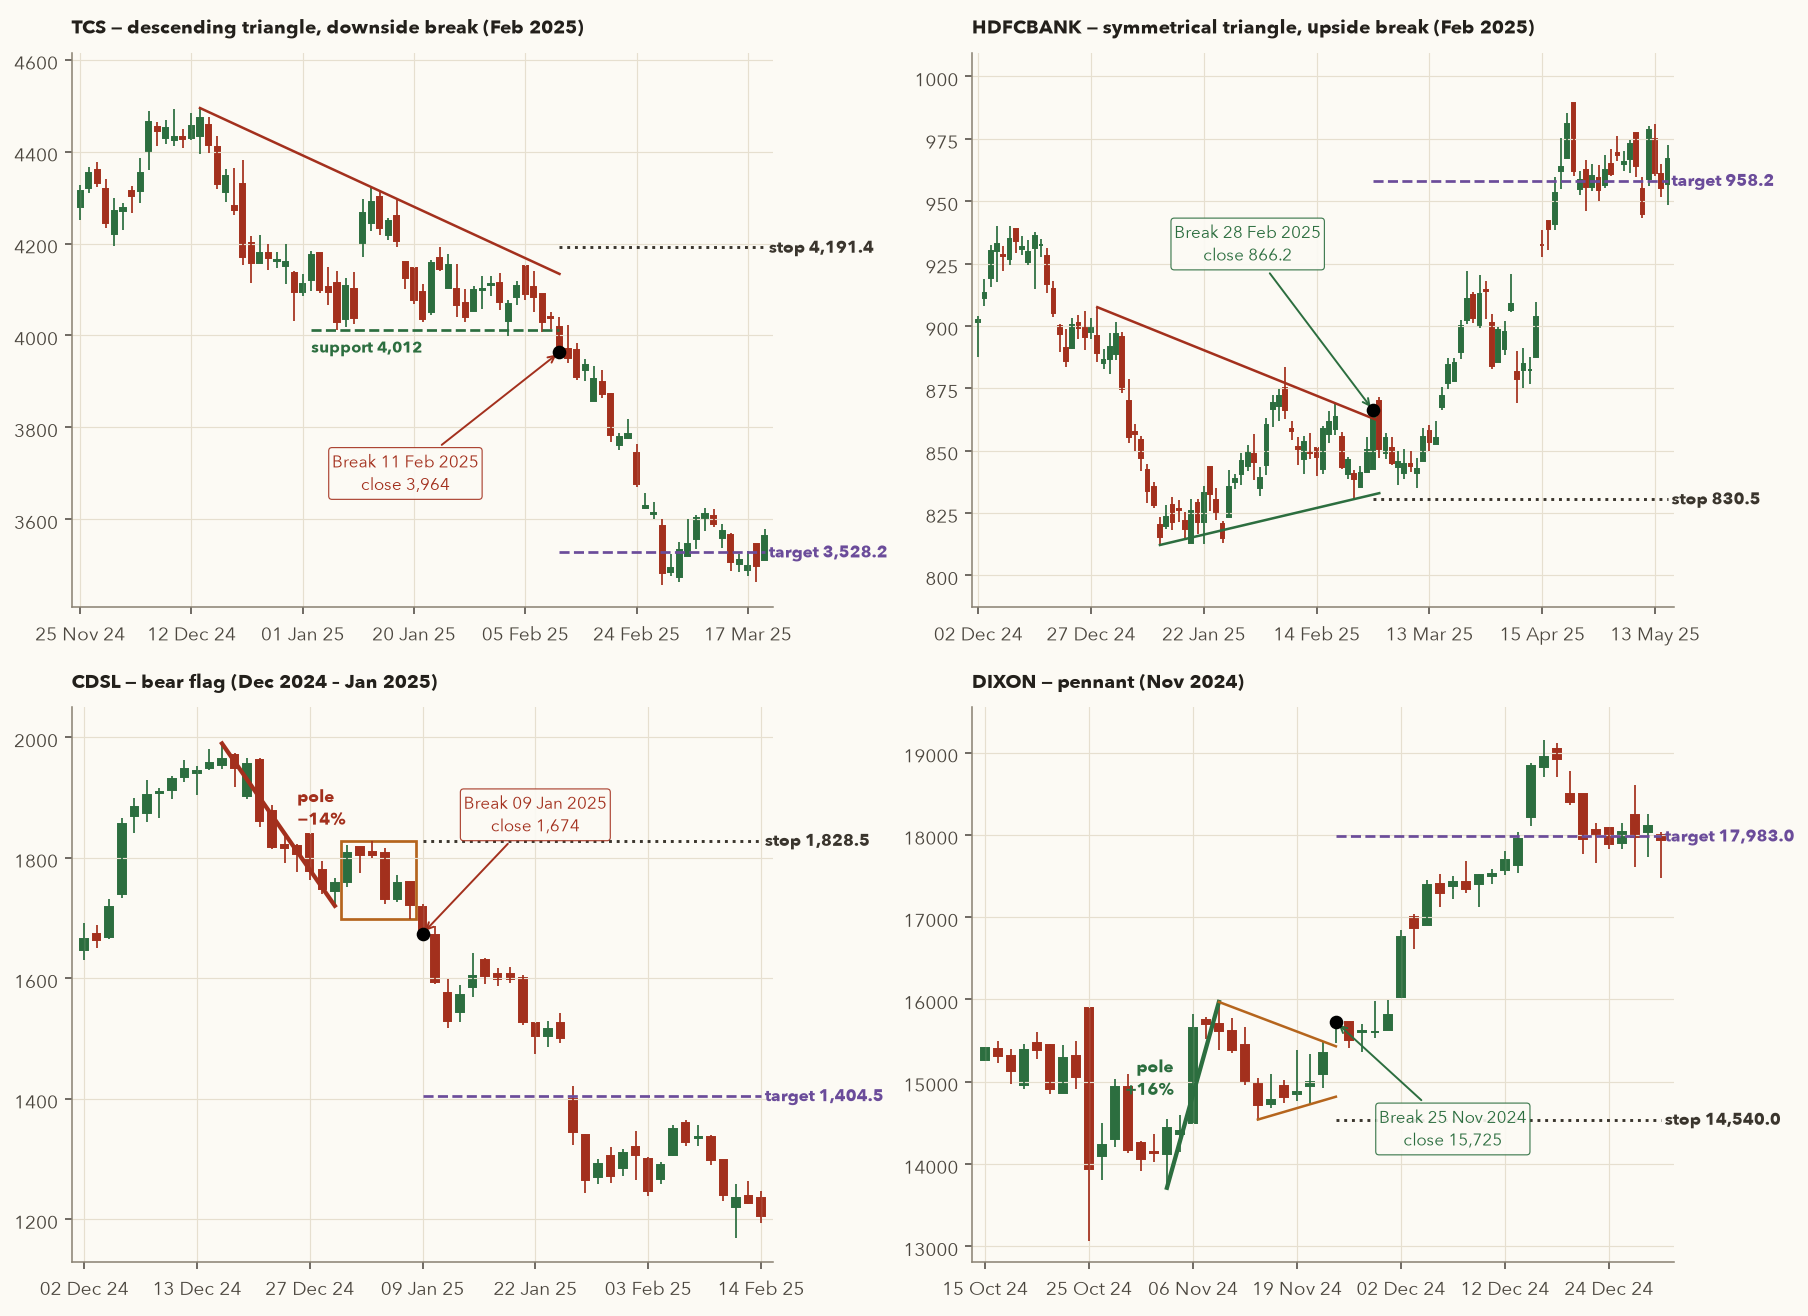
- Falling highs: 4,494.9 (13 Dec 2024) → 4,322.95 (13 Jan 2025) → 4,191.35 (23 Jan).
- Flat floor: lows of 4,011.55 (7 Jan) and 4,030.0 (21 Jan), 0.5% apart. Support = 4,011.55.
- \( H = 4{,}494.9 - 4{,}011.55 = 483.35 \) → target \( = 4{,}011.55 - 483.35 = 3{,}528.2 \).
- Break: 11 Feb 2025 close 3,963.55, 1.2% below the floor, on 1.18× volume. Stop: above the last falling high, 4,191.35.
| Trade card (short, futures) | Entry | Stop | Risk | Target | RRR | Outcome |
|---|---|---|---|---|---|---|
| Above last falling high | 3,963.55 | 4,191.35 | 227.8 (5.7%) | 3,528.2 | 1.91 | Target hit 28 Feb 2025 |
The safe stop above the first high (4,494.9) would have cut the RRR to 0.82. Using the last lower high is what keeps triangle trades workable: each lower high is a fresh sign that sellers are in control, and a close above it says that has changed.
Symmetrical triangle that broke up
- Upper line through the highs 907.5 (30 Dec 2024) and 868.95 (19 Feb 2025). Lower line through the lows 812.15 (13 Jan) and 830.55 (24 Feb). A few intraday prices poke through the lines by less than 1%, which is normal for lines drawn by hand.
- \( H = 907.5 - 812.15 = 95.35 \).
- Break: 28 Feb 2025 close 866.2 on 2.78× volume, above the upper line's value of 862.86 that day. Target \( = 862.86 + 95.35 = 958.21 \).
- Stop: below the last swing low on the other side, 830.55.
- The close was only 0.39% above the line. The 1% filter did not confirm until 19 Mar (close 872.05), after a dip back inside the triangle in early March.
| Trade card (long) | Entry | Stop | Risk | Target | RRR | Outcome |
|---|---|---|---|---|---|---|
| Below last swing low | 866.2 | 830.55 | 35.65 (4.1%) | 958.21 | 2.58 | Target hit 17 Apr 2025 |
The dip back inside the triangle in March tested the nerves but stayed above 830.55. A symmetrical triangle has no built-in bias, so a downside break would have been traded the same way, short, with the stop above 868.95.
Rectangle breakdown: when a gap jumps the stop
- The range from Section 7: floor 939.1, ceiling 1,020.5, width \( H = 81.4 \). Target \( = 939.1 - 81.4 = 857.7 \).
- The first close below the floor (9 Jan 2026, 939.0) was only 0.01% below it. The first close more than 1% below came on 14 Jan at 925.45. That is the entry.
- Stop: just back inside the range, 0.5% above the floor, 943.8. Safe alternative: the middle of the range, 979.8.
| Trade card (short, futures) | Entry | Stop | Risk | Target | RRR | Outcome |
|---|---|---|---|---|---|---|
| Just inside the range | 925.45 | 943.8 | 18.35 (2.0%) | 857.7 | 3.69 | Gapped through the stop: 3 Feb 2026 opened at 983.75, a loss of 58.30 (−3.2R) |
| Middle of the range | 925.45 | 979.8 | 54.35 (5.9%) | 857.7 | 1.25 | Also gapped through on 3 Feb (−1.1R) |
On 3 Feb 2026 the whole market gapped up and HDFCBANK opened 6% higher, well above both stops. The trade lost more than three times its planned risk. Then the original idea came true anyway: the target was reached on 4 Mar and the stock fell to 726.65 by 30 Mar. Two lessons: a stop cannot protect you from a gap, so keep position sizes modest; and being stopped out does not mean the analysis was wrong, only that this trade was.
Bull flag: the breakout worked, the pole target did not
- Pole: 304.8 (8 May) → 389.9 (23 May 2025), +27.9% in 11 sessions.
- Flag: 18 sessions between 378.5 and 407.5. Average volume in the flag was 0.43× the pole's, the drying-up that Varsity describes.
- Breakout: 20 Jun 2025 close 408.25 on 5.56× volume.
- Pole target \( = 408.25 + (389.9 - 304.8) = 408.25 + 85.1 = 493.35 \). Stop: below the flag low, 378.5.
| Trade card (long) | Entry | Stop | Risk | Target | RRR | Outcome |
|---|---|---|---|---|---|---|
| Below the flag low | 408.25 | 378.5 | 29.75 (7.3%) | 493.35 | 2.86 | Stopped 29 Jul 2025 (−1R) |
The actual high was 436.0 (1 Jul 2025), only a third of the way to the target and just short of +1R (438.0), so not even a partial profit was booked. Then the stock faded through the flag low. A high RRR on paper is only a promise.
The flag that never flew
- Pole: 3,820.1 (7 Apr) → 5,165 (16 May 2025), +35.2%.
- The pause lasted 34 sessions (4,779–5,158), far longer than a flag's typical 5–15. A pause that drags on is a warning that the momentum has gone.
- Exit was through the bottom: close 4,651.7 on 18 Jul 2025, and the low reached 4,320 by 29 Aug.
| Trade card | Entry | Stop | Risk | Target | RRR | Outcome |
|---|---|---|---|---|---|---|
| Long (bull flag) | No trade: price never closed above the top of the pause. Waiting for the trigger kept you out of the slide to 4,320. | |||||
Bear flag: a pole down, a pause, then more selling
- Pole: 1,989.8 (17 Dec 2024) → 1,720.35 (31 Dec), −13.5% in 9 sessions.
- Flag: 6 sessions between 1,698.0 and 1,828.5. The bounce won back 40% of the pole, which is about as much as a flag should; more than half would cancel the pattern. Volume did not dry up (0.99× the pole's), a point against it.
- Break: 9 Jan 2025 close 1,673.95, below the flag low. Pole target \( = 1{,}673.95 - 269.45 = 1{,}404.5 \). Stop: above the flag high, 1,828.5.
| Trade card (short, futures) | Entry | Stop | Risk | Target | RRR | Outcome |
|---|---|---|---|---|---|---|
| Above the flag high | 1,673.95 | 1,828.5 | 154.55 (9.2%) | 1,404.5 | 1.74 | Target hit 27 Jan 2025 (gap open at 1,400) |
A bear flag is the bull flag turned upside down: the pole points down, the pause drifts up, and the break is through the bottom of the pause.
Pennant: a tiny triangle after a vertical pole
- Pole: 13,711.05 (4 Nov 2024) → 15,969.2 (8 Nov), +16.5% in four sessions.
- Pennant: 8 sessions with falling highs and rising lows, between 14,540 and 15,778. Volume averaged 0.54× the pole's.
- Break: 25 Nov 2024 close 15,724.8, 1.9% above the upper line (15,430.1), on 1.17× volume.
- Pole target \( = 15{,}724.8 + 2{,}258.15 = 17{,}982.95 \). Stop: below the pennant low, 14,540.
| Trade card (long) | Entry | Stop | Risk | Target | RRR | Outcome |
|---|---|---|---|---|---|---|
| Below the pennant low | 15,724.8 | 14,540 | 1,184.8 (7.5%) | 17,982.95 | 1.91 | Target hit 13 Dec 2024 |
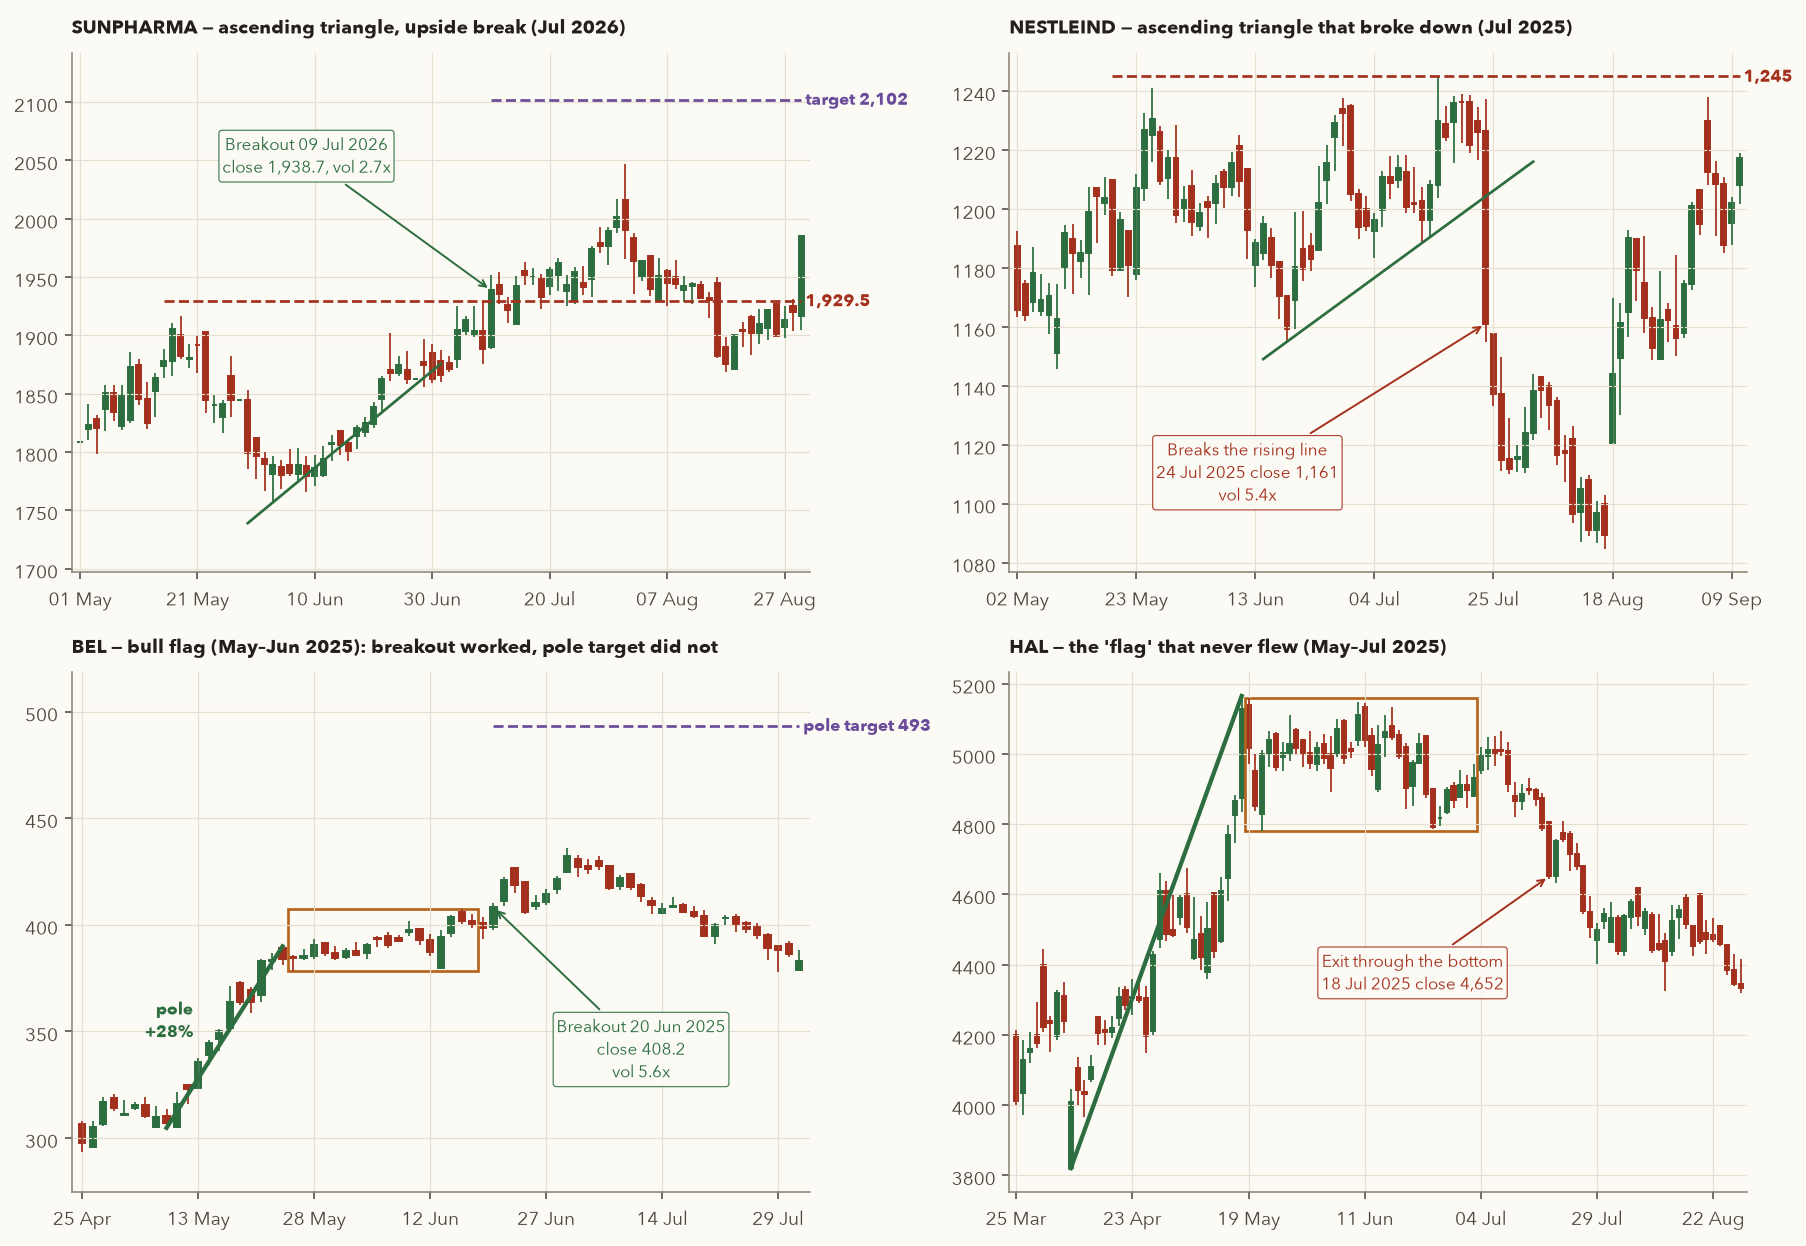
Ascending triangles. A strict scan (flat top within 1.2%, strictly rising lows, mid-2023 to 2026, course universe) found 17 ascending triangles. 11 broke upward first and 6 broke downward. About two in three went the "expected" way, which is useful but far from certain. That is why you wait for the break and use a stop.
Flags and pennants. A second scan (Jan 2024 – Sep 2026, 37 stocks) looked for a move of at least 12% within 12 sessions, followed by a pause of 4–15 sessions that gave back no more than half of it. Each one was traded with this section's recipe: entry on the first close beyond the pause, stop beyond its far side, target = pole length. Of 110 setups, 28 reached the target and 76 hit the stop first (6 were still open). That is a 27% hit rate. With a hit rate that low, winners must average about 2.7 times the losers just to break even. The median setup offered an RRR of 2.3, and the average result was −0.11R per closed trade before costs: a slow loss. Flags are popular because the winners are fast and dramatic, not because they usually work. Filters (volume drying up in the pause, a pause of 5–15 sessions, the higher-timeframe trend) and partial profits matter even more here.
9.4 Cup & handle (rounding base)
A cup is a rounded, U-shaped base. Sellers are gradually exhausted, then buyers gradually return. A handle is a small, shallow pullback near the right rim that shakes out the last weak holders before a breakout. It should stay in the upper half of the cup and usually lasts one to four weeks. Cups that are too deep (say more than about 35%) or V-shaped are less reliable. Target = cup depth added to the rim. The handle also matters for risk: its low gives a close, logical stop.
Cup with handle, from rim to target
- Left rim 186.94 (29 Oct 2025). Cup low 160.06 (9 Dec 2025), a depth of 26.88 (14.4%). Right rim 187.85 (6 Jan 2026), four weeks after the low, giving a rounded U.
- Handle: a 5-session pullback of 5.6% to 177.33 (9 Jan 2026), well inside the upper half of the cup.
- Breakout: 14 Jan 2026 close 189.25 above the higher rim (187.85), on 1.99× volume.
- Target \( = 187.85 + 26.88 = 214.73 \). Stop: below the handle low, 177.33.
| Trade card (long) | Entry | Stop | Risk | Target | RRR | Outcome |
|---|---|---|---|---|---|---|
| Below the handle low | 189.25 | 177.33 | 11.92 (6.3%) | 214.73 | 2.14 | Target hit 25 Feb 2026 |
Without the handle, the nearest logical stop would have been the cup low, 160.06, and the RRR would have been below 1. The NESTLEIND cup below shows exactly that.
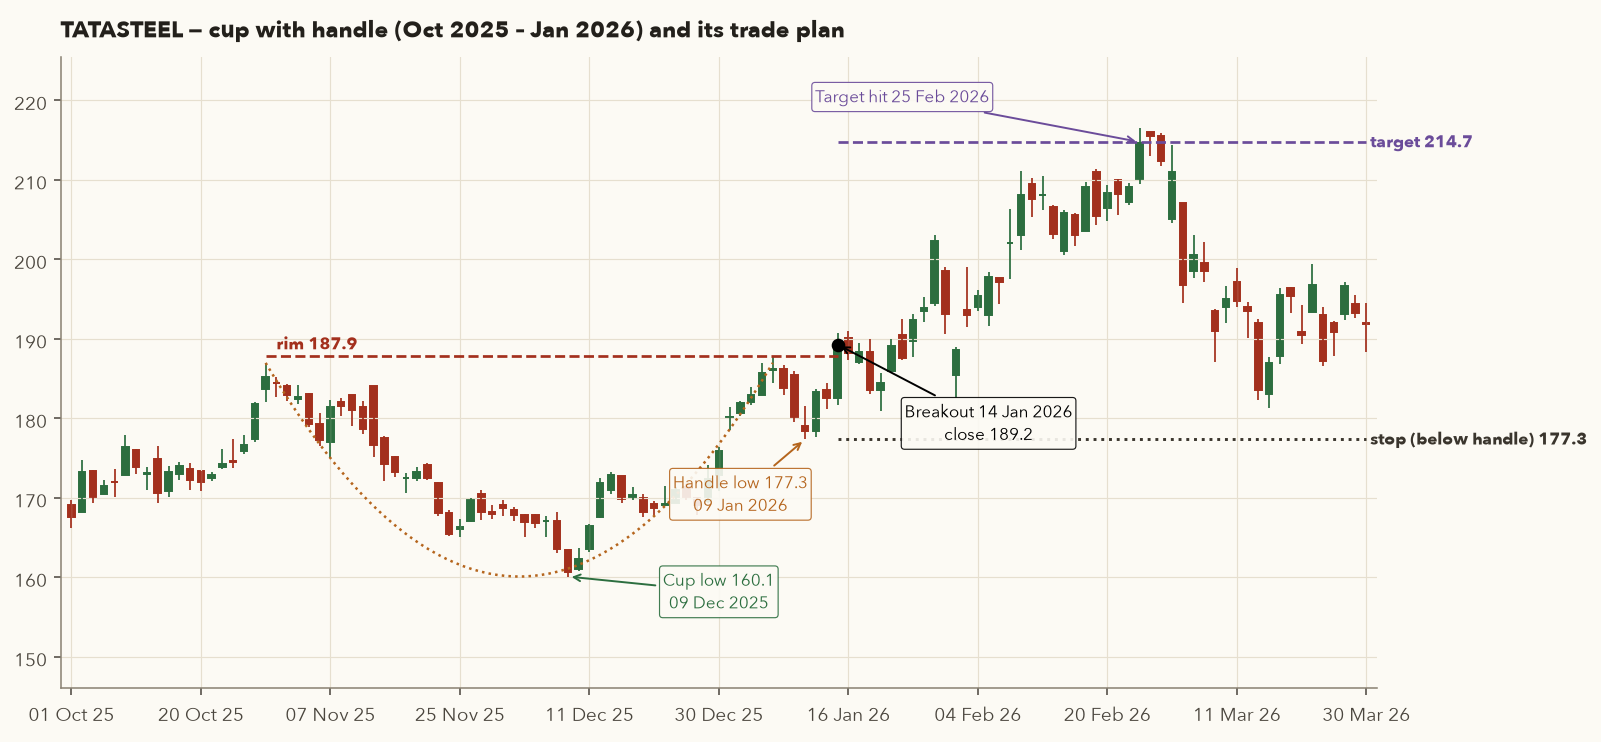
A cup without a proper handle
- Left rim 1,340.4 (3 Feb 2026), cup low 1,159.4 (2 Apr 2026), depth 181.0 (13.5%), a healthy, shallow base.
- No handle formed: price went straight through the rim. Breakout on 21 Apr 2026, close 1,379.9 on 6.84× volume.
- Target \( 1{,}340.4 + 181.0 = 1{,}521.4 \), reached on 30 Jul 2026, three months later and after a deep mid-course pullback to the 1,370s.
- By 30 Sep 2026 the stock had slipped back to 1,310, below the rim. A target being hit tells you nothing about the trade after it. Have an exit plan.
| Trade card (long) | Entry | Stop | Risk | Target | RRR | Outcome |
|---|---|---|---|---|---|---|
| Below the last swing low (the cup low) | 1,379.9 | 1,159.4 | 220.5 (16.0%) | 1,521.4 | 0.64 | Skip (RRR too low). Target was hit 30 Jul |
With no handle, the last swing low before the breakout was the bottom of the cup itself, 16% away. The setup fails the RRR test even though the target was eventually reached. A patient trader could have waited for a pullback after the breakout to form a closer stop, but that is a new setup, not this one.
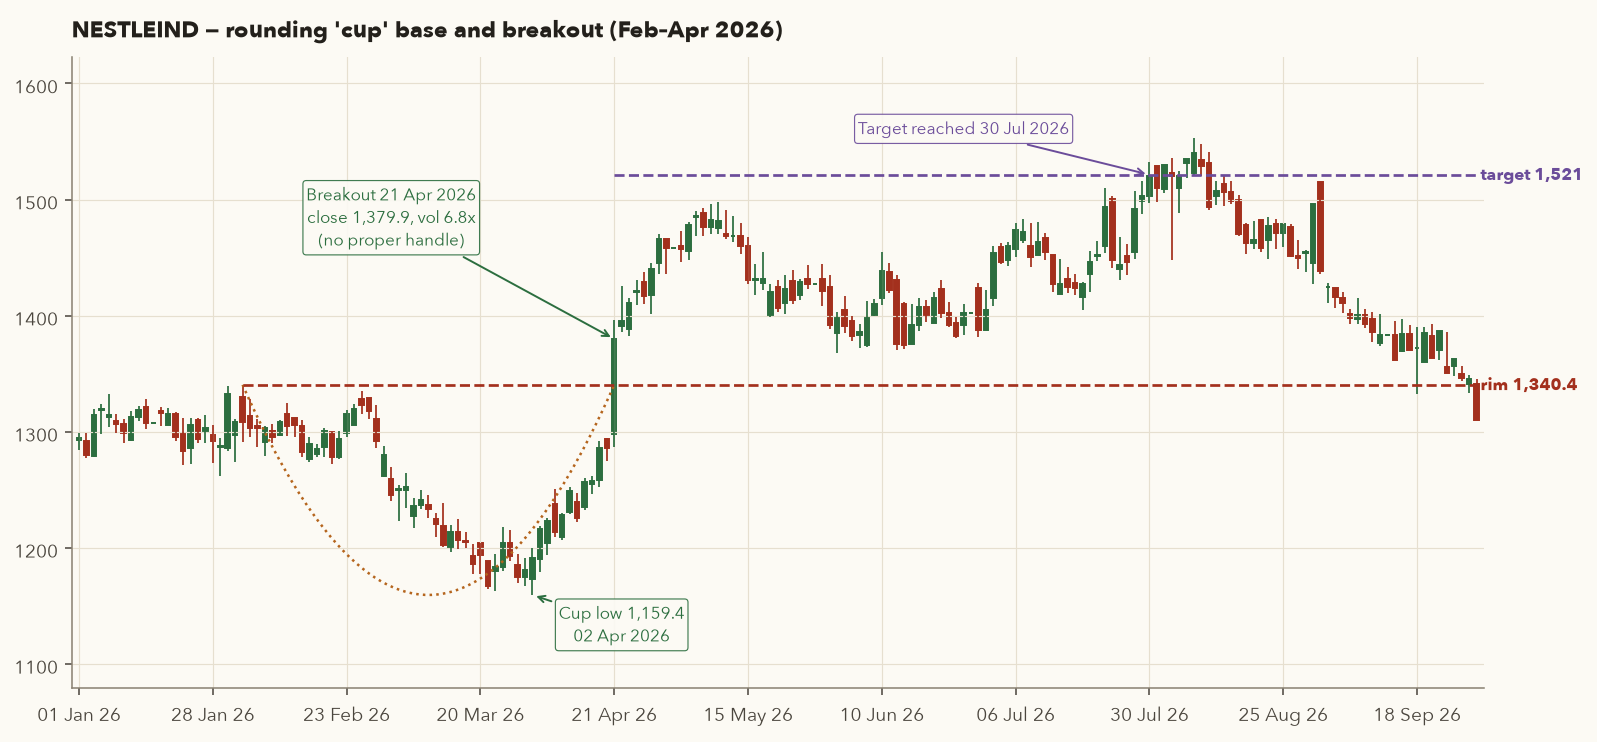
In your framework: framework.patterns.detect_candles(df) handles the candle patterns from Chapter 2; framework.risk.r_multiple and framework.risk.position_size(capital, risk_pct, entry, stop) turn any pattern's entry and stop into a position size. Every trade card in this section is rebuilt by course/scripts/ch03_pattern_trades.py.
10. Gaps
A gap is a price range where no trading happened between two consecutive sessions. Varsity's candlestick chapter illustrates the cause: a stock closes at ₹100, strong results come out overnight, and buyers are willing to pay ₹104 from the first trade, so nothing trades between 100 and 104. In India gaps form in the 9:00–9:15 pre-open auction.
- \(t\)
- The gap day. \(t-1\) is the trading session before it.
- \(\text{Low}_t, \text{High}_t\)
- The gap day's low and high, in ₹.
- \(\text{High}_{t-1}, \text{Low}_{t-1}\)
- The previous session's high and low, in ₹.
How it works: under this strict rule the gap day's whole range must sit above yesterday's high (gap up) or below yesterday's low (gap down), so nothing traded in between. A stock that opens above yesterday's close but then dips back into yesterday's range has not made a true gap. The gap is filled once price comes back to the far edge of the empty zone.
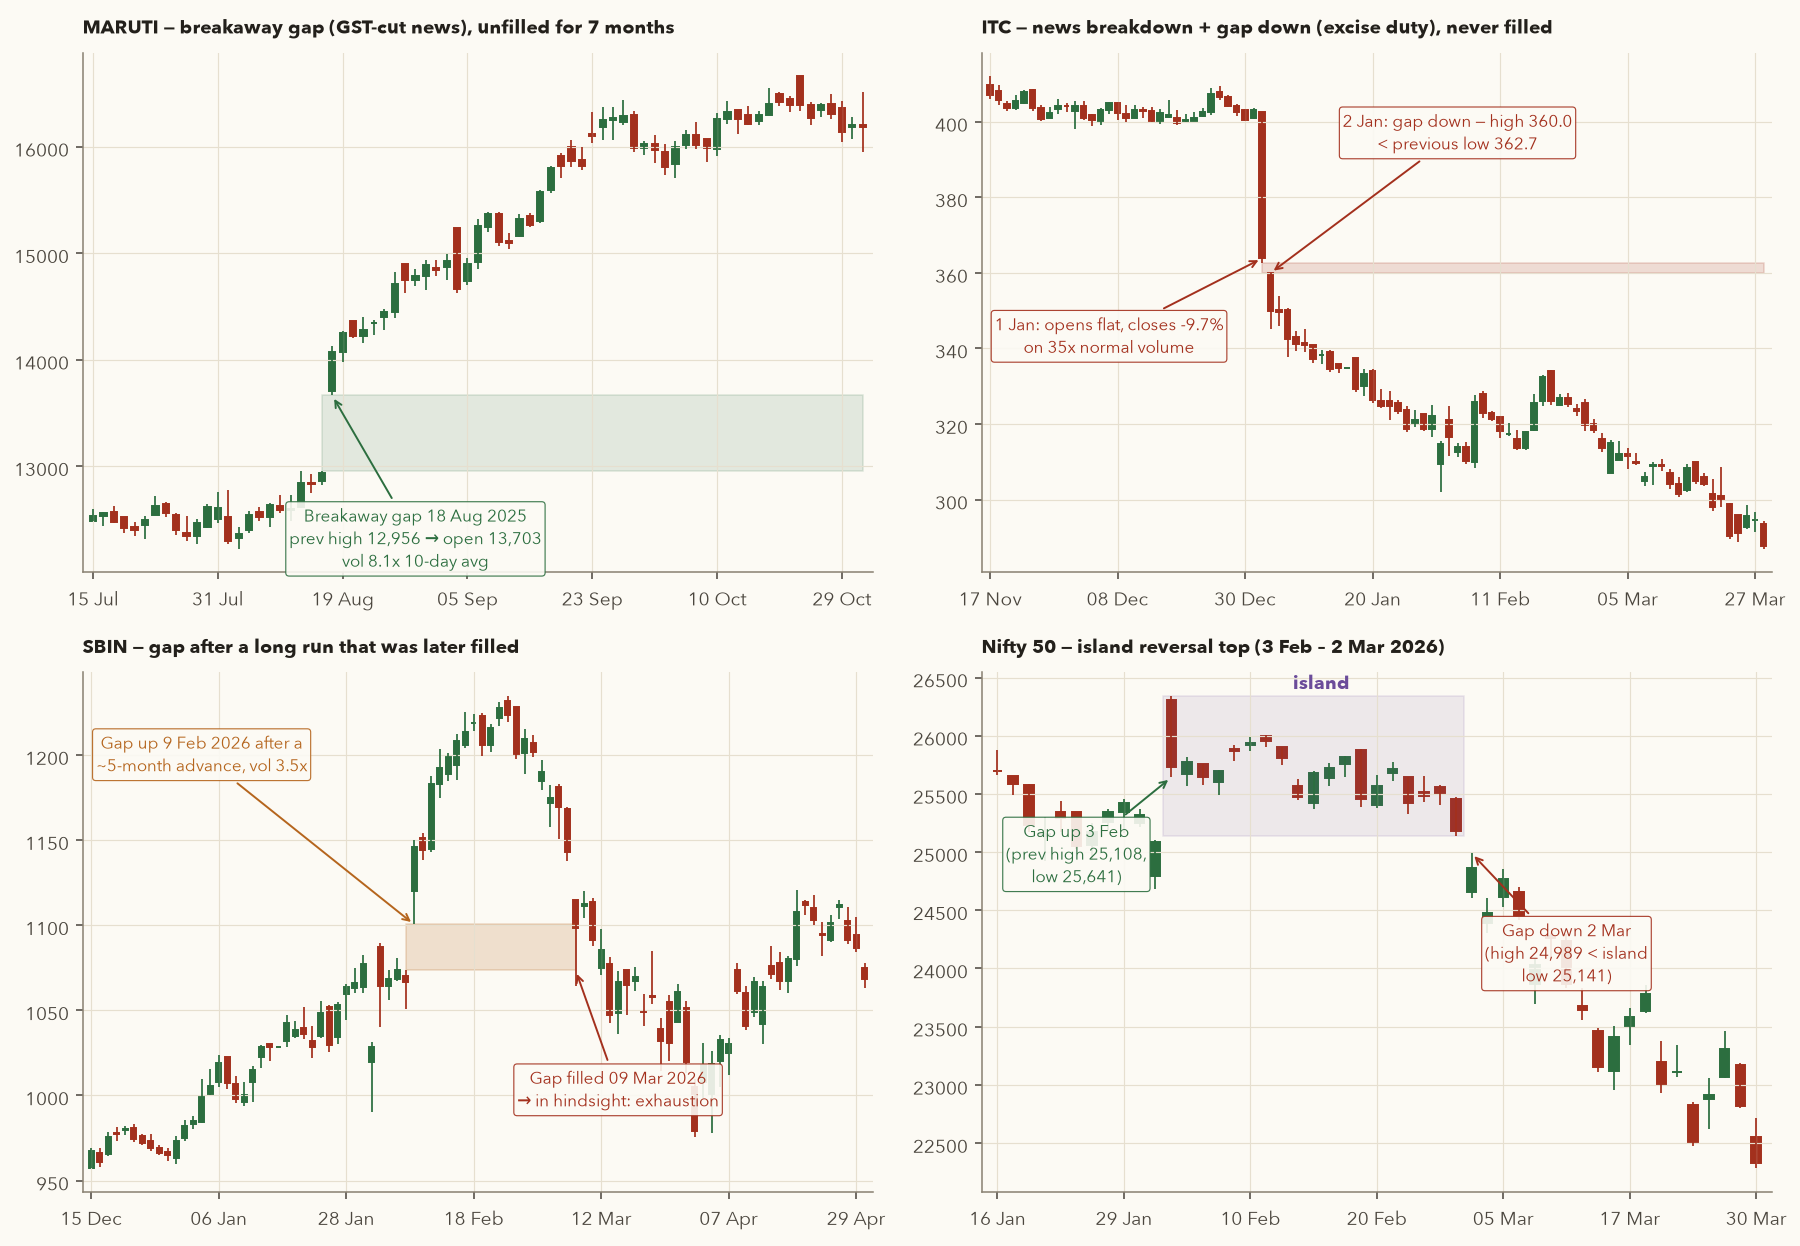
Example (MARUTI, 18 Aug 2025): the previous session's high was 12,956. On 18 Aug the low was 13,664, above 12,956, so it was a true gap up. It was filled on 13 Mar 2026, the first day the low fell back to 12,956 or below.
The four types (plus the island)
| Type | Where it appears | What it means | Usually filled? |
|---|---|---|---|
| Common | Inside a range, on ordinary news | Noise | Yes, usually within days |
| Breakaway | Leaving a range or base, often on big news and high volume | Start of a new move | Often not |
| Runaway (continuation) | Middle of a strong trend | Trend accelerating; roughly marks the halfway point | Often not |
| Exhaustion | Late in a long trend, climactic volume | Last burst; trend tiring | Yes, usually quickly |
| Island reversal | A cluster of bars cut off by a gap on both sides | Sharp reversal; everyone inside the island is trapped | n/a |
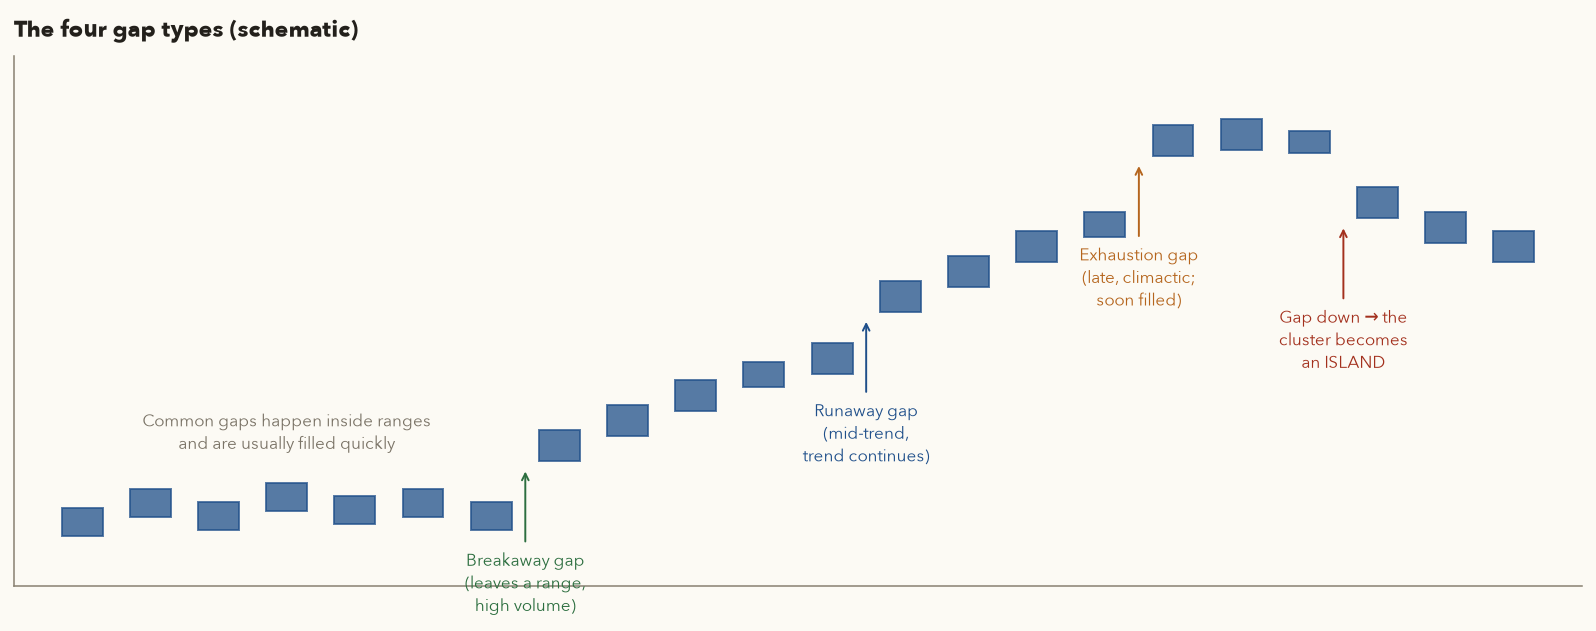
Classifying four real gaps
- MARUTI, 18 Aug 2025: breakaway. After the government's GST-rate-cut announcement around Independence Day, MARUTI opened at 13,703 against a prior high of 12,956 (+5.9% vs the prior close of 12,936) on 8.07× normal volume. The stock left a two-month range. Over the next two months its lowest price was the gap-day low of 13,664, so the gap held, and the stock reached 16,660 by 23 Oct 2025. The gap stayed open for seven months; it was finally filled on 13 Mar 2026 during the broad market sell-off. "Not filled" is always "not filled yet".
- ITC, 1–2 Jan 2026: news breakdown + gap down. On 1 Jan the government notified a new excise duty on cigarettes. ITC opened flat (402.7) and closed at 363.85, −9.7% on 35× its normal volume. On 2 Jan a true gap followed: the day's high of 360.0 was below the previous low of 362.7. The highest price after that (to Sep 2026) was 353.95, so the gap was never filled. The stock closed Sep 2026 at 262.75.
- SBIN, 9 Feb 2026: looked like a breakaway, turned out to be exhaustion. After a five-month advance, SBIN gapped from a prior high of 1,073.6 to an open of 1,120 on 3.51× volume, and peaked at 1,234.7 two weeks later. The gap was filled on 9 Mar 2026. Only the fill reveals the type. In real time you cannot know, which is why you place a stop below the gap.
- Nifty 50, 3 Feb – 2 Mar 2026: island reversal top. On 3 Feb the index gapped up (low 25,641.3 vs prior high 25,108.1) and spent 19 sessions between 25,141 and 26,341. On 2 Mar it gapped down (high 24,989.35 below the island's low). Everyone who bought in February was trapped above the market. The index reached 22,283.85 by 30 Mar.
A popular saying, but no. Across 35 stocks in the course data, we found 82 true gaps of at least 2% from Jan 2025 onward (each followed by at least 60 sessions of data). 64.6% were filled within 60 sessions (gap-ups 66.0% of 50; gap-downs 62.5% of 32). So roughly one in three big gaps was not filled within three months, and those were usually the important breakaway gaps. Fading every gap is a bad strategy.
Overnight gaps jump straight over your stop. HDFCBANK closed at 843.05 on 18 Mar 2026 (low 831.6). A trader long with a stop-loss at 825, just below that low, planned to risk about ₹18 a share. On 19 Mar the stock opened at 770.0 (−8.7%), so a stop-loss market order triggered at the open filled near 770, a loss of about ₹73 a share, four times the plan. A stop-loss limit order might not have filled at all. Compare ITC on 1 Jan 2026: it opened flat at 402.7 and fell during the session, so a resting stop at 395 would have filled close to 395, while a trader who only checked prices after the close saw 363.85. A stop-loss order protects you only while the market is trading, and only at prices that actually trade. This is why positions held overnight, especially leveraged futures, must be sized for a gap through the stop (Chapters 9 and 11).
11. Fibonacci retracements
The numbers
The Fibonacci sequence (known in ancient Indian mathematics, popularised in Europe by Leonardo of Pisa) starts 0, 1, 1, 2, 3, 5, 8, 13, 21, 34, 55, 89, 144 … and each number is the sum of the two before it. Ratios between its terms converge to a few constants:
- \(F_n\)
- The \(n\)-th number in the Fibonacci sequence (for example 89).
- \(F_{n+1}, F_{n+2}, F_{n+3}\)
- The numbers one, two and three places further along (144, 233, 377 after 89).
- \(\to\)
- "Gets closer and closer to" as you go further along the sequence.
How it works: divide a Fibonacci number by the next one and the answer settles near 0.618. Divide by the number two places on and you get about 0.382; three places on gives about 0.236. With small numbers the ratios are rough; from around 89 and 144 onwards they match to three decimals.
Traders add 50% (not a Fibonacci ratio, but a natural "half-back" level) and often 78.6% (the square root of 0.618).
How to draw and compute
- Pick the most recent clear swing: trough to peak for an uptrend, peak to trough for a downtrend.
- Compute the retracement levels:
- High, Low
- The swing's highest and lowest prices, in ₹ or points.
- High − Low
- The size of the swing.
- \(r\)
- The retracement ratio: the fraction of the swing that price gives back. "\(\in\)" means "is one of", so \(r\) takes each of the five values in turn.
- \(L_r\)
- The price level for ratio \(r\) (for example \(L_{0.618}\) is the 61.8% level).
How it works: multiply the swing size by each ratio. In an uptrend, subtract the answer from the high to get the levels where a pullback might find support. In a downtrend, add it to the low to get the levels where a bounce might meet resistance. The 50% level is simply halfway.
Why it might work
Varsity is candid: nobody has proved why these levels should matter. The most plausible reason is self-fulfilment. Millions of traders and algorithms watch the same levels, so orders cluster there. The levels also land where a healthy pullback tends to end anyway (a third to two-thirds of the prior move). Varsity's advice is to use Fibonacci as confirmation for a trade that already passes the other checklist items, not as a reason on its own.
A bounce that died at exactly 61.8%
- Swing: high 26,373.2 (5 Jan 2026) → low 22,182.55 (2 Apr 2026). Move \( = 4{,}190.65 \).
- Levels (downtrend, so measured up from the low): 23.6% = 22,182.55 + 0.236 × 4,190.65 = 23,171.5; 38.2% = 23,783.4; 50% = 24,277.9; 61.8% = 22,182.55 + 2,589.82 = 24,772.4; 78.6% = 25,476.4.
- First bounce peak: 24,601.7 (21 Apr) → \( (24{,}601.7 - 22{,}182.55)/4{,}190.65 = 57.7\% \).
- Second bounce peak: 24,774.3 (3 Aug) → \( 2{,}591.75/4{,}190.65 = 61.85\% \). It turned within two points of the 61.8% level, which sat just 0.4% above the old support zone of 24,338–24,679 (Section 5). Two tools agreed.
- Outcome: the index fell to 22,620 by 30 Sep 2026, about 3,750 points (14%) below the 5 Jan high.
Where might a pullback find support?
- Swing: low 3,962.8 (11 Jun 2026) → high 5,186.7 (27 Aug 2026). Move = 1,223.9.
- Levels (uptrend, measured down from the high): 23.6% = 4,897.9; 38.2% = 5,186.7 − 467.5 = 4,719.2; 50% = 5,186.7 − 611.95 = 4,574.8; 61.8% = 5,186.7 − 756.4 = 4,430.3; 78.6% = 4,224.7.
- The 30 Sep 2026 close of 4,587 is a 49.0% retracement, sitting right on the 50% level. Whether that level holds was unknown at the data cut-off, which is a realistic picture of what you face every day. A Fibonacci level is a place to watch for a bullish signal and volume (the checklist), not a reason to buy blindly.
Every level ignored
- Swing: 6,663 (27 Jan) → 8,722 (27 Feb 2026). Move = 2,059.
- The pullback sliced through 23.6% (8,236), 38.2% (7,935), 50% (7,692), 61.8% (7,450) and 78.6% (7,104), reaching 6,690.5 on 2 Apr: a 98.7% retracement.
- Then the stock rallied to 10,126 by 22 Jun. Someone who bought at 61.8% without a stop sat through a further 10% fall. Someone who bought at 61.8% with a stop below it took a small loss and could re-enter later when the structure improved.
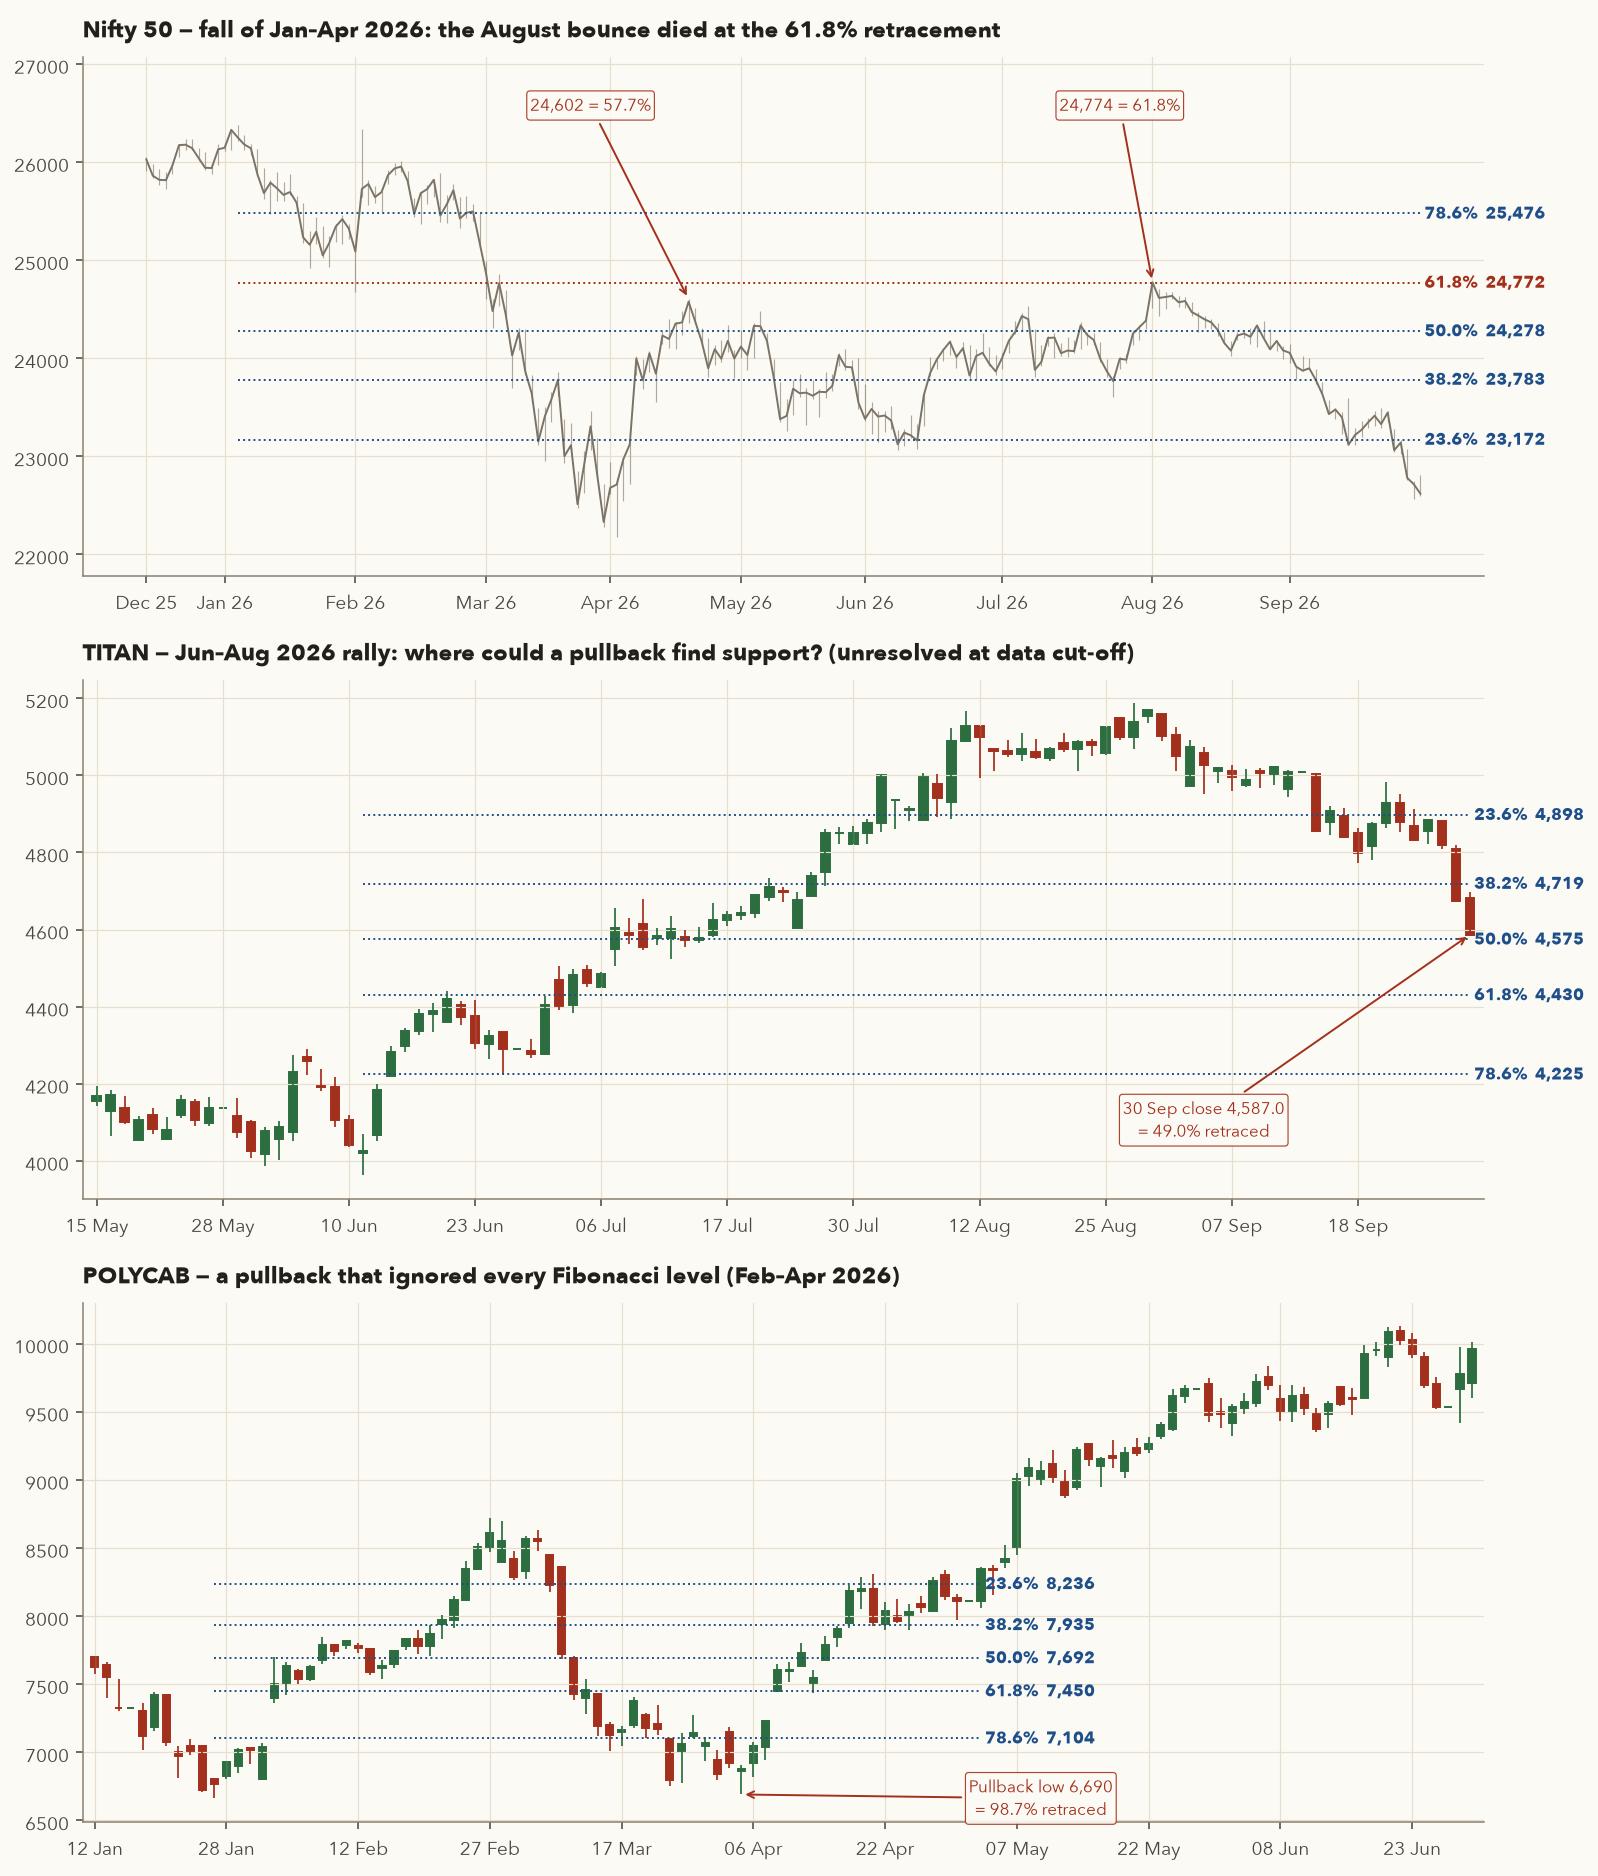
- Choosing the swing after the fact so that a level "worked". Decide on the swing before price gets there.
- Drawing five levels and claiming success whenever price stops near any of them. With five levels, something is always nearby. Confluence with S&R and a confirming candle is what adds value.
- No stop. Varsity places the stop just beyond the Fibonacci level, or the S&R that coincides with it.
12. 52-week highs and lows
The 52-week high and low are the highest and lowest prices of the past year (about 252 trading sessions). Exchanges, brokers and media publish lists of stocks making new 52-week highs and lows every day, which makes these levels very widely watched.
Why they matter
- At a new 52-week high there is no overhead supply. Everyone who bought in the past year is in profit, so there is no "get me out at break-even" crowd. That is the bullish argument behind momentum strategies.
- Anchoring works the other way: many investors feel a stock is "too expensive" near its high and hesitate. When good news finally pushes it through, the late buyers can fuel a move.
- New 52-week lows show that every buyer of the last year is underwater. That supply caps rallies, which is why "buying because it's cheap" often catches a falling knife (ITC in 2026 kept making new lows: 403 → 262.75).
- \(t\)
- The day being checked.
- \(\text{Close}_t\)
- The close on day \(t\), in ₹.
- \(\text{High}_{t-252}, \dots, \text{High}_{t-1}\)
- The daily highs of the 252 sessions before day \(t\), about one year of trading. Day \(t\) itself is not included.
- \(\max(\dots)\)
- The largest of those highs: the prior 52-week high.
- first occurrence …
- A day counts as a new event only if the previous qualifying day was at least 20 sessions earlier, so a stock that makes new highs every day for a month is counted once, not twenty times.
How it works: compare today's close with the highest high of the past year. If the close is above it, the stock has closed at a new 52-week high. Using the close, not the intraday high, means a brief spike that fades before the close does not count. New 52-week lows in the table below use the mirror rule: a close below the lowest low of the previous 252 sessions.
A 52-week high that kept going
- On 14 May 2026 ADANIENT closed at 2,712.9, above its prior 52-week high of 2,695. That was its first close above the 52-week high set on 23 Sep 2025, and it came on the same day as the high-volume role-reversal thrust in Section 5.
- It reached 3,245 on 6 Jul 2026 (+19.6% from that close) and closed Sep 2026 at 2,903.4.
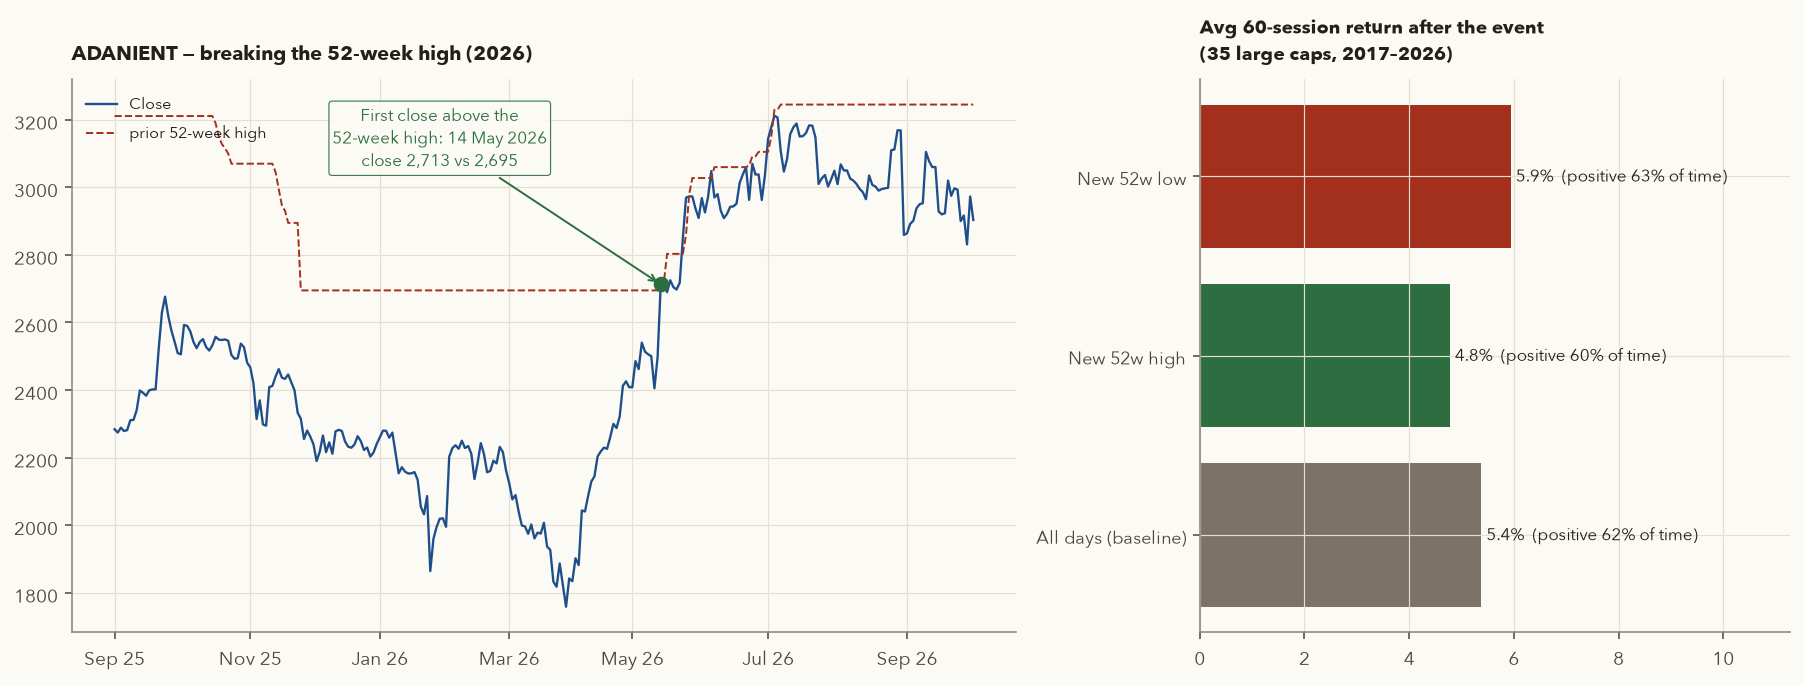
| Event (35 large caps, 2017–2026) | Events | Avg 20-session return | % positive | Avg 60-session return | % positive |
|---|---|---|---|---|---|
| All days (baseline) | 73,153 | 1.72% | 56.8% | 5.38% | 61.8% |
| First close at a new 52-week high | 497 | 1.83% | 57.6% | 4.77% | 59.9% |
| First close at a new 52-week low | 132 | 0.54% | 55.3% | 5.94% | 63.3% |
Honest reading. In this small, survivorship-biased large-cap sample, buying the first new 52-week-high close had no meaningful edge over buying on any random day. It was slightly better over 20 sessions and slightly worse over 60. New lows lagged over 20 sessions but caught up later. Large academic studies on broader universes do find a modest momentum effect, but this data says a 52-week high is context, not a signal. It is most useful as one item on the checklist: trade breakouts to new highs that also have a base, volume, an acceptable RRR and a supportive market trend. Chapter 12 tests a complete 52-week breakout system with costs.
13. Multi-timeframe analysis: weekly trend, daily entry
Varsity's TradingView chapter recommends viewing several timeframes side by side. For a swing or positional trader the standard pairing is:
- Weekly chart = direction. What is the primary trend (Dow)? Are weekly highs and lows rising? Is price above a rising long average (e.g. 30 weeks ≈ 150 days; moving averages are covered in Chapter 4)?
- Daily chart = timing. Wait for a pullback (secondary trend) to stop, ideally at support, a Fibonacci level or a rising trendline. Then enter on a sign that buyers are back: a bullish candle pattern, or a close above the previous few days' highs.
The logic: the weekly chart sets the odds and the daily chart sets the risk. Buying daily dips in a weekly uptrend means you trade with the institutional flow, and the dip gives you a nearby, well-defined stop.
A complete multi-timeframe trade plan
- Weekly check (June 2026): higher highs (4,312 → 4,378 → 4,605) and higher lows since Apr 2025, and price above a rising 30-week average. The primary trend is up.
- Daily pullback: from 4,605 (8 May 2026) to 3,962.8 (11 Jun 2026), a 13.9% secondary decline. The low held above the March swing low of 3,825, so it is a higher low and the weekly structure is intact.
- Trigger rule (decided in advance): the first close above the highs of the prior two sessions. On 12 Jun 2026 TITAN closed at 4,184.0, above 4,119.1 (the 10–11 Jun highs).
- Stop: just below the pullback low, 3,962.8 × 0.997 = 3,950.9. Risk per share = 4,184.0 − 3,950.9 = 233.1.
- First target: the prior high of 4,605 (resistance). Reward = 421.0, so RRR = 421.0 / 233.1 = 1.81. That passes Varsity's 1.5 minimum.
- Position size (₹5,00,000 account, 1% risk = ₹5,000): shares = ⌊5,000 / 233.1⌋ = 21; position value = 21 × 4,184 = ₹87,864.
- Outcome: 4,605 was reached on 7 Jul 2026. By 14 Aug the high was 5,168. Measured in R (multiples of the initial risk per share), that is \( (5{,}168 - 4{,}184)/233.1 = 4.2R \). No trailing stop sells at the exact high, but a trader who trailed part of the position instead of exiting everything at 4,605 kept a good share of that extra move.
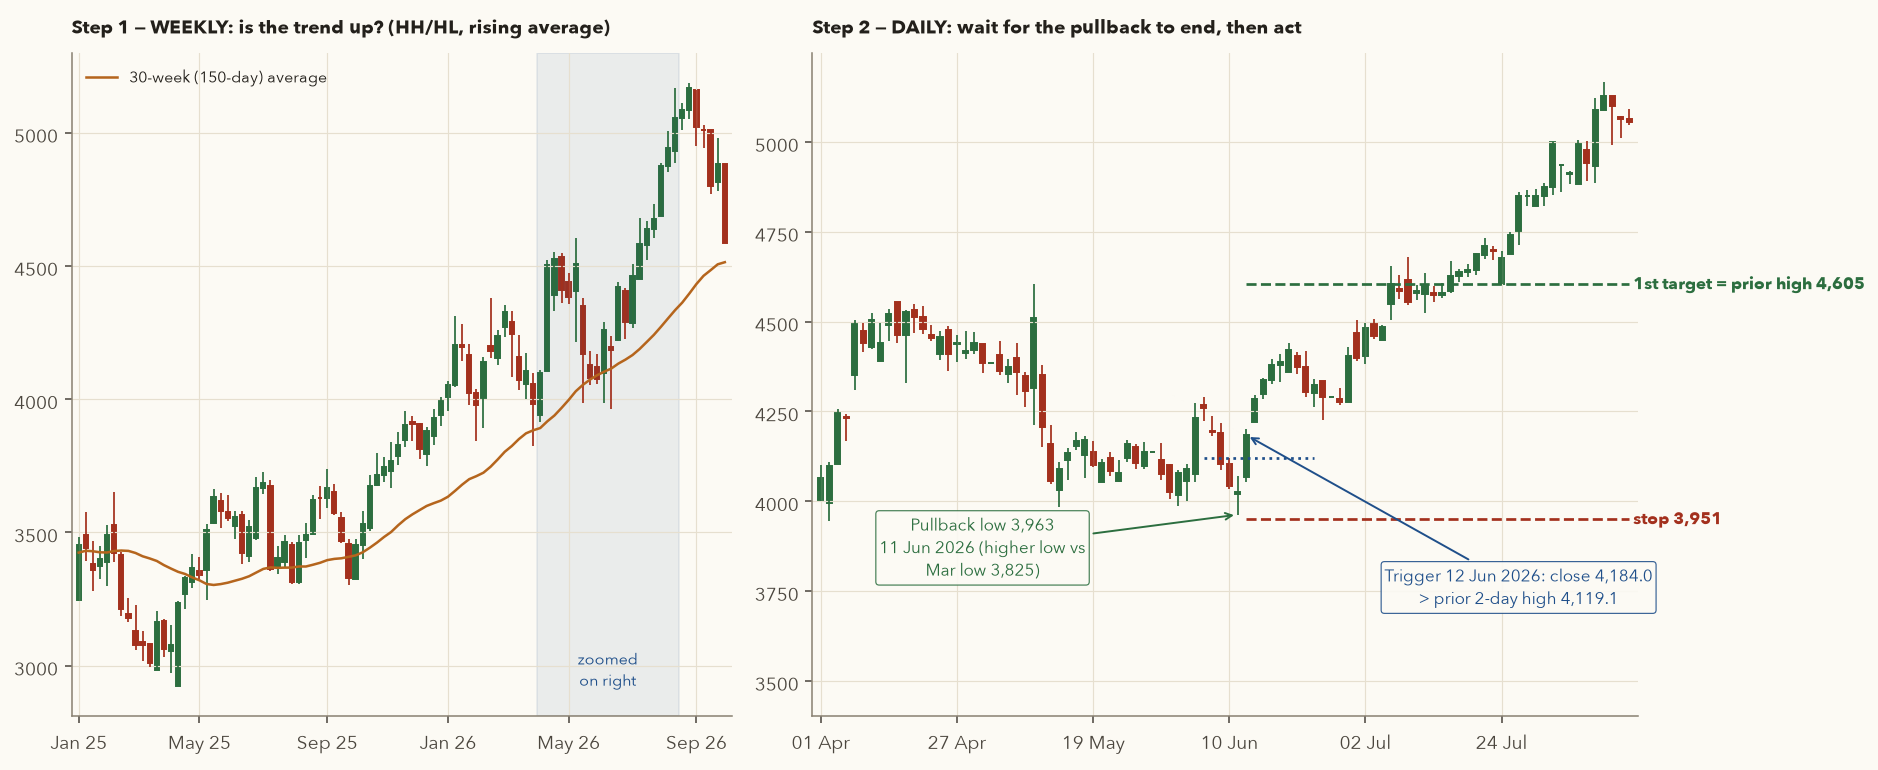
- Use a ratio of about 4–5 between timeframes: weekly → daily for swing or positional trades, monthly → weekly for long-term investing.
- Never take a daily long against a weekly downtrend unless you deliberately accept a counter-trend trade (smaller size, quicker exit; Varsity's caution in Section 8).
- Draw S&R on the higher timeframe. Weekly levels outrank daily ones.
14. The technical-analysis checklist (Varsity, adapted)
Varsity ends its technical-analysis module with a checklist that combines everything: candlesticks (Chapter 2), S&R, volume, Dow Theory, indicators (Chapter 4) and RRR. Here it is adapted for a swing or positional trader who also uses the material in this chapter. Varsity's scouting routine is to shortlist from a liquid universe (it suggests Nifty 50 stocks for beginners), look at the last 3–4 candles for a recognisable pattern, then spend 15–20 minutes per shortlisted chart on the full list. It also says that deciding not to trade is itself a trading decision. Many days will give you nothing, and that is fine.
- Liquidity: liquid stock (tight bid-ask, several lakh shares a day; Nifty 50/100 names to start). Avoid operator-driven stocks.
- Higher-timeframe trend (Dow): weekly HH/HL for longs (LH/LL for shorts). Know whether you are trading with the primary trend or a secondary one.
- Setup: a recognisable candlestick pattern in the last 3–4 sessions or a confirmed chart pattern (neckline or boundary close).
- Prior trend fits the pattern: bullish reversal patterns need a preceding decline; bearish ones need a preceding rise.
- Volume: signal-day volume at or above the 10-day average; breakouts ideally well above it.
- S&R alignment: for a long, the pattern low/stop sits at or just below support (for a short, the high/stop at or just above resistance). Varsity's limit: S&R within ~4% of the pattern stop, otherwise drop it.
- Room to run: the next resistance (for a long) is far enough away. Check old highs, round numbers, gaps and 52-week levels.
- Confluence (optional bonus): a Fibonacci level, trendline or role-reversal zone agrees with your entry or stop.
- RRR: at least 1.5 for swing trades, measured to the first realistic target (S&R or measured move, whichever is nearer).
- Indicators (Chapter 4): if RSI or MACD agree, you may size normally or slightly larger; if they disagree, size down or skip. Indicators confirm; they do not originate trades.
- Event check: results, budget, policy or index-rebalance dates inside your holding period mean gap risk (Section 10).
- Position size: risk per trade ≤ 1% of capital, computed from entry − stop (Chapter 11).
- Execution discipline: place the stop as soon as you enter; do nothing until target or stop, except trail the stop or book a partial profit you planned in advance; record the trade in your journal.
Do the analysis after the close, using end-of-day charts. Shortlist in the evening and act the next day. For CAS stocks, remember that continuous trading now ends at 3:15 pm. You cannot rush through 50 charts in the last half hour.
15. Try it yourself
These snippets need a copy of the course repository and Python with pandas and numpy (setup steps are in its framework/README.md). Run them from the repository's root folder, for example with .venv/bin/python, because the file paths are relative to that folder. Each reproduces a calculation from this chapter on the course data. The full figure script is course/scripts/ch03_figures.py; it prints every number quoted above.
(a) Find swing highs and lows and test the trend
import pandas as pd
df = pd.read_csv("data/ohlc/TITAN.csv",
                 index_col=0, parse_dates=True).loc["2025-03-01":]
k = 10                                   # a swing high = highest high of the 10 bars either side
hi = df.High[(df.High == df.High.rolling(2*k+1, center=True).max())]
lo = df.Low[(df.Low == df.Low.rolling(2*k+1, center=True).min())]
print("Swing highs:\n", hi.round(1).tail(6))
print("Swing lows:\n", lo.round(1).tail(6))
print("Last two highs rising?", hi.iloc[-1] > hi.iloc[-2], "| last two lows rising?", lo.iloc[-1] > lo.iloc[-2])
With k = 10 this finds a minor swing low at 3,985.1 (13 May 2026) just above the 3,962.8 low (11 Jun), so "lows rising" prints False even though the bigger structure is up. Try k = 5 and k = 20 and see how the answer depends on swing size. That is why you fix the parameter before you look.
(b) Varsity's S&R test: enough well-spaced touches?
import pandas as pd
df = pd.read_csv("data/ohlc/KOTAKBANK.csv",
                 index_col=0, parse_dates=True).loc["2025-03-01":"2026-02-27"]   # ~12 months
level, tol = 446.0, 0.015                     # candidate resistance and a +/-1.5% zone
k = 6
swing_hi = df.High[df.High == df.High.rolling(2*k+1, center=True).max()]
touches = swing_hi[(swing_hi - level).abs() <= level * tol]
spaced = [touches.index[0]]
for t in touches.index[1:]:
    if (t - spaced[-1]).days >= 28:          # this chapter's spacing rule (~4 weeks)
        spaced.append(t)
print(touches.round(1))
print("Well-spaced touches:", len(spaced), "->", "valid S/R" if len(spaced) >= 3 else "not yet")
(c) Volume ratio and Varsity's volume-price table
import pandas as pd
df = pd.read_csv("data/ohlc/HDFCAMC.csv",
                 index_col=0, parse_dates=True)
df["vol10"] = df.Volume.rolling(10).mean().shift(1)     # average of the PREVIOUS 10 sessions
df["vol_ratio"] = df.Volume / df.vol10
df["price"] = df.Close.diff().apply(lambda x: "up" if x > 0 else "down")
df["volume"] = (df.vol_ratio > 1).map({True: "high", False: "low"})
table = {("up", "high"): "bullish", ("up", "low"): "caution (weak rally)",
         ("down", "high"): "bearish", ("down", "low"): "caution (weak fall)"}
df["read"] = [table[(p, v)] for p, v in zip(df.price, df.volume)]
print(df.loc["2025-10-27":"2025-10-31", ["Close", "Volume", "vol10", "vol_ratio", "read"]].round(2))
Expected: 29 Oct 2025 shows a ratio of 4.11 and "bearish".
(d) Fibonacci levels
def fib_levels(low, high, trend="up"):
    """Retracement levels of the move low->high (trend='up') or high->low (trend='down')."""
    move = high - low
    out = {}
    for r in (0.236, 0.382, 0.5, 0.618, 0.786):
        out[f"{r:.1%}"] = round(high - r * move, 1) if trend == "up" else round(low + r * move, 1)
    return out

print("Nifty fall 5 Jan -> 2 Apr 2026:", fib_levels(22182.55, 26373.2, trend="down"))
print("TITAN rally 11 Jun -> 27 Aug 2026:", fib_levels(3962.8, 5186.7, trend="up"))
(e) Measured-move target, RRR, and a 52-week-high scan
import os, pandas as pd
def measured_target(pattern_high, pattern_low, breakout_level, direction):
    """Minimum target = breakout level +/- pattern height."""
    h = pattern_high - pattern_low
    return breakout_level + h if direction == "up" else breakout_level - h

def rrr(entry, stop, target):
    return (target - entry) / (entry - stop)

print("HDFCAMC triple top target:", measured_target(2967.25, 2715.25, 2715.25, "down"))   # 2463.25
print("DIXON triple bottom target:", measured_target(11847, 9600, 11847, "up"))           # 14094
print("TITAN Jun-2026 setup RRR:", round(rrr(4184.0, 3950.9, 4605.0), 2))                  # 1.81

D = "data/ohlc/"
rows = []
for f in sorted(os.listdir(D)):
    df = pd.read_csv(D + f, index_col=0, parse_dates=True)
    hi52 = df.High.iloc[-252:].max(); lo52 = df.Low.iloc[-252:].min()
    rows.append((f[:-4], df.Close.iloc[-1], round((df.Close.iloc[-1] / hi52 - 1) * 100, 1),
                 round((df.Close.iloc[-1] / lo52 - 1) * 100, 1)))
t = pd.DataFrame(rows, columns=["symbol", "close", "% from 52w high", "% above 52w low"])
print(t.sort_values("% from 52w high", ascending=False).head(5).to_string(index=False))
On the 30 Sep 2026 data, even the instrument closest to its high (KOTAKBANK) was 8% below it. No instrument in the universe was near a 52-week high at the cut-off, which is consistent with the weak index structure in Section 4.
In your framework: these snippets become framework.indicators.pivots, framework.patterns.support_resistance, framework.risk.position_size and framework.strategies.breakout_52w. python -m framework.scan will run the daily checklist across the universe (Chapter 17).
16. Key takeaways
- A trend is a sequence of swings: HH/HL is up and LH/LL is down. It stays valid until price closes beyond the last opposing swing. Fix your swing-size rule before you look.
- Support and resistance are zones built from at least 3 well-spaced touches (Varsity: 12–18 months of data for swing trades, touches well spaced in time; this chapter uses ≥4 weeks). They work through memory, large-player supply and demand, and self-fulfilment, which makes them probabilities, not certainties.
- Broken resistance tends to become support and vice versa (ADANIENT 2026, Nifty 2026), but expect shake-outs through the zone.
- A real breakout needs a close beyond the level, volume above average and follow-through over 3–4 sessions. Even then, use a stop (POLYCAB Feb 2026).
- Volume matters most at decision points. In 81,524 stock-days, the volume-price table did not predict ordinary days, but heavy-volume big down days were followed by clearly weaker returns.
- Dow Theory: primary, secondary and minor trends; accumulation, markup, distribution and markdown; indices and volume must confirm; closes count most. The Feb 2026 non-confirmation preceded a 15–19% fall.
- Patterns are confirmed at the neckline or boundary. Plan every pattern with the same trade card: entry on the confirming close, a stop where the pattern is proven wrong (halfway back for tops and bottoms, beyond the right shoulder, the last swing or the flag), target = pattern height projected from the breakout, and an RRR of at least 1.5. Measured targets were fully reached only about 35–45% of the time in our scan (27% for flags and pennants), so take partial profits and trail.
- Gaps: about 65% of 2%+ gaps filled within 60 sessions, but the ones that stayed open (MARUTI for seven months, ITC still open) were the important ones. Gaps also jump over stop orders.
- Fibonacci (23.6/38.2/50/61.8%) is a confirmation tool: Nifty's Aug-2026 bounce stopped at 61.85%, while POLYCAB ignored every level.
- A 52-week high is context, not a signal, in our large-cap test. Combine it with a base, volume and RRR.
- Weekly chart for direction, daily chart for timing. Plan entry, stop, target, RRR (≥1.5) and size (≤1% risk) before you trade.
17. Quiz and exercises
Q1. A stock's last swing highs were 520, 548, 561 and its last swing lows 480, 505, 499. Is it in an uptrend?
Q2. A rising trendline passes through 798.5 (session 0) and 944.45 (session 66). What is its value at session 110?
Q3. Using Varsity's method, you find swing highs at 1,212 (Jan), 1,198 (Feb, 3 weeks after Jan), 1,205 (Jun) and 1,215 (Sep). Price is now 1,150. Is there valid resistance, and where?
Q4. Today's volume is 3.2 mn shares; the previous 10 sessions averaged 2.0 mn. Price fell 2.5%. What does Varsity's table say, and what did our 10-year test add?
Q5. Resistance at ₹500 (three touches over five months), support at ₹440. Today the stock closes at 503 on 0.9× its 10-day average volume. Is this a valid breakout? Suppose instead it closes at 512 on 2.4× volume and stays above 500 for the next three sessions. What are the range target and the RRR for an entry at 512 with a stop at 494?
Q6. A double bottom has lows of 412 and 418 and a neckline of 455. Price closes at 461 on 2.1× volume. Compute the target, a sensible stop and the RRR for an entry at 461.
Q7. Head 1,102.5; neckline value under the head 975.36; neckline value on the break day 987.5. What is the H&S target? Why did a stop at 995 fail in this real case?
Q8. Nifty fell from 26,373.2 to 22,182.55. Compute the 38.2%, 50% and 61.8% retracement levels for the bounce.
Q9. Classify these gaps: (a) a 6% gap up out of a 2-month range on 8× volume that stays unfilled for months; (b) a gap up after a 5-month, 35% rally that is filled four weeks later; (c) a gap up, 19 days of trading, then a gap down below all those days.
Q10. On the day the Nifty Bank index makes a new intraday high, the Nifty 50 does not, and neither index makes a new closing high. Which Dow tenets apply, and how should a swing trader react?
Q11. Exercise (multi-timeframe sizing): weekly trend up; daily pullback low 1,240; trigger close 1,286; prior high (first target) 1,372. Account ₹3,00,000, risk 1%. Stop 0.3% below the low. Compute stop, RRR, shares and position value. Does it pass the checklist RRR?
Q12. Exercise: run snippet (e) and pick the instrument closest to its 52-week high. Using the method in Section 4, draw its nearest resistance and support from the last 12–18 months. Would a breakout above resistance today pass the RRR test with a stop just below the breakout level?
18. Sources
Sources: Zerodha Varsity, Module 2 (Technical Analysis): Introducing Technical Analysis · Multiple Candlestick Patterns (Part 3), gap-up and gap-down openings · Support and Resistance · Volumes · Dow Theory (Part 1) · Dow Theory (Part 2), ranges, breakouts, flags, RRR and checklist · Fibonacci Retracements · The Final Lap / Helping you get started · Interesting features on TradingView (multi-timeframe layouts). Zerodha Varsity, Module 12 (Innerworth): Head-and-Shoulders Pattern is a Psychological Map · Classic Chart Patterns: Know How to Use Them. Market structure (verified Oct 2026): Zerodha Z-Connect, Closing Auction Session (effective 3 Aug 2026) · Kotak Neo, NSE pre-open session changes from 7 Sep 2026 · NSE market timings. News context: Dhan, Closing bell 3 Feb 2026 (India–US trade deal) · Kotak Securities, ITC falls on cigarette excise duty (Jan 2026). Data: NSE daily OHLCV via Yahoo Finance (course data set data/ohlc, to 30 Sep 2026); all figures and statistics computed by course/scripts/ch03_figures.py. Explanations are written independently; Varsity text is not reproduced.