
Futures Trading
1. What you'll learn and why it matters
So far this course has dealt with the cash market: you pay the full price of a share, it lands in your demat account, and you can hold it as long as you like. A futures contract is different. You agree today on a price for a trade that settles on a fixed future date, and you put down only a deposit (the margin), typically 11% to 20% of the position's value. That one difference changes the risk completely. A 5% move in the stock becomes a 25% to 45% move on the money you actually put in.
SEBI's latest study of individual traders in equity derivatives (released 20 Aug 2026, covering FY25–FY26) found that 87.7% of individuals lost money in FY26, with aggregate net losses of ₹91,685 crore and an average loss of about ₹1.17 lakh per trader. The loss rate among futures traders was lower than among options traders but still 66.0%. Transaction costs alone were about ₹25,000 crore: before costs 82.1% were losers, after costs 87.7%. Futures are a professional tool. This chapter teaches you how they work so you can use them carefully, or decide not to use them at all, and both are reasonable choices.
By the end of this chapter you will be able to:
- explain why futures exist (the problems with private forward contracts) and how an exchange solves them;
- read a real NSE futures contract: lot size, contract value, expiry, tick size and settlement type, as of October 2026;
- calculate the margin (SPAN + exposure) and leverage of a position, and see why leverage is dangerous;
- build a daily mark-to-market (M2M) ledger for a long Nifty trade and a short stock-futures trade from real August–September 2026 settlement prices, including margin calls;
- price a futures contract with the cost-of-carry formula and compare it with actual prices for Nifty, RELIANCE, HDFCBANK and SBIN on 30 Sep 2026;
- read open interest (OI) with price (long buildup, short buildup, short covering, long unwinding) and test how much it predicts (in our data: very little);
- calculate rollover percentage and rollover cost, and handle expiry and physical settlement safely;
- calculate beta and hedge a stock or a portfolio with Nifty futures (how many lots, and what the hedge actually did in September 2026);
- size a positional futures trade by lot and stop distance, and see why the "risk 1% per trade" rule needs ₹15–40 lakh of capital per lot.
Swing and positional traders use futures to take leveraged directional views and, unlike the cash market, to hold a short position overnight. Long-term investors mostly don't need futures, with one exception: a short Nifty futures position can temporarily hedge a portfolio through a risky event without selling (and paying capital-gains tax on) your shares. Futures traders must master margins, M2M, rollover and position sizing. Most retail blow-ups come from not respecting those four.
The chapter has four parts. Part A, the contract (Sections 2–5): what a future is and how one trade works. Part B, the money (Sections 6–9): margin, leverage and the daily mark-to-market cash flows, with two full real ledgers. Part C, reading the market (Sections 10–14): liquidity, fair value and basis, calendar spreads, open interest, rollover and expiry. Part D, using futures (Sections 15–16): hedging a portfolio and sizing a positional trade.
If you are a long-term investor who only wants to hedge, the essential path is Sections 2–8, 11.1, 14 and 15, then the checklist in Section 18. If you plan to trade futures positionally, read everything, and pay most attention to Sections 8 and 16.
2. Forwards: the ancestor, and its four problems
A forward contract is a private agreement between two parties to exchange an asset for cash on a fixed future date at a price fixed today. Varsity uses the example of a jeweller who wants to lock in the price of gold for a purchase three months away, and a gold importer who is happy to lock in today's selling price. Neither pays anything today. On the agreed date they exchange gold for the agreed amount, whatever the market price is by then.
2.1 The logic: transferring price risk
The buyer of a forward (the jeweller) is protected if prices rise and loses the chance to buy cheaper if prices fall. The seller (the importer) has the opposite exposure. Each side gives up some upside to remove uncertainty. At expiry there are only three outcomes: price above the agreed price (buyer gains, seller loses the same amount), below it (the reverse), or equal (nobody gains). One side's gain is exactly the other's loss.
A three-month gold forward
- Agreement: buyer will take 10 kg of gold in 3 months at ₹15,000 per gram. Deal value = 10,000 g × ₹15,000 = ₹15 crore.
- Gold ends at ₹16,000/g. Market value = ₹16 crore. Buyer pays only ₹15 crore, so buyer gains ₹1 crore and the seller loses ₹1 crore.
- Gold ends at ₹14,200/g. Market value = ₹14.2 crore. Buyer must still pay ₹15 crore, so buyer loses ₹80 lakh and the seller gains ₹80 lakh.
- Settlement can be physical (gold delivered against ₹15 crore) or cash (only the difference, ₹1 crore or ₹80 lakh, changes hands).
2.2 The four problems with forwards
| Problem | What goes wrong |
|---|---|
| Liquidity risk | You must find someone with the exact opposite need, for the same quantity and date. Usually that means paying an intermediary. |
| Default (counterparty) risk | If prices move a lot, the losing side has every incentive to walk away. Nothing but a legal contract stops them. |
| Regulatory risk | Private, over-the-counter (OTC) deals are lightly supervised, which makes default and disputes more likely. |
| Rigidity | If your view changes halfway through, you cannot easily exit. The terms are customised, so nobody else wants to take over your contract. |
3. What a futures contract fixes
A futures contract keeps the core of a forward (agree a price today for a trade at a future date) and moves it onto an exchange. The exchange's clearing corporation (NSE Clearing Ltd for NSE) becomes the counterparty to every buyer and every seller. That single change, plus standard terms, margins and daily settlement, fixes all four problems.
| Feature | Forward | Futures (NSE) |
|---|---|---|
| Where it trades | Privately (OTC) | On the exchange, anonymous order book |
| Terms | Customised | Standardised: underlying, lot size, expiry, tick size, settlement |
| Counterparty risk | High | Clearing corporation guarantees settlement, backed by margins and daily M2M |
| Regulation | Light | SEBI-regulated |
| Exit before expiry | Very hard | Any time in market hours: just take the opposite trade (square off) |
| Expiries available | One, negotiated | Three monthly contracts at any time (near, next, far) |
| Settlement | Physical or cash, as agreed | Index futures: cash. Stock futures: physical delivery (since Oct 2019) |
Two prices now matter. The spot price is the price in the normal cash market. The futures price is the price of the futures contract. They move almost together, because arbitrage (Section 11) keeps the gap small, but they are not equal. The gap is called the basis.
4. Contract specifications on NSE today
Every futures contract is fully defined by its specification. Here is what each term means, with the values in force as of October 2026 (each one checked against the sources listed in Section 21):
| Term | Meaning | Current NSE rule (verified Oct 2026) |
|---|---|---|
| Underlying | What the contract is on | Indices (NIFTY, BANKNIFTY, FINNIFTY, MIDCPNIFTY, NIFTYNXT50) and 213 stocks (Oct-2026 contracts in our bhavcopy) |
| Lot size | Minimum tradable quantity (units/shares per contract) | NIFTY 65 and BANKNIFTY 30 since the Jan-2026 series. Stock lots vary (RELIANCE 500, HDFCBANK 650, SBIN 750). Exchanges revise lot sizes periodically, so always check the bhavcopy's NewBrdLotQty. |
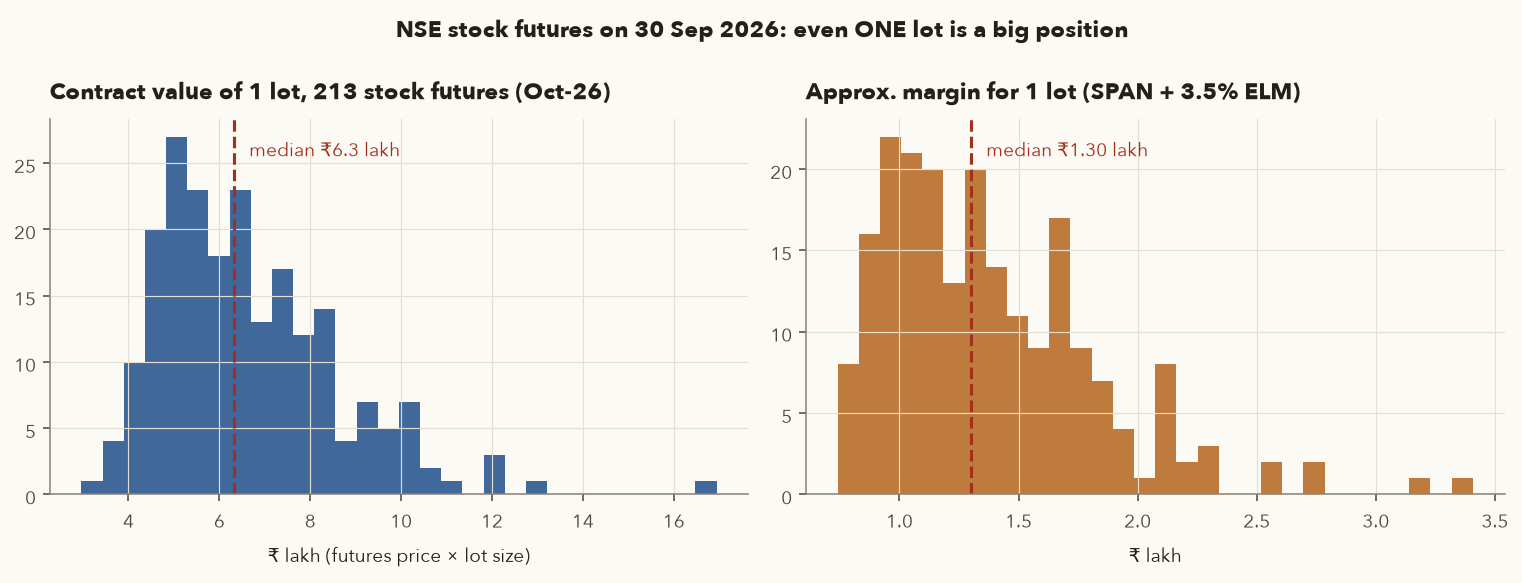
| Contract value | Futures price × lot size | SEBI's Oct-2024 framework requires index-derivative contracts to be worth at least ₹15 lakh when lot sizes are set. Contract value then floats with price: after Nifty's fall, one NIFTY lot was ₹14.76 lakh on 30 Sep 2026. Stock-futures lots on 30 Sep 2026 ranged from ₹2.96 lakh to ₹16.94 lakh (median ₹6.31 lakh). |
| Expiry cycle | Three monthly contracts trade at any time | Last Tuesday of the month for NSE index and stock futures (NSE moved expiry from Thursday to Tuesday from 1 Sep 2025). If that Tuesday is a holiday, expiry moves to the previous trading day: the Nov-2026 contracts expire Mon 23 Nov because Tue 24 Nov (Guru Nanak Jayanti) is a holiday. |
| Tick size | Smallest price step | Index futures: ₹0.05 up to an index level of 15,000, ₹0.10 from 15,000 to 30,000, ₹0.20 above 30,000 (revised from April 2025). So NIFTY trades in ₹0.10 steps and BANKNIFTY in ₹0.20 steps. Stock futures follow the stock's price-band tick (₹0.01 for many stocks under ₹250, for example). |
| Daily settlement price | Price used for the daily M2M | The futures closing price (a volume-weighted average of the last 30 minutes), shown as SttlmPric in the bhavcopy |
| Final settlement | What happens at expiry | Index futures: cash-settled at the index's closing value on expiry day. Stock futures: physically settled. Longs take delivery and pay the full value; shorts must deliver shares. |
| Trading hours | 9:15 am to 3:30 pm, Monday to Friday, except exchange holidays |
Our data confirms these rules. In the August–September 2026 bhavcopy, NIFTY futures prices move only in multiples of ₹0.10 and BANKNIFTY in ₹0.20. The September contract's final settlement price on 29 Sep was 22,716.20, exactly the Nifty's closing value that day.
4.1 Real contract data, 30 Sep 2026
The table below is built from the NSE F&O bhavcopy for 30 Sep 2026 (October contracts). The SPAN percentage comes from NSE Clearing's SPAN risk-parameter file for the same day. Section 6 explains the margin columns.
| Contract (Oct-26) | Lot | Futures price | Spot | Contract value ₹ | SPAN % | ELM % | Margin ₹ (approx) | Leverage | OI (contracts) | Volume (contracts) |
|---|---|---|---|---|---|---|---|---|---|---|
| NIFTY | 65 | 22,707.30 | 22,620.45 | 14,75,974 | 9.34 | 2.0 | 1,67,370 | 8.8× | 2,77,155 | 58,953 |
| BANKNIFTY | 30 | 55,006.00 | 54,633.05 | 16,50,180 | 9.31 | 2.0 | 1,86,667 | 8.8× | 79,832 | 24,111 |
| RELIANCE | 500 | 1,191.80 | 1,187.00 | 5,95,900 | 14.24 | 3.5 | 1,05,706 | 5.6× | 2,90,864 | 18,765 |
| HDFCBANK | 650 | 715.55 | 708.71 | 4,65,108 | 14.16 | 3.5 | 82,137 | 5.7× | 5,63,985 | 38,017 |
| SBIN | 750 | 967.20 | 959.50 | 7,25,400 | 14.18 | 3.5 | 1,28,274 | 5.7× | 1,32,710 | 9,180 |
| INFY | 400 | 1,002.60 | 994.10 | 4,01,040 | 15.70 | 3.5 | 77,008 | 5.2× | 1,82,720 | 25,169 |
| TCS | 225 | 2,055.20 | 2,050.59 | 4,62,420 | 14.77 | 3.5 | 84,479 | 5.5× | 1,19,981 | 12,477 |
| TATASTEEL | 2,750 | 186.07 | 184.30 | 5,11,692 | 14.18 | 3.5 | 90,454 | 5.7× | 1,12,204 | 11,654 |
| ITC | 1,725 | 263.55 | 262.75 | 4,54,624 | 14.25 | 3.5 | 80,703 | 5.6× | 85,626 | 6,216 |
A few things stand out. One NIFTY lot is a ₹14.76 lakh position. Even the "smallest" stock-futures lot, VEDL (1,150 shares), was worth ₹2.96 lakh. Open interest (OI, Section 13) in the NIFTY Oct contract was 2,77,155 contracts, and 58,953 contracts traded that day.
4.2 The contract cycle: near, next and far month
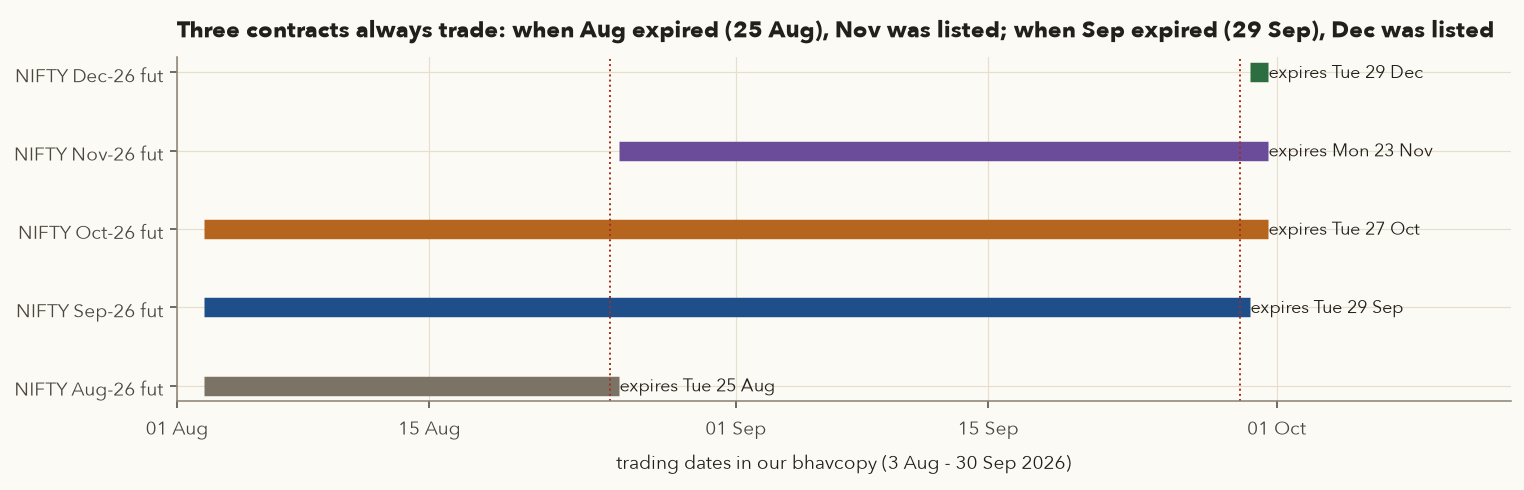
At any moment three monthly contracts trade: the near (current) month, the next (mid) month and the far month. When the near month expires, the next month becomes the near month and a new far month is listed. Liquidity is concentrated in the near month. On 30 Sep 2026, NIFTY Oct futures traded 58,953 contracts, Nov 5,653 and Dec just 1,933.
5. Your first futures trade: long, short, square-off
When you buy (go long) one lot of futures, you commit to buying the lot at today's futures price on expiry. When you sell (go short), you commit to selling it. You do not have to wait for expiry. At any time you can square off by taking the opposite trade: sell what you bought, or buy back what you sold. Your obligation then passes to whoever took the other side, and your margin is released.
- \(F_{\text{entry}}\)
- The futures price at which you opened the position, in ₹ (index points for NIFTY, where 1 point = ₹1 per unit).
- \(F_{\text{exit}}\)
- The futures price at which you squared off, or the final settlement price if you held to expiry.
- lot size
- Units (shares, or index units) in one contract, set by the exchange: 65 for NIFTY, 500 for RELIANCE (Section 4).
- lots
- How many contracts you traded.
- P&L
- Profit (positive) or loss (negative) in ₹, before costs.
How it works: the price change per unit, times the number of units you control. A long gains when the exit is higher than the entry. A short gains when it is lower, which is why the two prices swap places.
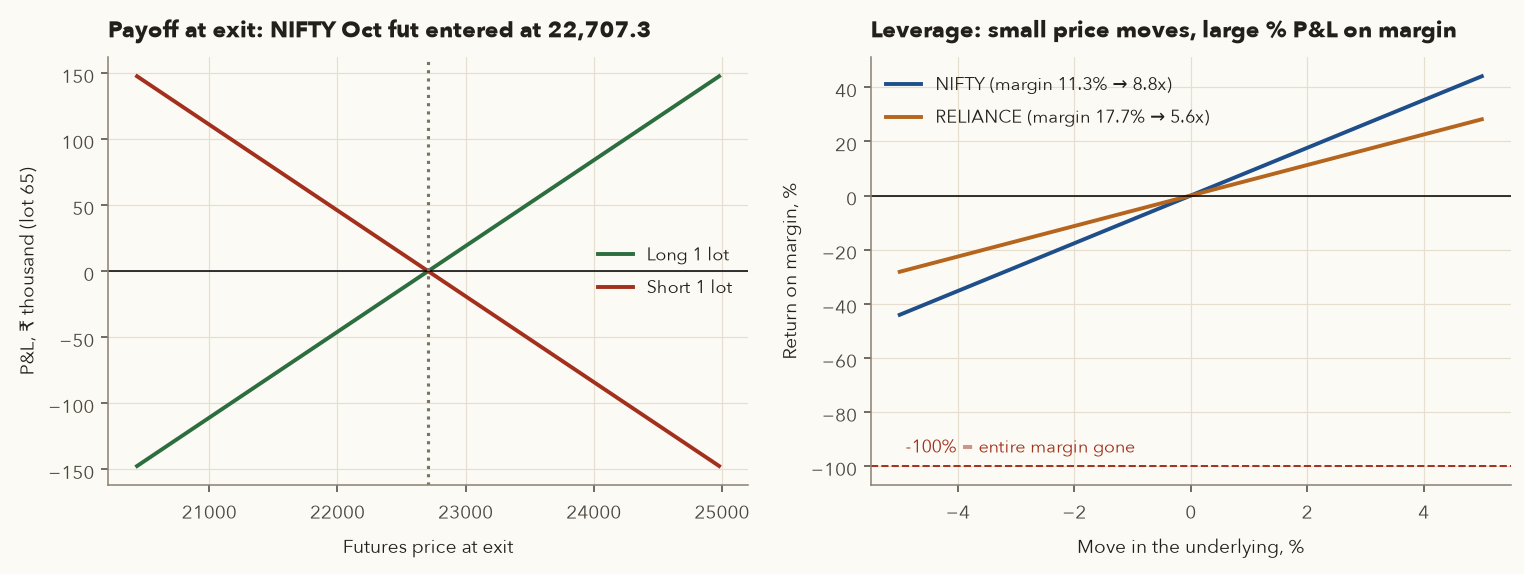
The payoff is linear. Every 1-point move in NIFTY futures is ₹65 per lot, in either direction, with no ceiling and no floor. Futures are also a zero-sum game before costs: every rupee one side gains, the other side loses. After brokerage, STT and other charges, the participants as a whole lose money, which is one reason most individual traders lose.
What a 1% move does to one lot
- Price on 30 Sep: 22,707.30. Lot 65. Contract value = 22,707.30 × 65 = ₹14,75,974.50.
- A 1% rise (≈ 227.1 points) gives a long position 227.07 × 65 ≈ +₹14,760, and the short loses the same amount.
- A 5% fall (≈ 1,135.4 points) costs the long ≈ ₹73,799. That is close to the ₹74,493 one lot would have lost on the single overnight gap of 7 Apr 2025 (Section 16).
6. Margins: SPAN, exposure and peak margin
6.1 Why margins exist
The clearing corporation guarantees that the winner gets paid, so it must make sure the loser can pay. It does that in two ways: (1) it collects a deposit, the initial margin, from both buyer and seller before the trade, and (2) it settles gains and losses every day through mark-to-market (Section 8), so losses can never pile up unnoticed.
- Initial margin
- The deposit you must have in your account, in ₹, before you can open the position. Both buyer and seller pay it.
- SPAN margin
- The main part: NSE Clearing's estimate of the worst one-contract loss over a short period (explained below). It changes every day.
- SPAN%
- That worst-case loss as a % of the futures price, read from NSE Clearing's daily SPAN file (9.34% for NIFTY on 30 Sep 2026). The \(\approx\) is because the file gives a rupee loss per unit; the % is just that loss ÷ price.
- ELM
- Exposure / extreme-loss margin: an extra buffer on top of SPAN.
- ELM%
- A fixed rate: 2% for index futures, 3.5% for stock futures.
- contract value
- Futures price × lot size, in ₹: the full size of the position you control.
How it works: work out the contract value, take the SPAN % and the ELM % of it, and add the two. The total, as a % of contract value, is your margin % (11.34% for one NIFTY lot on 30 Sep 2026).
- SPAN margin (Standard Portfolio Analysis of Risk) is computed by NSE Clearing every day. It simulates 16 price-and-volatility scenarios and charges the worst loss among them. The size of the price move it tests (the price scan range) is set from recent volatility so that the loss over the margin period of risk (two days, because an M2M loss is only collected the next morning) is covered with very high confidence (99% or more). More volatility means higher SPAN.
- Exposure / Extreme Loss Margin (ELM) is a buffer on top. NSE Clearing's current rates are 2% of notional value for index derivatives and 3.5% for stock derivatives.
Margin for one lot of NIFTY and RELIANCE October futures
- NIFTY: the SPAN file's worst-case loss is ₹2,120.78 per unit at a futures price of 22,707.30, which is 9.34%. SPAN per lot = 2,120.78 × 65 = ₹1,37,850.70.
- NIFTY ELM = 2% × ₹14,75,974.50 = ₹29,519.49. Initial margin = 1,37,850.70 + 29,519.49 = ₹1,67,370 (11.34% of contract value).
- RELIANCE: SPAN ₹169.70 per share (14.24% of 1,191.80) × 500 = ₹84,850. ELM = 3.5% × ₹5,95,900 = ₹20,856.50. Initial margin = ₹1,05,706.50 (17.74%).
- Stocks need a higher % margin than the index because a single stock is more volatile. Across all stock futures, SPAN on 30 Sep ranged from 14.16% to 46.55% (POLICYBZR), median 16.44%.
Your broker's margin calculator will show slightly different numbers. SPAN changes every day and broker figures include any additional or ad-hoc margins. Use the broker's number for real trades. Use the method above to understand why margin is what it is.
6.2 How margin works in India today (2026)
- 100% upfront margin. Under SEBI's peak-margin framework (fully phased in by Sep 2021), you must have the full SPAN + ELM in your account before taking the position. Clearing corporations take four random intraday snapshots of every client's margin, and any shortfall attracts a penalty.
- Maintained every day. Varsity's older explanation treats SPAN as a "maintenance margin": you get a margin call only when your balance falls below SPAN. In today's Indian framework, the required margin on an open position is the full SPAN + ELM every day. If M2M losses take your balance below it, you have a margin shortfall, and the broker will ask you to add funds (a margin call) or square off your position. Check your broker's risk-management (RMS) policy.
- Product types. Use NRML to carry a futures position overnight (that is what a swing trader needs). MIS is intraday-only and is auto-squared-off near the close. Since the peak-margin rules, brokers cannot give extra intraday leverage beyond SPAN + ELM, so MIS no longer meaningfully reduces margin. Zerodha discontinued bracket orders in 2020, and under peak-margin rules cover orders no longer carry the large margin discount they once did. Varsity's sections on BO/CO margins are now mostly historical.
- Calendar spreads (long one month, short another, same underlying) get much lower margin. NSE Clearing levies ELM on only one-third of the far-month value. The benefit is withdrawn on expiry day for a spread whose one leg expires that day. This has applied to index derivatives since Feb 2025 (SEBI's Oct-2024 measures) and, from 5 May 2026, to single-stock derivatives as well.
Margins move every day, so framework.costs.futures_charges covers only transaction costs. For margin, fetch your broker's number before each trade, and treat the margin as the minimum cash you need, never the maximum you can lose.
7. Leverage: the calculation and the danger
Margin lets you control a large position with a small deposit. The ratio is your leverage:
- Contract value
- Futures price × lot size × lots, in ₹.
- Margin
- The initial margin blocked for the position (SPAN + ELM, Section 6), in ₹.
- margin %
- Margin ÷ contract value, written as a decimal in the formula (11.34% = 0.1134).
- Leverage
- How many rupees of position each rupee of margin controls, shown as "×".
- underlying % move
- The % change in the futures price.
- Return on margin
- Your profit or loss as a % of the margin you put up.
- Divide contract value by margin. Since margin is a fixed % of contract value, this is the same as 1 ÷ margin %.
- Multiply any price move by the leverage to see what it does to your margin money.
- An adverse move equal to the margin % loses an amount equal to the whole margin.
NIFTY vs RELIANCE leverage
- NIFTY: leverage = 14,75,974.50 / 1,67,370 = 8.82×. A 1% move in Nifty = 8.8% gain or loss on your margin. An 11.34% adverse move wipes out the whole margin.
- RELIANCE: leverage = 5,95,900 / 1,05,706.50 = 5.64×. A 17.74% adverse move wipes out the margin.
- Compare with the cash market. ₹1,67,370 in Nifty ETFs exposes you to a 1% move of ₹1,674. The same money as margin on one NIFTY futures lot exposes you to ₹14,760.
Leverage does not change the odds of a trade being right. It only multiplies the size of the result. The danger is in the arithmetic of losses: after a 50% loss you need +100% to get back to where you started. Leverage is often sold as a way to make more from less capital. The more useful way to see it is that leverage raises the chance of a large, fast loss. The safest use of futures is to hold only as many lots as your risk budget allows (Section 16), not as many as your margin allows. If you have ₹10 lakh and hold one Nifty lot, your real leverage is 1.5×, not 8.8×.
8. Mark-to-market: a full daily ledger for a real Nifty trade
8.1 The idea
With a forward, gains and losses build up silently until expiry. With futures, the clearing corporation settles them every day. At the end of each day your position is revalued at the day's settlement price. If it went your way, the gain is credited to your account. If not, the loss is debited. Next day, the reference price is reset to that settlement price. This is mark-to-market (M2M). It stops losses from piling up and is what makes the clearing corporation's guarantee credible.
- \(t\)
- A trading day. \(t-1\) is the trading day before it.
- \(P_t\)
- The futures settlement price on day \(t\) (
SttlmPricin the bhavcopy), in ₹ or index points. - \(P_{t-1}\)
- The previous day's settlement price: the reference your position was revalued at last night.
- side
- +1 for a long, −1 for a short. It flips the sign so a price rise is a gain for a long and a loss for a short.
- lot size, lots
- Units per contract and number of contracts, as in Section 5.
- \(\text{M2M}_t\)
- The cash credited (positive) or debited (negative) to your account at the end of day \(t\), in ₹.
- \(\sum_t\)
- Add up the daily M2M amounts over every day you held the position.
- Each evening, take today's settlement price minus yesterday's, multiply by the units you hold, and apply the sign for long or short. That amount is paid into or out of your account.
- The next day's change is measured from today's settlement price, not from your entry price.
- The only exceptions are the first and last days, where your actual trade prices replace a settlement price.
- Adding up every day's M2M gives exactly the same total as the simple P&L formula in Section 5. M2M only changes when the cash moves.
8.2 The trade
Long 1 lot, held to expiry without a stop
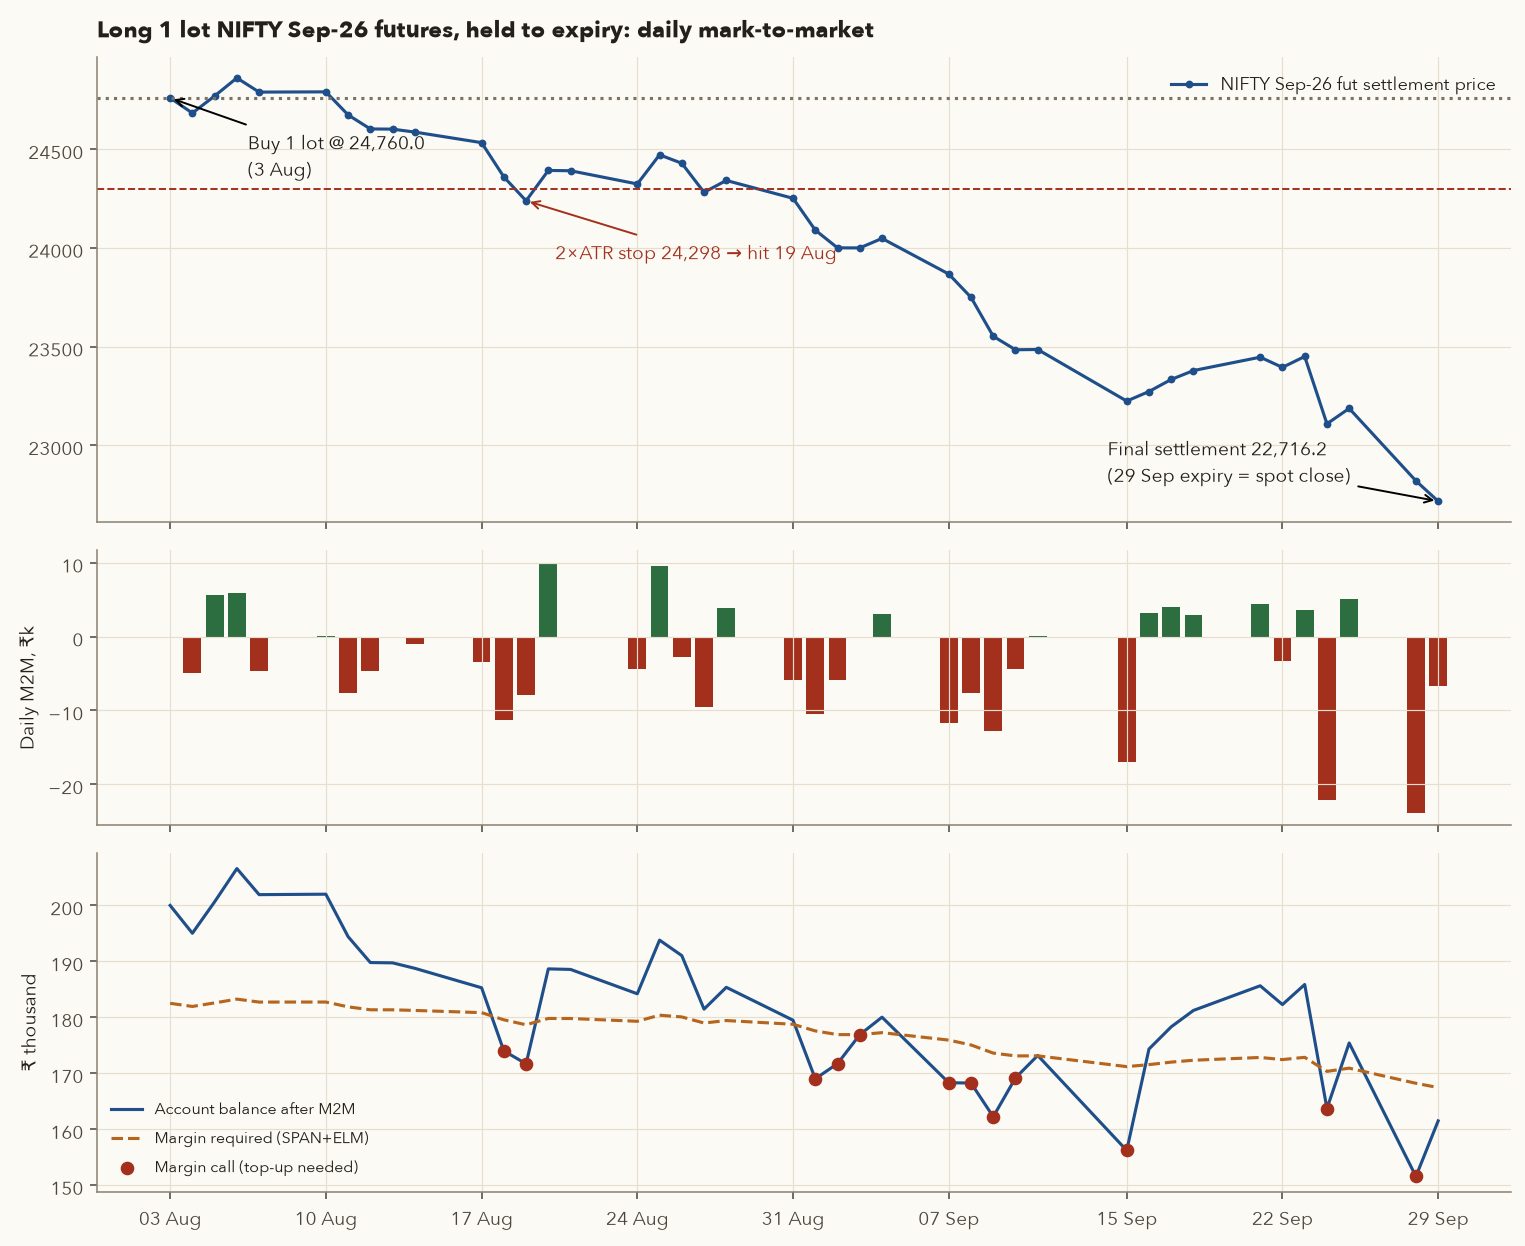
Assumptions (stated so you can reproduce them): the trader buys 1 lot (65) of NIFTY Sep-26 futures at the 3 Aug settlement price of 24,760.00 and holds it to expiry. The account starts with ₹2,00,000. Required margin each day = 11.34% of contract value (SPAN 9.34% + ELM 2%). The SPAN % is taken from the 30-Sep SPAN file and held constant. Real SPAN changes daily, but this keeps the arithmetic transparent. When the balance after M2M falls below the required margin, the trader tops up exactly the shortfall (the margin call).
- Initial margin on 3 Aug = 24,760 × 65 × 11.34% = ₹1,82,500. The account has ₹2,00,000, so the trade is allowed with a buffer of ₹17,500.
- 4 Aug: settlement 24,683.50. M2M = (24,683.50 − 24,760.00) × 65 = −76.5 × 65 = −₹4,972.50. Balance ₹1,95,027.50.
- 5 Aug: settlement 24,770.00. M2M = (24,770.00 − 24,683.50) × 65 = +86.5 × 65 = +₹5,622.50. Note the reference price is the previous settlement, not your entry price.
- 29 Sep (expiry): the contract is cash-settled at the final settlement price 22,716.20 (Nifty's close). Total P&L = (22,716.20 − 24,760.00) × 65 = −₹1,32,847. The sum of all 40 daily M2M entries is the same −₹1,32,847.
8.3 The full ledger
| Date | Settlement price | Change | Daily M2M ₹ | Cumulative P&L ₹ | Margin required ₹ | Balance after M2M ₹ | Top-up (margin call) ₹ |
|---|---|---|---|---|---|---|---|
| 03 Aug | 24,760.00 | +0.00 | 0 | 0 | 1,82,500 | 2,00,000 | — |
| 04 Aug | 24,683.50 | -76.50 | −4,972 | −4,972 | 1,81,936 | 1,95,028 | — |
| 05 Aug | 24,770.00 | +86.50 | 5,622 | 650 | 1,82,574 | 2,00,650 | — |
| 06 Aug | 24,861.40 | +91.40 | 5,941 | 6,591 | 1,83,248 | 2,06,591 | — |
| 07 Aug | 24,789.70 | -71.70 | −4,660 | 1,930 | 1,82,719 | 2,01,930 | — |
| 10 Aug | 24,790.90 | +1.20 | 78 | 2,008 | 1,82,728 | 2,02,008 | — |
| 11 Aug | 24,674.10 | -116.80 | −7,592 | −5,584 | 1,81,867 | 1,94,416 | — |
| 12 Aug | 24,602.90 | -71.20 | −4,628 | −10,212 | 1,81,342 | 1,89,788 | — |
| 13 Aug | 24,602.00 | -0.90 | −58 | −10,270 | 1,81,336 | 1,89,730 | — |
| 14 Aug | 24,587.00 | -15.00 | −975 | −11,245 | 1,81,225 | 1,88,755 | — |
| 17 Aug | 24,533.50 | -53.50 | −3,478 | −14,722 | 1,80,831 | 1,85,278 | — |
| 18 Aug | 24,359.90 | -173.60 | −11,284 | −26,006 | 1,79,551 | 1,73,994 | 5,558 |
| 19 Aug | 24,238.80 | -121.10 | −7,872 | −33,878 | 1,78,659 | 1,71,680 | 6,979 |
| 20 Aug | 24,392.60 | +153.80 | 9,997 | −23,881 | 1,79,792 | 1,88,656 | — |
| 21 Aug | 24,391.10 | -1.50 | −98 | −23,978 | 1,79,781 | 1,88,558 | — |
| 24 Aug | 24,324.10 | -67.00 | −4,355 | −28,334 | 1,79,287 | 1,84,203 | — |
| 25 Aug | 24,471.70 | +147.60 | 9,594 | −18,740 | 1,80,375 | 1,93,797 | — |
| 26 Aug | 24,429.10 | -42.60 | −2,769 | −21,508 | 1,80,061 | 1,91,028 | — |
| 27 Aug | 24,281.90 | -147.20 | −9,568 | −31,076 | 1,78,976 | 1,81,460 | — |
| 28 Aug | 24,341.90 | +60.00 | 3,900 | −27,176 | 1,79,418 | 1,85,360 | — |
| 31 Aug | 24,251.40 | -90.50 | −5,882 | −33,059 | 1,78,751 | 1,79,478 | — |
| 01 Sep | 24,090.30 | -161.10 | −10,472 | −43,530 | 1,77,564 | 1,69,006 | 8,558 |
| 02 Sep | 24,000.30 | -90.00 | −5,850 | −49,380 | 1,76,901 | 1,71,714 | 5,187 |
| 03 Sep | 24,000.10 | -0.20 | −13 | −49,394 | 1,76,899 | 1,76,888 | 12 |
| 04 Sep | 24,048.10 | +48.00 | 3,120 | −46,274 | 1,77,253 | 1,80,019 | — |
| 07 Sep | 23,867.70 | -180.40 | −11,726 | −58,000 | 1,75,923 | 1,68,293 | 7,630 |
| 08 Sep | 23,749.60 | -118.10 | −7,676 | −65,676 | 1,75,053 | 1,68,247 | 6,806 |
| 09 Sep | 23,552.20 | -197.40 | −12,831 | −78,507 | 1,73,598 | 1,62,222 | 11,376 |
| 10 Sep | 23,484.00 | -68.20 | −4,433 | −82,940 | 1,73,095 | 1,69,165 | 3,930 |
| 11 Sep | 23,485.20 | +1.20 | 78 | −82,862 | 1,73,104 | 1,73,173 | — |
| 15 Sep | 23,223.90 | -261.30 | −16,984 | −99,846 | 1,71,178 | 1,56,189 | 14,989 |
| 16 Sep | 23,272.30 | +48.40 | 3,146 | −96,700 | 1,71,535 | 1,74,324 | — |
| 17 Sep | 23,333.40 | +61.10 | 3,972 | −92,729 | 1,71,985 | 1,78,295 | — |
| 18 Sep | 23,378.50 | +45.10 | 2,932 | −89,798 | 1,72,317 | 1,81,227 | — |
| 21 Sep | 23,446.30 | +67.80 | 4,407 | −85,390 | 1,72,817 | 1,85,634 | — |
| 22 Sep | 23,394.60 | -51.70 | −3,360 | −88,751 | 1,72,436 | 1,82,273 | — |
| 23 Sep | 23,449.80 | +55.20 | 3,588 | −85,163 | 1,72,843 | 1,85,861 | — |
| 24 Sep | 23,108.60 | -341.20 | −22,178 | −1,07,341 | 1,70,328 | 1,63,683 | 6,645 |
| 25 Sep | 23,186.70 | +78.10 | 5,076 | −1,02,264 | 1,70,904 | 1,75,405 | — |
| 28 Sep | 22,819.60 | -367.10 | −23,862 | −1,26,126 | 1,68,198 | 1,51,543 | 16,655 |
| 29 Sep | 22,716.20 | -103.40 | −6,721 | −1,32,847 | 1,67,436 | 1,61,477 | — |
8.4 A margin call, step by step
The first margin call in the ledger
- Close of 17 Aug: settlement 24,533.50; balance ₹1,85,277.50.
- 18 Aug: settlement 24,359.90. M2M = (24,359.90 − 24,533.50) × 65 = −173.6 × 65 = −₹11,284. Balance = 1,85,277.50 − 11,284 = ₹1,73,993.50.
- Required margin = 24,359.90 × 65 × 11.34% = ₹1,79,551.10. (Margin falls a little as the contract value falls, but much less than the loss.)
- Shortfall = 1,79,551.10 − 1,73,993.50 = ₹5,557.60. The trader must add this cash, or the broker can square off the position, usually at a bad price.
Over the trade there were 12 margin calls, and the trader had to add ₹94,324 on top of the original ₹2,00,000. At expiry the margin was released and the account held ₹1,61,477 (= 2,00,000 + 94,324 − 1,32,847). The futures price fell only 8.25%, yet the loss equalled 72.8% of the initial margin. Of the 40 trading days after entry, 26 were losing days and 14 winning days. The worst single day was 28 Sep (−₹23,861.50).
8.5 The same trade with a stop-loss
Exit when the settlement closes below entry − 2 × ATR(14)
- Nifty's 14-day Wilder ATR on 3 Aug was 230.8 points (Chapter 4). Stop = 24,760 − 2 × 230.8 = 24,298.4.
- On 19 Aug the settlement price closed at 24,238.8, below the stop. Exit there (a real stop order would usually fill near the stop during the day; we use the close to stay with the settlement data).
- Loss = (24,238.8 − 24,760.0) × 65 = −₹33,878, about one-quarter of the −₹1,32,847 from holding to expiry. The stop could not make the trade a winner. It kept a bad trade small.
M2M makes leverage visible every evening. If you cannot comfortably fund several margin calls without changing your plan, the position is too big. Decide your exit (stop) before you enter, and never "add margin to stay in" a trade that has hit its stop.
9. Shorting with futures: a real stock-futures ledger
Shorting means selling first and buying back later. You profit if the price falls and lose if it rises. In the Indian cash market you can short shares only intraday: an unsquared short leads to an auction and penalties, because you have no shares to deliver. (The exchange's Securities Lending and Borrowing (SLB) scheme does allow borrowing shares to short for longer, but it is thinly traded and rarely practical for a retail trader.) In futures, a short position is just as easy to hold overnight as a long, with the same margin and the same M2M (with the sign reversed). That makes futures the main tool for positional shorting.
A short futures position is an agreement to sell at today's price on expiry. If the price falls, you can buy back cheaper and keep the difference. The stop-loss for a short sits above the entry price. Note the asymmetry: a long can at most lose the full price (the stock goes to zero), but a short's loss has no theoretical limit, because the price can keep rising.
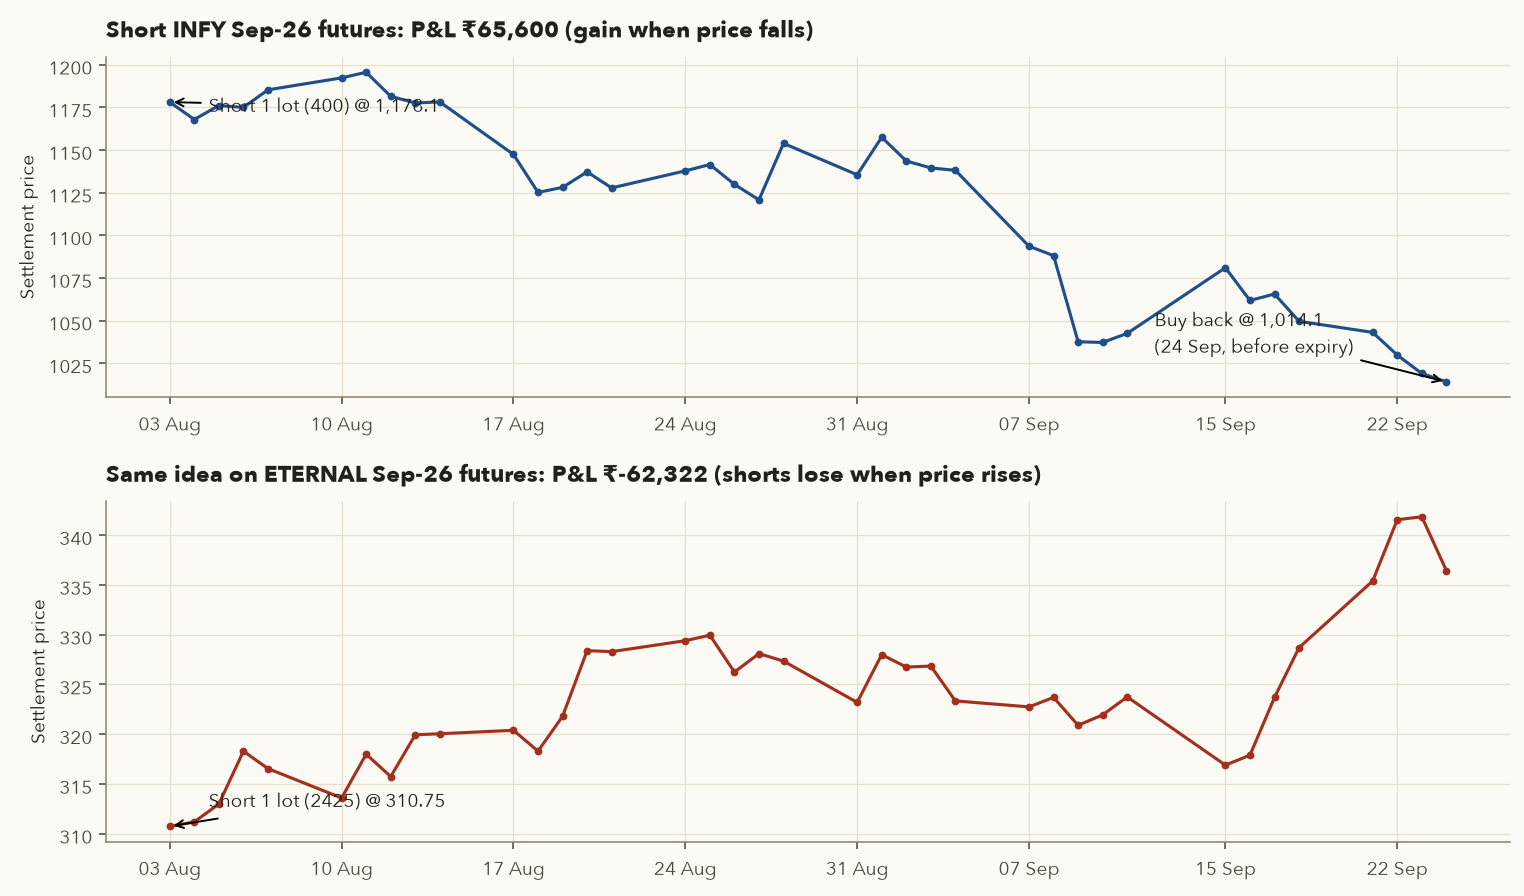
Short 1 lot (400 shares), squared off before expiry
- Sell 1 lot at the 3 Aug settlement price of 1,178.10. Contract value = 1,178.10 × 400 = ₹4,71,240. Margin at 19.2% (SPAN 15.70% + ELM 3.5%) = ₹90,488. The account starts with ₹1,50,000.
- Each day M2M = −(Pt − Pt−1) × 400. Example: 7 Sep, settlement fell 44.5 (1,138.10 → 1,093.60), M2M = +44.5 × 400 = +₹17,800.
- Square off (buy back) on 24 Sep at 1,014.10, five days before expiry, to avoid physical settlement (Section 14). P&L = (1,178.10 − 1,014.10) × 400 = +₹65,600.
- It was not a smooth ride. By 11 Aug the trade was −₹7,000. A single day, 15 Sep, cost ₹15,400 when INFY bounced 38.5 points.
| Date | Settlement price | Change | Daily M2M ₹ | Cumulative P&L ₹ | Margin required ₹ | Balance after M2M ₹ | Top-up (margin call) ₹ |
|---|---|---|---|---|---|---|---|
| 03 Aug | 1,178.10 | +0.00 | 0 | 0 | 90,488 | 1,50,000 | — |
| 04 Aug | 1,167.90 | -10.20 | 4,080 | 4,080 | 89,705 | 1,54,080 | — |
| 05 Aug | 1,176.10 | +8.20 | −3,280 | 800 | 90,335 | 1,50,800 | — |
| 06 Aug | 1,175.00 | -1.10 | 440 | 1,240 | 90,250 | 1,51,240 | — |
| 07 Aug | 1,185.30 | +10.30 | −4,120 | −2,880 | 91,041 | 1,47,120 | — |
| 10 Aug | 1,192.30 | +7.00 | −2,800 | −5,680 | 91,579 | 1,44,320 | — |
| 11 Aug | 1,195.60 | +3.30 | −1,320 | −7,000 | 91,832 | 1,43,000 | — |
| 12 Aug | 1,181.50 | -14.10 | 5,640 | −1,360 | 90,749 | 1,48,640 | — |
| 13 Aug | 1,177.60 | -3.90 | 1,560 | 200 | 90,450 | 1,50,200 | — |
| 14 Aug | 1,178.20 | +0.60 | −240 | −40 | 90,496 | 1,49,960 | — |
| 17 Aug | 1,147.40 | -30.80 | 12,320 | 12,280 | 88,130 | 1,62,280 | — |
| 18 Aug | 1,125.20 | -22.20 | 8,880 | 21,160 | 86,425 | 1,71,160 | — |
| 19 Aug | 1,128.10 | +2.90 | −1,160 | 20,000 | 86,648 | 1,70,000 | — |
| 20 Aug | 1,137.20 | +9.10 | −3,640 | 16,360 | 87,347 | 1,66,360 | — |
| 21 Aug | 1,127.80 | -9.40 | 3,760 | 20,120 | 86,625 | 1,70,120 | — |
| 24 Aug | 1,137.80 | +10.00 | −4,000 | 16,120 | 87,393 | 1,66,120 | — |
| 25 Aug | 1,141.50 | +3.70 | −1,480 | 14,640 | 87,677 | 1,64,640 | — |
| 26 Aug | 1,129.90 | -11.60 | 4,640 | 19,280 | 86,786 | 1,69,280 | — |
| 27 Aug | 1,120.80 | -9.10 | 3,640 | 22,920 | 86,087 | 1,72,920 | — |
| 28 Aug | 1,153.90 | +33.10 | −13,240 | 9,680 | 88,630 | 1,59,680 | — |
| 31 Aug | 1,135.50 | -18.40 | 7,360 | 17,040 | 87,216 | 1,67,040 | — |
| 01 Sep | 1,157.50 | +22.00 | −8,800 | 8,240 | 88,906 | 1,58,240 | — |
| 02 Sep | 1,143.60 | -13.90 | 5,560 | 13,800 | 87,838 | 1,63,800 | — |
| 03 Sep | 1,139.50 | -4.10 | 1,640 | 15,440 | 87,524 | 1,65,440 | — |
| 04 Sep | 1,138.10 | -1.40 | 560 | 16,000 | 87,416 | 1,66,000 | — |
| 07 Sep | 1,093.60 | -44.50 | 17,800 | 33,800 | 83,998 | 1,83,800 | — |
| 08 Sep | 1,088.10 | -5.50 | 2,200 | 36,000 | 83,576 | 1,86,000 | — |
| 09 Sep | 1,037.60 | -50.50 | 20,200 | 56,200 | 79,697 | 2,06,200 | — |
| 10 Sep | 1,037.20 | -0.40 | 160 | 56,360 | 79,666 | 2,06,360 | — |
| 11 Sep | 1,042.50 | +5.30 | −2,120 | 54,240 | 80,073 | 2,04,240 | — |
| 15 Sep | 1,081.00 | +38.50 | −15,400 | 38,840 | 83,030 | 1,88,840 | — |
| 16 Sep | 1,061.80 | -19.20 | 7,680 | 46,520 | 81,555 | 1,96,520 | — |
| 17 Sep | 1,065.60 | +3.80 | −1,520 | 45,000 | 81,847 | 1,95,000 | — |
| 18 Sep | 1,049.60 | -16.00 | 6,400 | 51,400 | 80,618 | 2,01,400 | — |
| 21 Sep | 1,043.10 | -6.50 | 2,600 | 54,000 | 80,119 | 2,04,000 | — |
| 22 Sep | 1,029.80 | -13.30 | 5,320 | 59,320 | 79,098 | 2,09,320 | — |
| 23 Sep | 1,019.00 | -10.80 | 4,320 | 63,640 | 78,268 | 2,13,640 | — |
| 24 Sep | 1,014.10 | -4.90 | 1,960 | 65,600 | 77,892 | 2,15,600 | — |
A short that went wrong
Shorting 1 lot (2,425 shares) of ETERNAL Sep futures at 310.75 on 3 Aug and buying back at 336.45 on 24 Sep: loss = (310.75 − 336.45) × 2,425 = −₹62,322, against an initial margin of about ₹1,65,867. In this market (Nifty −8% over the window), most stocks fell, but not all. A short needs a reason, a stop above a logical level, and position sizing, just like a long.
10. Index futures, liquidity and impact cost
NIFTY futures take their value from the Nifty 50 index. Varsity gives several reasons why index futures suit beginners better than single-stock futures. The index is diversified across 50 stocks, so one company's bad news rarely moves it much. It is very hard to manipulate. Its volatility is lower than most single stocks, so margin is a smaller % (9.34% SPAN for NIFTY vs 14–47% for stocks on 30 Sep). It is cash-settled, so there is no delivery risk. And it is the most liquid contract.
Liquidity compared
- NIFTY Oct futures turnover: ₹8,739.89 crore in one day.
- Most active stock futures: HDFCBANK ₹1,776 crore, BSE ₹1,561 crore, ICICIBANK ₹1,513 crore, APOLLOHOSP ₹1,169 crore, RELIANCE ₹1,123 crore.
- Within NIFTY: Oct 58,953 contracts, Nov 5,653, Dec 1,933. Trade the near month unless you have a specific reason not to.
10.1 Impact cost
Every order book has a bid (best price a buyer is offering) and an ask (best price a seller wants). If you buy at the ask and immediately sell at the bid, you lose the spread. Impact cost measures how far your execution price is from the "ideal" mid-price. It is a direct measure of liquidity.
- best bid
- The highest price any buyer is currently offering, in ₹.
- best ask
- The lowest price any seller is currently asking, in ₹.
- Ideal price
- The mid-point of the two: a fair "no-friction" price.
- actual execution price
- The average price you actually got. A large order may fill at several price levels.
- Impact cost
- How far your fill was from the mid-point, as a % of the mid-point.
How it works: find the mid-price, measure how far your fill was from it, and express that gap as a % of the mid-price. For a buy the gap is execution − ideal; for a sell, use ideal − execution so the cost is still positive. The smaller the number, the more liquid the contract.
Liquid vs illiquid contract
- Liquid index future: bid 22,707.0, ask 22,707.3, ideal 22,707.15. A market buy fills at 22,707.3. Impact = 0.15 / 22,707.15 = 0.0007%.
- Illiquid stock future: bid 1,000, ask 1,004, ideal 1,002. A market buy of one lot eats through two price levels and averages 1,005. Impact = 3 / 1,002 = 0.30%, over 400 times worse. On a 2× ATR stop of ~3% that is a tenth of your risk lost just getting in.
Practical rule: before trading any futures contract, look at the bid-ask spread and the depth for at least 5–10× your quantity. Prefer limit orders in anything less liquid than NIFTY, BANKNIFTY or the top-traded stock futures.
11. Futures pricing: cost of carry, basis, contango and backwardation
11.1 The logic: why futures usually trade above spot
Imagine two ways to own Nifty on 27 Oct. (a) Buy the shares today: you pay the full price now, give up the interest that money could have earned, and receive any dividends paid before 27 Oct. (b) Buy Oct futures: you pay (almost) nothing now, can keep the money in Treasury bills earning interest, but receive no dividends. If (a) and (b) are to cost the same, the futures price must equal the spot price plus interest minus dividends. If it didn't, arbitrageurs would buy the cheaper one and sell the dearer one until the gap closed. This relationship is the spot–futures parity, or cost-of-carry model.
- \(F\)
- The futures price: its fair value in the first two lines, the actual market price in the last two. In ₹ or index points.
- \(S\)
- The spot price: today's price of the stock or index itself in the cash market.
- \(r\)
- The yearly risk-free interest rate, as a decimal. Varsity suggests the 91-day Treasury bill yield. We use r = 5.52%, the 91-day T-bill cut-off yield shown on RBI's homepage on 2 Oct 2026 (the RBI policy repo rate is 5.25%).
- \(x\)
- Calendar days from today to expiry. \(x/365\) turns it into a fraction of a year.
- \(T\)
- The same time to expiry in years, \(x/365\).
- \(d\)
- Dividends per share (in ₹, or index points for an index) expected to go ex before expiry. Zero if there are none.
- \(t_d\)
- Time from today until the dividend, in years.
- \(e^{rT}\)
- \(e \approx 2.718\) is the base of continuous compounding (interest added every instant). \(e^{rT}\) is the growth factor for rate \(r\) over \(T\) years, very close to \(1 + rT\) for short periods.
- Basis
- Futures minus spot. Positive means futures trade at a premium.
- Implied carry
- The yearly interest rate the market price is implying: the basis as a % of spot, scaled up from \(x\) days to a full year.
- Fair value: add to spot the interest you would earn on that money until expiry, \(S \times r \times x/365\), then subtract any dividend you would miss by holding futures instead of shares.
- The continuous form does the same with a slightly different compounding rule. The two forms differ by only a fraction of a rupee over one to three months.
- Basis is the gap you actually see in the market. Implied carry turns that gap into a yearly rate so you can compare it with \(r\). If it is close to \(r\), the futures price is close to fair value.
Fair value, step by step
- Spot \(S\) = 22,620.45 (Nifty close). Days to expiry \(x\) = 30 Sep → 27 Oct = 27. \(r\) = 5.52%. Ignore dividends for now (\(d\) = 0).
- \(F = 22{,}620.45 \times (1 + 0.0552 \times 27/365) = 22{,}620.45 \times 1.004083 = \) 22,712.82.
- Continuous form: \(22{,}620.45 \times e^{0.0552 \times 27/365} =\) 22,713.00 (only 0.18 points different).
- Actual settlement price: 22,707.30, which is 5.52 points (0.02%) below fair value. Basis = 22,707.30 − 22,620.45 = +86.85 points. Implied carry = (22,707.30/22,620.45 − 1) × 365/27 = 5.19% p.a., slightly below the T-bill rate. That is consistent with a small dividend yield on the index and with trading costs.
11.2 Fair value vs actual for NIFTY and three stocks (30 Sep 2026)
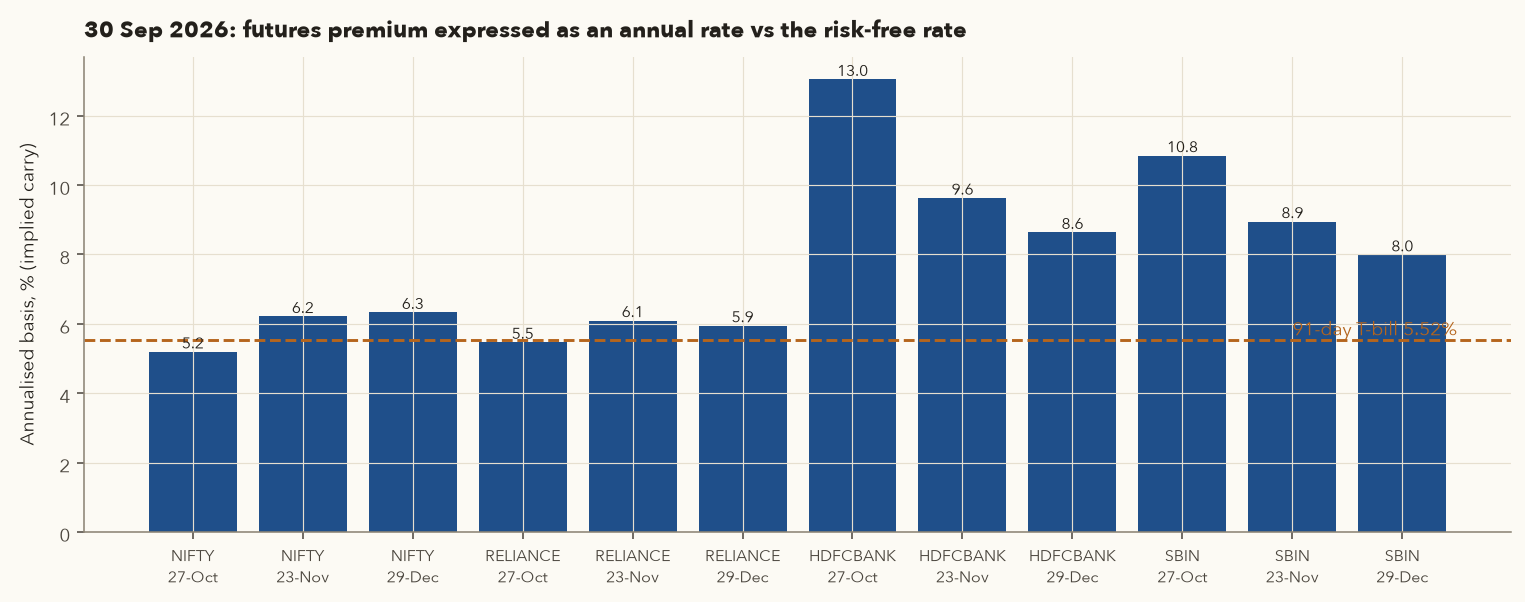
| Contract | Days to expiry | Spot | Fair value \(S(1+r\,x/365)\) | Fair value \(Se^{rT}\) | Actual (settle) | Actual − fair | Basis | Implied carry % p.a. |
|---|---|---|---|---|---|---|---|---|
| NIFTY 27-Oct | 27 | 22,620.45 | 22,712.82 | 22,713.00 | 22,707.30 | -5.52 | +86.85 | 5.19 |
| NIFTY 23-Nov | 54 | 22,620.45 | 22,805.18 | 22,805.94 | 22,828.30 | +23.12 | +207.85 | 6.21 |
| NIFTY 29-Dec | 90 | 22,620.45 | 22,928.34 | 22,930.44 | 22,973.40 | +45.06 | +352.95 | 6.33 |
| RELIANCE 27-Oct | 27 | 1,187.00 | 1,191.85 | 1,191.86 | 1,191.80 | -0.05 | +4.80 | 5.47 |
| RELIANCE 23-Nov | 54 | 1,187.00 | 1,196.69 | 1,196.73 | 1,197.70 | +1.01 | +10.70 | 6.09 |
| RELIANCE 29-Dec | 90 | 1,187.00 | 1,203.16 | 1,203.27 | 1,204.40 | +1.24 | +17.40 | 5.94 |
| HDFCBANK 27-Oct | 27 | 708.71 | 711.60 | 711.61 | 715.55 | +3.95 | +6.84 | 13.05 |
| HDFCBANK 23-Nov | 54 | 708.71 | 714.50 | 714.52 | 718.80 | +4.30 | +10.09 | 9.62 |
| HDFCBANK 29-Dec | 90 | 708.71 | 718.36 | 718.42 | 723.80 | +5.44 | +15.09 | 8.64 |
| SBIN 27-Oct | 27 | 959.50 | 963.42 | 963.43 | 967.20 | +3.78 | +7.70 | 10.85 |
| SBIN 23-Nov | 54 | 959.50 | 967.34 | 967.37 | 972.20 | +4.86 | +12.70 | 8.95 |
| SBIN 29-Dec | 90 | 959.50 | 972.56 | 972.65 | 978.40 | +5.84 | +18.90 | 7.99 |
How to read the table:
- NIFTY and RELIANCE sit almost exactly on fair value. RELIANCE Oct is 0.05 below its 1,191.85 fair value. These are the most arbitraged contracts in India, so this is the cost-of-carry model working.
- HDFCBANK and SBIN trade a few rupees rich (₹3.78–5.84 above fair). That is about 0.4–0.8% of price, and it looks large when annualised over only 27 days. Possible reasons: strong demand to go long through futures, the cost and capital needed to arbitrage (next subsection), and timing noise. The futures settlement price is a last-30-minute average while the spot price is the closing price, so a one-rupee gap becomes ~1.9% p.a. when annualised over 27 days.
- Farther expiries carry a larger basis (more days of carry). The NIFTY Dec contract also shows a bigger % gap from fair value, partly because it is thinly traded (1,370 contracts of OI vs 2,77,155 for Oct).
11.3 Dividends make futures cheaper: MARUTI, August 2026
The \(-d\) in the formula matters when a stock goes ex-dividend before the contract expires. The holder of shares gets the dividend and the futures holder doesn't, so futures trade lower by roughly the dividend. MARUTI went ex-dividend on 7 Aug 2026 for ₹140 per share. Watch what happened to the basis:
| Date | Contract | Spot | Days | Fair, no dividend | Fair, minus ₹140 dividend | Actual futures | Basis |
|---|---|---|---|---|---|---|---|
| 2026-08-05 | MARUTI 25-Aug | 14,189.96 | 20 | 14,232.88 | 14,092.88 | 14,034.00 | -155.96 |
| 2026-08-06 | MARUTI 25-Aug | 14,079.66 | 19 | 14,120.12 | 13,980.12 | 13,915.00 | -164.66 |
| 2026-08-07 | MARUTI 25-Aug | 14,037.03 | 18 | 14,075.24 | 14,075.24 | 14,018.00 | -19.03 |
| 2026-08-05 | MARUTI 29-Sep | 14,189.96 | 55 | 14,307.99 | 14,167.99 | 14,125.00 | -64.96 |
| 2026-08-06 | MARUTI 29-Sep | 14,079.66 | 54 | 14,194.64 | 14,054.64 | 14,001.00 | -78.66 |
| 2026-08-07 | MARUTI 29-Sep | 14,037.03 | 53 | 14,149.54 | 14,149.54 | 14,103.00 | +65.97 |
- On 5 and 6 Aug, both MARUTI contracts traded below spot (Aug contract basis −156 and −165). That is backwardation, and the cause is the ₹140 dividend: subtract it and the fair values (14,092.88 and 13,980.12) are much closer to the actual prices.
- On the ex-date (7 Aug), spot no longer included the dividend, and the Aug basis jumped from −164.66 to −19.03. Spot fell 42.63 that day while the Aug futures rose 103. The futures had already priced the dividend in.
- Lesson: never mistake a dividend discount for a bearish signal, and never buy spot / sell futures "for the basis" without checking the corporate-action calendar.
11.4 Basis converges to zero at expiry
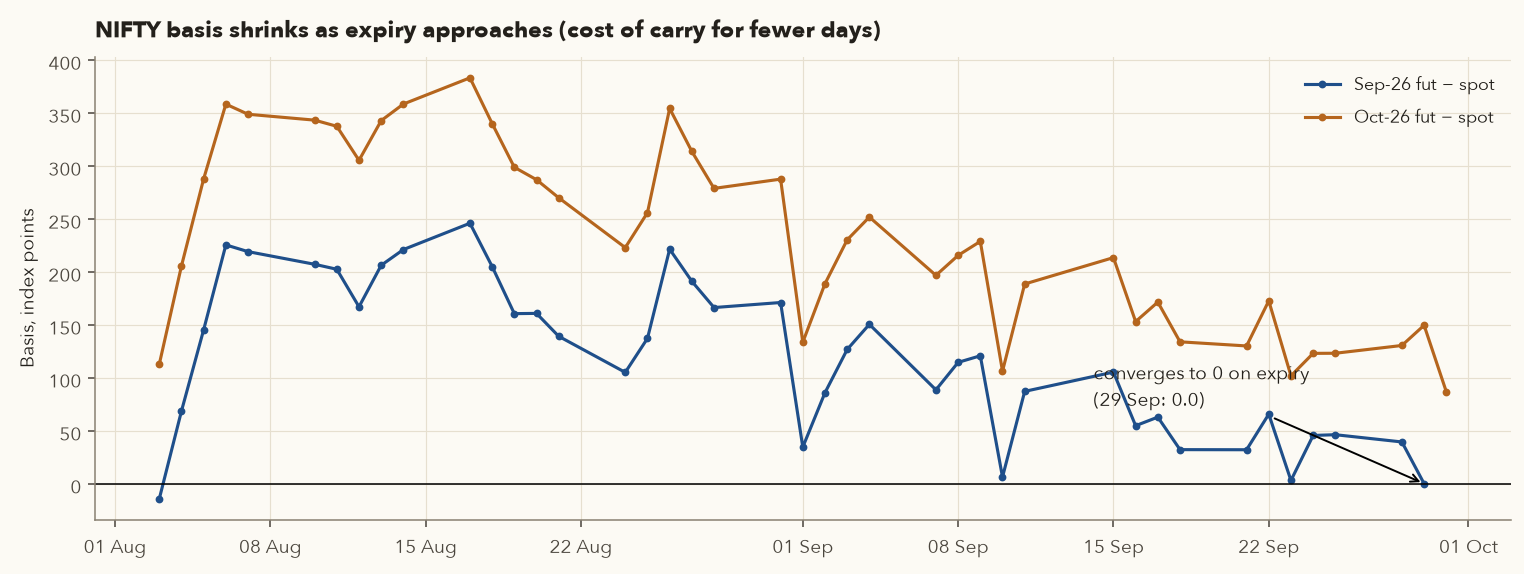
As expiry approaches, there are fewer days of interest left, so the basis shrinks. On expiry day futures and spot must converge, because index futures settle at the closing index value and stock futures settle through delivery. The NIFTY Oct contract's basis was mostly 250–380 points in mid-August (about 70–85 days of carry) and 86.8 points on 30 Sep (27 days). Day to day it is noisy: on 3 Aug it was only 112.8. The Sep contract's basis was exactly 0 at its 29 Sep final settlement.
11.5 Premium, discount, contango, backwardation
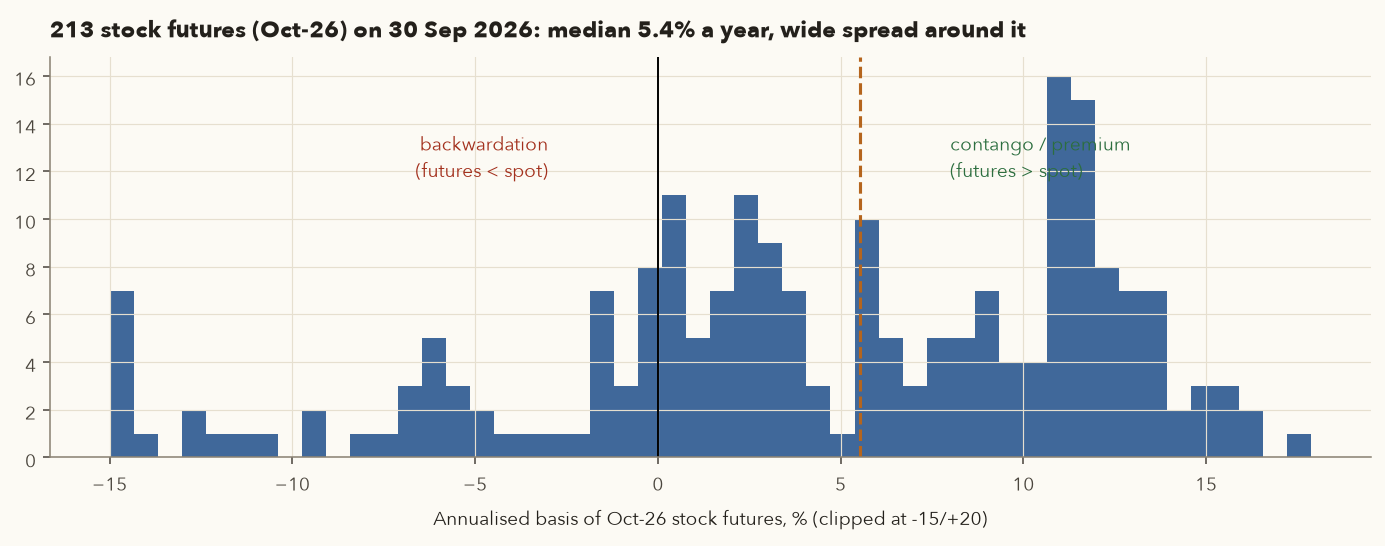
| Situation | Equity term | Commodity term | Typical cause |
|---|---|---|---|
| Futures > spot | Premium | Contango | Normal: interest cost of carry |
| Futures < spot | Discount | Backwardation | Dividend before expiry, heavy short demand, or (in commodities) scarcity |
11.6 Cash-and-carry arbitrage (and why it is not free money)
If futures trade above fair value, you can buy spot and sell futures at the same time. At expiry the two converge, so you lock in the gap whatever the market does. This is cash-and-carry arbitrage, and it is what keeps futures near fair value. A real check:
Is HDFCBANK's rich basis an opportunity?
- Buy 650 shares at spot 708.71 (cash needed ₹4,60,662) and sell 1 lot of Oct futures at 715.55. Locked gross spread = (715.55 − 708.71) × 650 = ₹4,446.
- Financing: that ₹4,60,662 could have earned 5.52% for 27 days = ₹1,881.
- Securities transaction tax (STT, a government levy on every trade; Section 16.3) alone: 0.1% on buying the delivery shares + 0.1% on the delivery at expiry + 0.05% on the futures sale ≈ ₹1,158.
- Net before brokerage, exchange charges, stamp duty, GST, DP charges and margin funding ≈ 4,446 − 1,881 − 1,158 = ₹1,407, about 0.3% on ₹4.6 lakh for a month of capital and execution risk. Professional desks with very low costs can do this. For a retail trader it rarely pays.
framework.futures.fair_value(spot, r, days, div=0) returns the cost-of-carry fair value and framework.futures.basis the basis. Use them to check, before a trade, whether a futures price is distorted by a dividend or an unusual premium.
12. Calendar spreads
A calendar spread is long one expiry and short another expiry of the same underlying. Because the two legs move almost together, the position's risk (and margin) is far smaller. You are betting only on the difference between the two prices. In theory that difference is the cost of carry between the two expiry dates:
- \(F_{\text{far}}\)
- The price of the later-expiring contract (for example Oct when the other leg is Sep).
- \(F_{\text{near}}\)
- The price of the earlier-expiring contract.
- \(S\)
- Today's spot price.
- \(r\)
- The yearly risk-free rate as a decimal (5.52% here).
- \(x_{\text{far}} - x_{\text{near}}\)
- Calendar days between the two expiry dates.
- dividends between the two expiries
- Dividends (₹ per share, or index points) going ex after the near expiry but before the far one.
How it works: each contract's fair value is spot plus interest to its own expiry (Section 11). Subtract one from the other and only the interest for the days between the expiries is left, less any dividend in that gap. If the market spread is much wider or narrower than this, a spread trader may bet on it returning to theory.
Theory vs market
- 28 Sep 2026: Oct 22,910.7 − Sep 22,819.6 = 91.1 points. Theory: 22,780.25 × 5.52% × 28/365 = 96.5 points. The market was 5.4 points below theory.
- Over Aug–Sep the Oct−Sep spread ranged from 142.5 points (5 Aug) to 76.9 points (25 Sep). That is noise around a slowly falling theoretical value, partly because Nifty itself fell (a lower spot means a smaller carry).
- On 30 Sep, Nov − Oct = 121.0 points vs a theoretical 92.4. A spread trader expecting this to normalise would sell Nov and buy Oct. The risk is that the gap persists or widens.
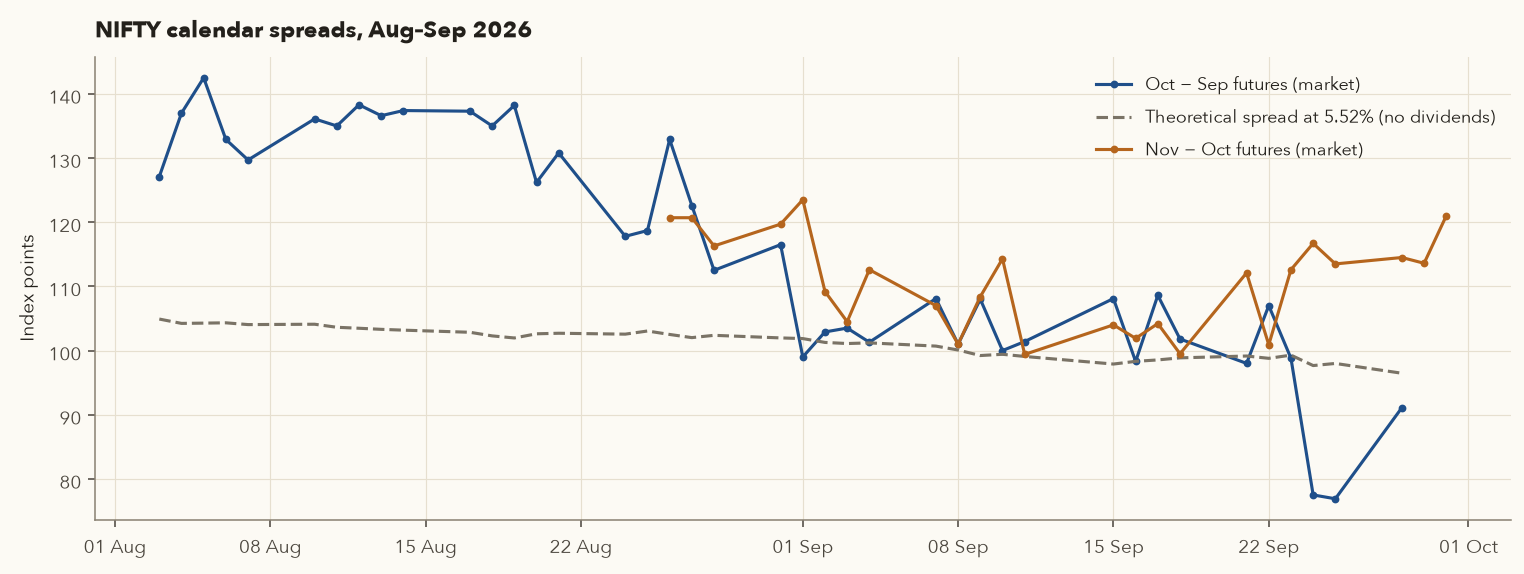
The margin benefit disappears on the day the near leg expires: for index derivatives since Feb 2025, and for single-stock calendar spreads from 5 May 2026. Zerodha's illustration of the stock rule showed one spread's margin jumping from about ₹26,000 per lot to about ₹2.6 lakh (about ₹1.3 lakh for each leg). Spreads also suffer from the illiquidity of far-month contracts. For a beginner, calendar spreads are mainly useful for understanding rollover cost (Section 14).
13. Open interest and the four buildups
13.1 What open interest is
Open interest (OI) is the number of contracts that are currently open: entered and not yet squared off or expired. Every contract has one long and one short, so OI counts pairs. OI rises only when a new buyer and a new seller both open positions. It falls when an existing long and an existing short both close. It stays the same when an existing holder simply passes the position to a new trader.
How OI and volume evolve
| Day | Trade | Volume | OI after | Why |
|---|---|---|---|---|
| 1 | A buys 1 from B (both new) | 1 | 1 | New long + new short |
| 2 | C buys 2 from D (both new) | 2 | 3 | Two new pairs added |
| 3 | A sells 1 to E (A exits, E new) | 1 | 3 | Position transferred: OI unchanged |
| 4 | C sells 2 to D (both closing) | 2 | 1 | Two pairs closed |
Volume restarts from zero every day and counts each trade once (one buy + one sell = 1). OI is a running stock carried from day to day. On 30 Sep 2026, NIFTY futures volume was 66,539 contracts across all expiries, while OI was 3,11,084 contracts.
In the bhavcopy, OpnIntrst is reported in units (shares or index units), so divide by lot size to get contracts. When you study OI over a month, add up all expiries. Otherwise rollover (Section 14) looks like a huge OI collapse in one contract and a surge in the next.
13.2 Reading OI with price
On its own OI tells you nothing about direction, because every long has a short. Paired with price, it hints at who is acting:
| Price | OI | Interpretation | Logic |
|---|---|---|---|
| Up | Up | Long buildup | New money is buying aggressively. Fresh longs are pushing price up. |
| Down | Up | Short buildup | New money is selling aggressively. Fresh shorts are pushing price down. |
| Up | Down | Short covering | Shorts are buying back to exit. The rise may lack fresh buying. |
| Down | Down | Long unwinding | Longs are selling to exit. The fall may lack fresh selling. |
Varsity also gives a companion table for volume with price. Rising price on rising volume is bullish. Falling price on rising volume is bearish. Price moves on falling volume suggest the trend may be tiring. And it warns that abnormally high OI built up during a fast move signals heavy leverage: a small trigger can then cause a violent unwind.
- \(t\), \(k\)
- \(t\) is the day you measure on. \(k\) is the look-back in trading days: \(k = 1\) compares with yesterday; for the 31 Aug → 28 Sep example below, \(k = 19\) sessions.
- \(P_t\)
- The spot (underlying) close on day \(t\).
- \(\Delta P\)
- The % change in price over the window (\(\Delta\) means "change in"), as a decimal.
- \(OI_t\)
- Open interest on day \(t\) in one contract month.
- \(\sum_{\text{expiries}}\)
- Add up OI across all live expiries (near, next and far), so rollover from one month to the next does not look like a collapse.
- \(\Delta OI\)
- The % change in that total OI over the window.
- \(\operatorname{sign}\)
- Just the direction: "up" if the change is positive, "down" if negative.
- Compute the % change in price and the % change in total OI over the same window.
- Keep only whether each one went up or down.
- Look up the pair in the table above: up/up = long buildup, down/up = short buildup, up/down = short covering, down/down = long unwinding. If either change is exactly zero, call it neutral.
A textbook short buildup
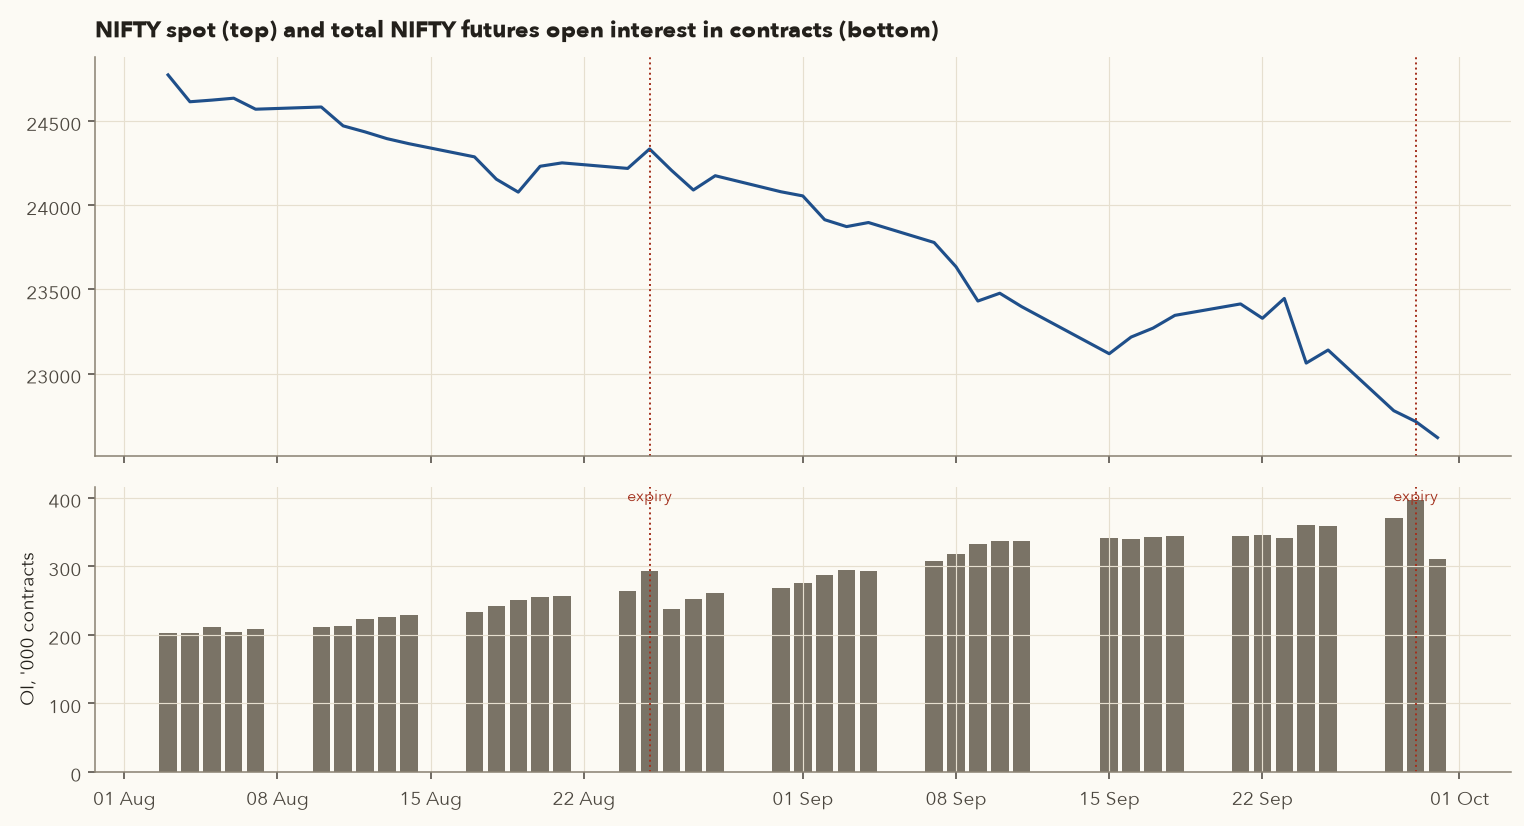
- Nifty spot: 24,080.40 → 22,780.25, a change of −5.40%.
- Total NIFTY futures OI (all expiries): 2,68,815 → 3,69,942 contracts, a change of +37.62%.
- Price down + OI up = short buildup. Traders added fresh shorts as the index fell. BANKNIFTY was the same: −6.12% price, +36.46% OI.
- After the Sep expiry on 29 Sep, OI dropped to 3,11,084 contracts on 30 Sep, because positions not rolled over were settled.
13.3 All stock futures, September 2026 series
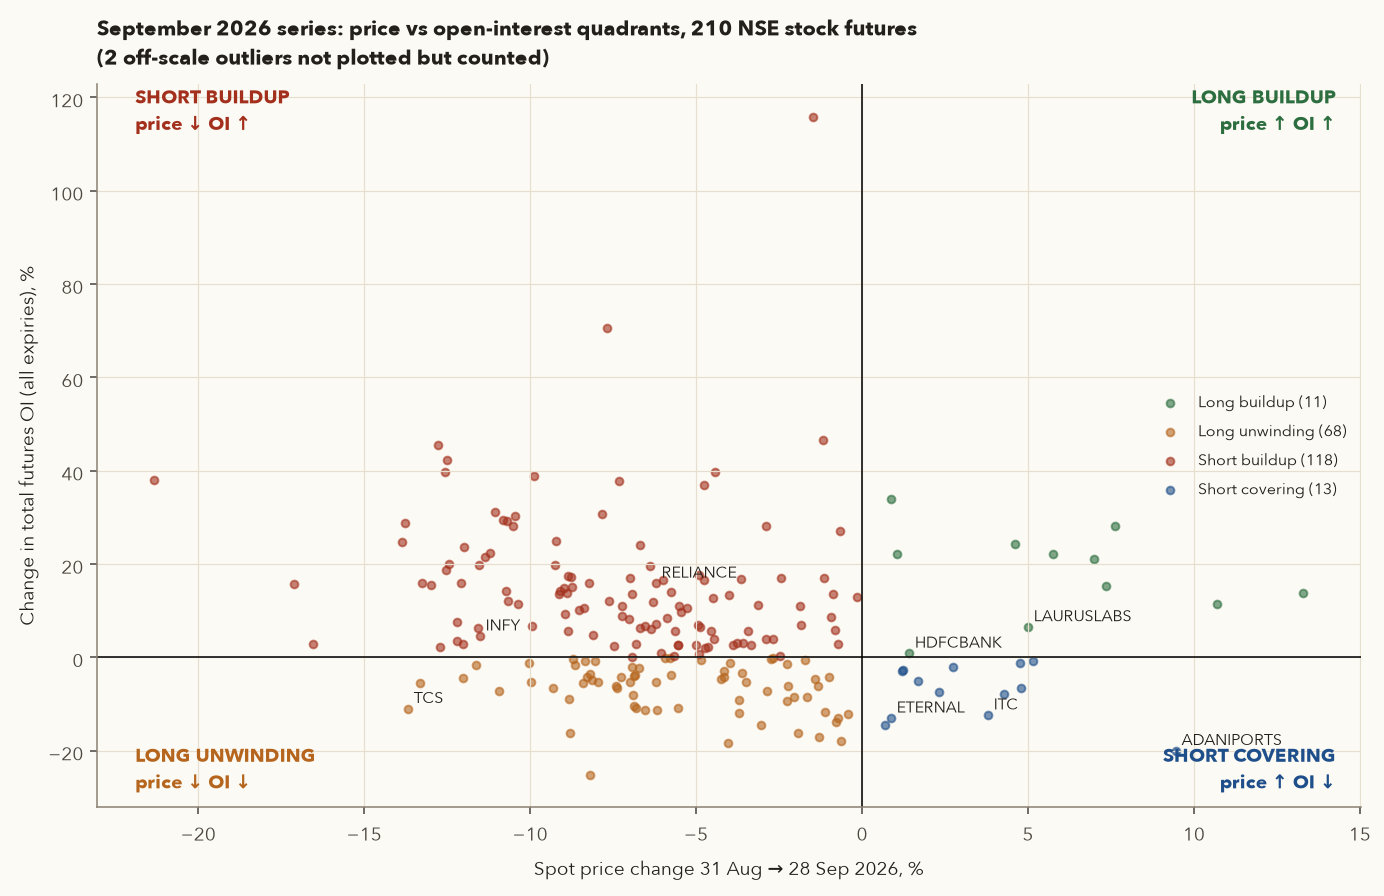
Classifying the 210 stock futures by price change and total-OI change from 31 Aug to 28 Sep gives: Short buildup 118, Long unwinding 68, Short covering 13, Long buildup 11. This was a falling market, so most stocks were on the left of the chart. Clear examples from each quadrant:
- Long buildup: DRREDDY price +5.8%, OI +22.0%. BLUESTARCO +7.6%, OI +28.2%.
- Short buildup: POLICYBZR −38.6%, OI +165.0%. HAVELLS −12.8%, OI +45.4%.
- Short covering: ADANIPORTS +9.5%, OI −20.1%. ITC +3.8%, OI −12.4%.
- Long unwinding: TCS −13.7%, OI −11.1%. ASIANPAINT −8.8%, OI −16.3%.
13.4 Honest test: does the daily buildup predict tomorrow?
Many websites publish daily "long buildup" lists as trading signals. We tested that on our data: every stock-futures day in Aug–Sep 2026 (excluding expiry days, when OI falls mechanically), classified by that day's price and total-OI change, then looked at the next day's spot return.
| Daily signal (stock futures) | Observations | Avg next-day return | % of next days up |
|---|---|---|---|
| Long buildup | 1,634 | -0.402% | 38.0% |
| Long unwinding | 1,734 | -0.092% | 46.0% |
| Neutral | 41 | -0.313% | 41.5% |
| Short buildup | 2,687 | -0.050% | 47.5% |
| Short covering | 1,644 | -0.288% | 36.7% |
Across all observations, 42.8% of next days were up (the market was falling). "Long buildup" days were followed by an up day only 38.0% of the time, worse than average. "Short buildup" days were followed by up days 47.5% of the time, better than average. If anything, in this sample one-day buildups showed a slight short-term mean reversion, not continuation. Two months of one falling market proves nothing in general. But it is enough to show that OI buildup is context, not a signal. Use it to understand whether a move is driven by new positions or by exits, and combine it with price structure (Chapters 3–5).
When a stock's market-wide open interest exceeds 95% of its market-wide position limit (MWPL), the stock enters a ban period. You may only reduce positions, not add new ones. SEBI's 2025 changes measure this in delta-adjusted "future-equivalent OI" and set MWPL from free float and cash-market volume. Check the exchange's ban list before carrying a stock-futures position.
framework.futures.oi_buildup(price_chg, oi_chg) returns 'Long buildup', 'Short buildup', 'Short covering' or 'Long unwinding'. Feed it the sum of OI over all expiries. framework.futures.oi_buildup_table(fut, date, prev_date=None) classifies every symbol this way, from the spot change and total OI. Pass prev_date="2026-08-31" with date="2026-09-28" to reproduce Section 13.3.
14. Expiry, rollover and physical settlement
14.1 Rollover
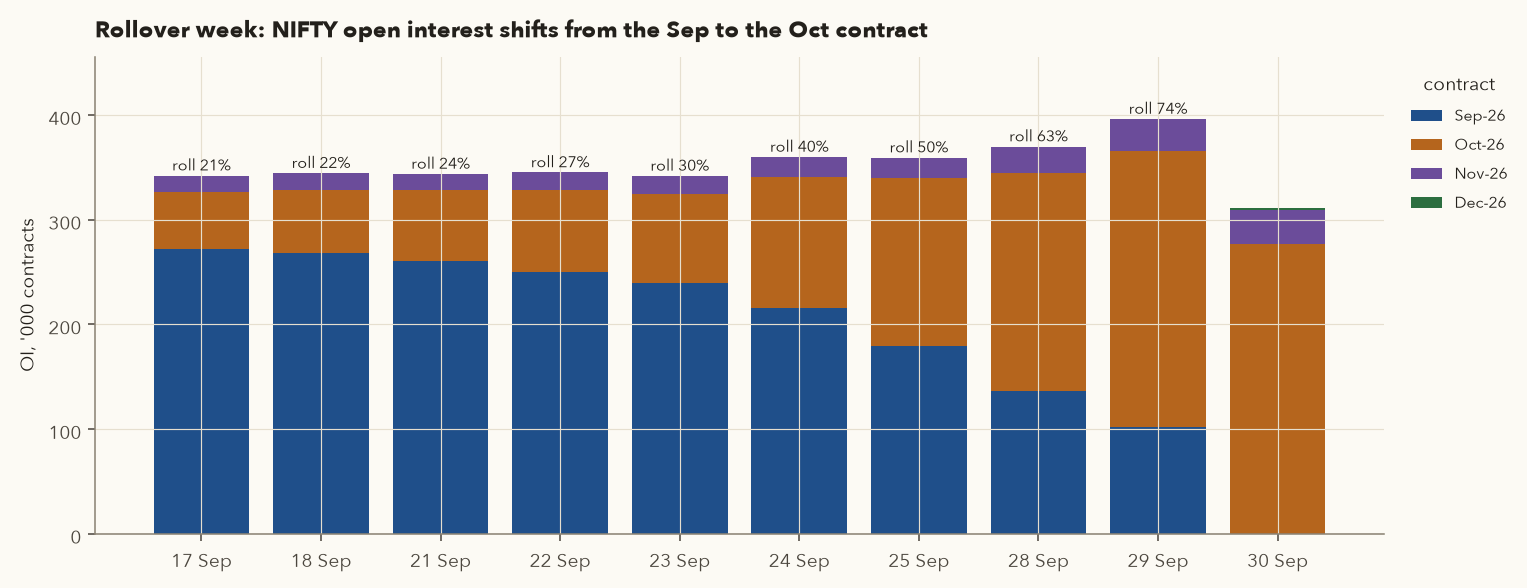
Futures expire monthly, but a positional view may last longer. Rolling over means closing the expiring contract and opening the same position in the next month. Most traders roll in the last few days. The rollover % tells you how much of the expiring OI was carried forward:
- \(OI_{\text{near}}\)
- Open interest in the expiring (near-month) contract. Units or contracts both work, as long as all three use the same.
- \(OI_{\text{next}}\), \(OI_{\text{far}}\)
- Open interest in the next-month and far-month contracts.
- Rollover %
- The share of total OI that already sits in later months. Usually tracked over the last few days before expiry; the figure on expiry day is the one quoted and compared month to month.
- \(F_{\text{next}}\), \(F_{\text{near}}\)
- The prices at which you buy the next-month contract and sell the expiring one, in ₹ or index points.
- Rollover cost
- The extra you pay, in ₹ per lot, to move a long position forward by one month (before transaction costs).
- Rollover %: add up OI in the next and far months and divide by OI in all three months. A high figure means most positions are being carried forward, not closed.
- Rollover cost: the spread between the two months, times the lot size. A long pays it; a short receives it. Multiply by the number of lots for a bigger position.
Example (NIFTY, 29 Sep, table below, OI in units): \((1{,}71{,}35{,}235 + 19{,}99{,}465) / (66{,}23{,}305 + 1{,}71{,}35{,}235 + 19{,}99{,}465) = 1{,}91{,}34{,}700 / 2{,}57{,}58{,}005 = 74.3\%\).
| Underlying | Date | Sep OI (units) | Oct OI | Nov OI | Rollover % |
|---|---|---|---|---|---|
| NIFTY | 24-Sep | 1,40,23,100 | 81,60,295 | 12,18,360 | 40.1 |
| NIFTY | 28-Sep | 88,52,025 | 1,35,41,970 | 16,52,235 | 63.2 |
| NIFTY | 29-Sep | 66,23,305 | 1,71,35,235 | 19,99,465 | 74.3 |
| BANKNIFTY | 24-Sep | 17,72,310 | 8,60,100 | 99,690 | 35.1 |
| BANKNIFTY | 28-Sep | 9,91,260 | 17,81,610 | 1,34,130 | 65.9 |
| BANKNIFTY | 29-Sep | 6,31,110 | 22,60,320 | 1,59,360 | 79.3 |
| RELIANCE | 24-Sep | 8,33,99,000 | 6,36,63,000 | 85,71,000 | 46.4 |
| RELIANCE | 28-Sep | 2,62,14,000 | 12,21,33,500 | 1,22,64,000 | 83.7 |
| RELIANCE | 29-Sep | 1,08,54,500 | 14,63,82,000 | 1,47,46,500 | 93.7 |
| HDFCBANK | 24-Sep | 19,67,98,550 | 19,06,89,850 | 1,38,29,400 | 51.0 |
| HDFCBANK | 28-Sep | 7,02,53,300 | 31,36,97,150 | 1,94,88,950 | 82.6 |
| HDFCBANK | 29-Sep | 2,89,43,850 | 36,53,59,800 | 2,42,91,800 | 93.1 |
| INFY | 24-Sep | 5,36,00,400 | 2,41,31,600 | 11,22,000 | 32.0 |
| INFY | 28-Sep | 1,94,50,000 | 5,97,68,000 | 15,83,600 | 75.9 |
| INFY | 29-Sep | 86,00,400 | 7,26,22,800 | 19,13,200 | 89.7 |
| TCS | 24-Sep | 1,74,33,675 | 1,08,18,000 | 5,23,350 | 39.4 |
| TCS | 28-Sep | 33,34,275 | 2,42,78,400 | 7,23,825 | 88.2 |
| TCS | 29-Sep | 19,12,050 | 2,70,64,125 | 8,89,875 | 93.6 |
| SBIN | 24-Sep | 6,18,09,000 | 4,38,20,250 | 60,74,250 | 44.7 |
| SBIN | 28-Sep | 2,18,02,500 | 8,64,81,000 | 71,80,500 | 81.1 |
| SBIN | 29-Sep | 1,62,81,750 | 9,97,40,250 | 81,30,750 | 86.9 |
| ICICIBANK | 24-Sep | 6,83,53,600 | 5,06,88,400 | 59,97,600 | 45.3 |
| ICICIBANK | 28-Sep | 2,23,83,900 | 11,14,76,400 | 65,90,500 | 84.1 |
| ICICIBANK | 29-Sep | 2,18,16,900 | 12,50,41,000 | 69,77,600 | 85.8 |
Rolling a NIFTY long from Sep to Oct
- Sell Sep at 22,819.6 and buy Oct at 22,910.7 (settlement prices on 28 Sep). The spread paid = 91.1 points.
- As a % of price: 91.1 / 22,819.6 = 0.399%. Annualised over the 28 days between expiries: 0.399% × 365/28 = 5.2% p.a., roughly the interest rate, as the cost-of-carry model predicts.
- In rupees: 91.1 × 65 = ₹5,922 per lot, plus transaction costs on four legs (two closes and two opens). A long pays the carry. A short receives it, because they sell the dearer contract.
- RELIANCE the same day: Sep 1,200.6 → Oct 1,206.6, a roll cost of 6.0 × 500 = ₹3,000 per lot.
Reading rollover: a high rollover with price falling (as with NIFTY in September, combined with short buildup) means traders are carrying bearish positions into the next month. A low rollover means traders are closing out. Compare it with the previous month's figure: NIFTY's Aug rollover was 77.4% vs 74.3% in Sep, and RELIANCE's 94.7% vs 93.7%.
14.2 Physical settlement of stock futures
Since the October 2019 expiry, all stock F&O contracts are physically settled. If you hold a stock future at expiry:
- Long futures: you must take delivery and pay the full contract value. 1 lot of RELIANCE at the Sep final settlement (1,182.01 × 500) = ₹5,91,005.
- Short futures: you must deliver the shares. If you don't have them, you face an auction and penalties.
- SEBI mandated this (circular of April 2018, phased in) to curb excessive speculation and expiry-day manipulation by forcing positions to be backed by real cash or shares.
- Margins rise near expiry. Zerodha's policy, for example, raises the margin on stock futures and short options on expiry day to 50% of contract value or 1.5× NRML margin, whichever is lower. Brokers may square off positions that lack the funds, and charge a fee for it.
Square off or roll every stock-futures position at least 2–3 trading days before expiry. Never let a stock future go into physical settlement by accident. Index futures (NIFTY, BANKNIFTY) are cash-settled, but they still expire, so roll them deliberately, not by habit.
framework.futures.rollover_pct computes the rollover % above from framework.data.load_futures().
15. Hedging with futures and beta
15.1 What hedging is, and what it can't do
A hedge is a position that gains when your main position loses, so the combination is less volatile. With futures, you hedge a long stock holding by shorting futures. Typical reasons: you hold shares long-term but fear a short-term event (budget, election results, a global shock). Selling would trigger capital-gains tax and force you to time your re-entry.
Varsity separates two kinds of risk:
- Systematic (market) risk: moves that hit all stocks together (interest rates, elections, global sell-offs). It can be hedged with index futures.
- Unsystematic (company) risk: news specific to one company (results, fraud, management change). It cannot be hedged with index futures. It can only be reduced by diversification, and Varsity notes the benefit of adding more stocks fades after about 20 stocks.
15.2 Hedging a single stock with its own futures
500 shares hedged with 1 lot of RELIANCE Sep futures
- Hold 500 shares at spot 1,277.0. Short 1 lot (500) of Sep futures at 1,301.1. The basis on 31 Aug was unusually wide at 24.1.
- 28 Sep: spot 1,197.6 and futures 1,200.6.
- Shares: (1,197.6 − 1,277.0) × 500 = −₹39,700. Short futures: (1,301.1 − 1,200.6) × 500 = +₹50,250.
- Net +₹10,550, exactly the narrowing of the basis (24.1 → 3.0 = 21.1 × 500). The hedge removed the price risk. What remained was basis risk, which this time happened to be favourable.
15.3 Beta: how much a stock moves with the market
To hedge with index futures you need to know how sensitive each stock is to the index. That sensitivity is beta: the slope of a regression of the stock's daily returns on the index's daily returns.
- \(R_{\text{stock}}\)
- The stock's daily returns: each day's % change in closing price, one number per day (247 days here).
- \(R_{\text{Nifty}}\)
- The Nifty 50's daily returns over the same days.
- \(\operatorname{Cov}\)
- Covariance: how much the two return series move together. Positive if the stock tends to rise on days the Nifty rises.
- \(\operatorname{Var}\)
- Variance: how much the Nifty's daily returns spread out around their average.
- \(\beta\)
- Beta: the stock's average % move for a 1% move in the Nifty.
How it works: line up the two columns of daily returns, then divide their covariance by the variance of the Nifty column. The result is the slope of the best-fit line through a scatter of stock returns against Nifty returns, which is exactly what Excel's SLOPE function returns. Chapter 8 uses the same formula on weekly returns.
The market's own beta is 1.0. β > 1 means the stock tends to move more than the index (high beta). β < 1 means it moves less (low beta). Using daily returns from 1 Sep 2025 to 31 Aug 2026 (247 days), our data gives: LT 1.43, HDFCBANK 1.26, TATASTEEL 1.12, SBIN 1.06, ICICIBANK 0.94, RELIANCE 0.89, TCS 0.86, INFY 0.79, HINDUNILVR 0.74, ITC 0.65, BHARTIARTL 0.63.
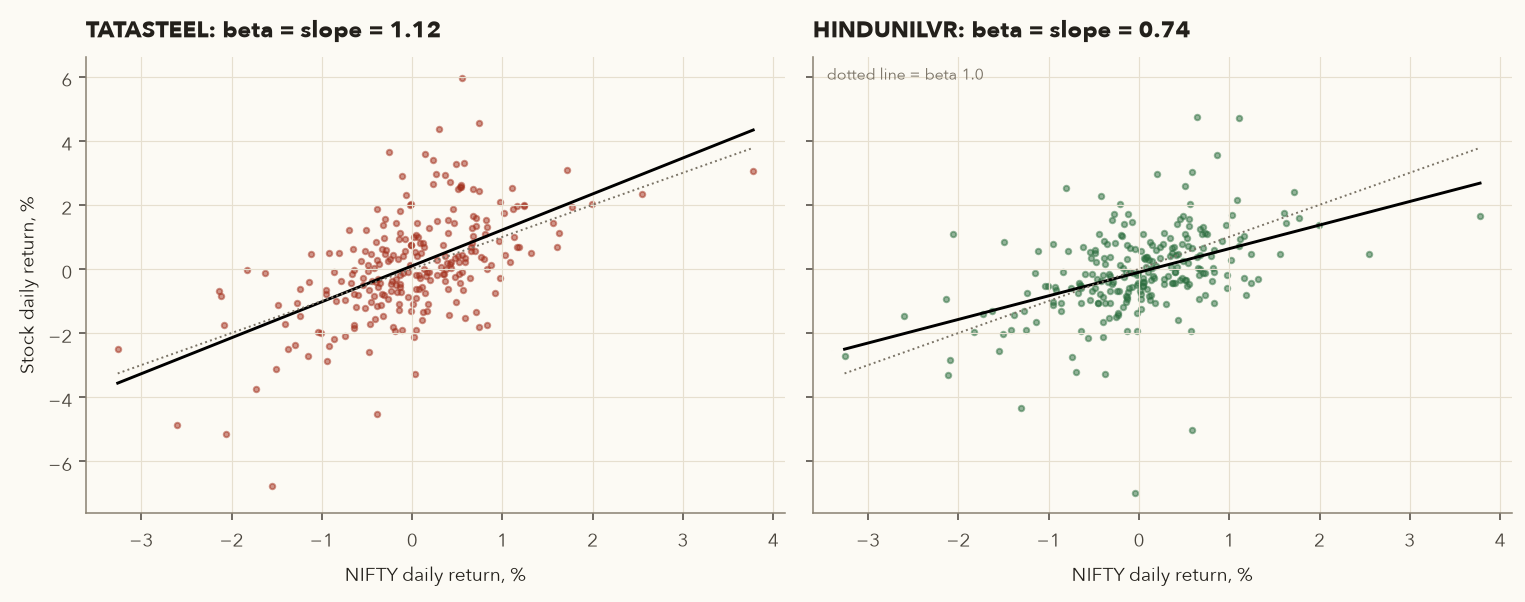
Beta has limits. It is estimated from the past, it changes over time, and correlations are often modest (INFY's correlation with Nifty was only 0.35 over this year). Treat it as an estimate, not a constant.
15.4 Hedging a portfolio with NIFTY futures
- \(i\)
- Labels each stock in the portfolio. \(\sum_i\) means add up over all the stocks.
- \(w_i\)
- Stock \(i\)'s weight: its market value ÷ total portfolio value. The weights add up to 1 (100%).
- \(\beta_i\)
- Stock \(i\)'s beta against the Nifty (formula above).
- \(\beta_p\)
- The portfolio's beta: the weighted average of the stock betas.
- \(V_{\text{portfolio}}\)
- Total market value of the portfolio today, in ₹.
- Hedge value
- The rupee amount of Nifty exposure that moves like your portfolio, in ₹.
- \(F_{\text{Nifty}}\)
- The NIFTY futures price you short at.
- lot size
- Units per NIFTY contract (65). \(F_{\text{Nifty}} \times\) lot size is the value of one lot.
- Multiply each stock's weight by its beta and add them up to get the portfolio beta.
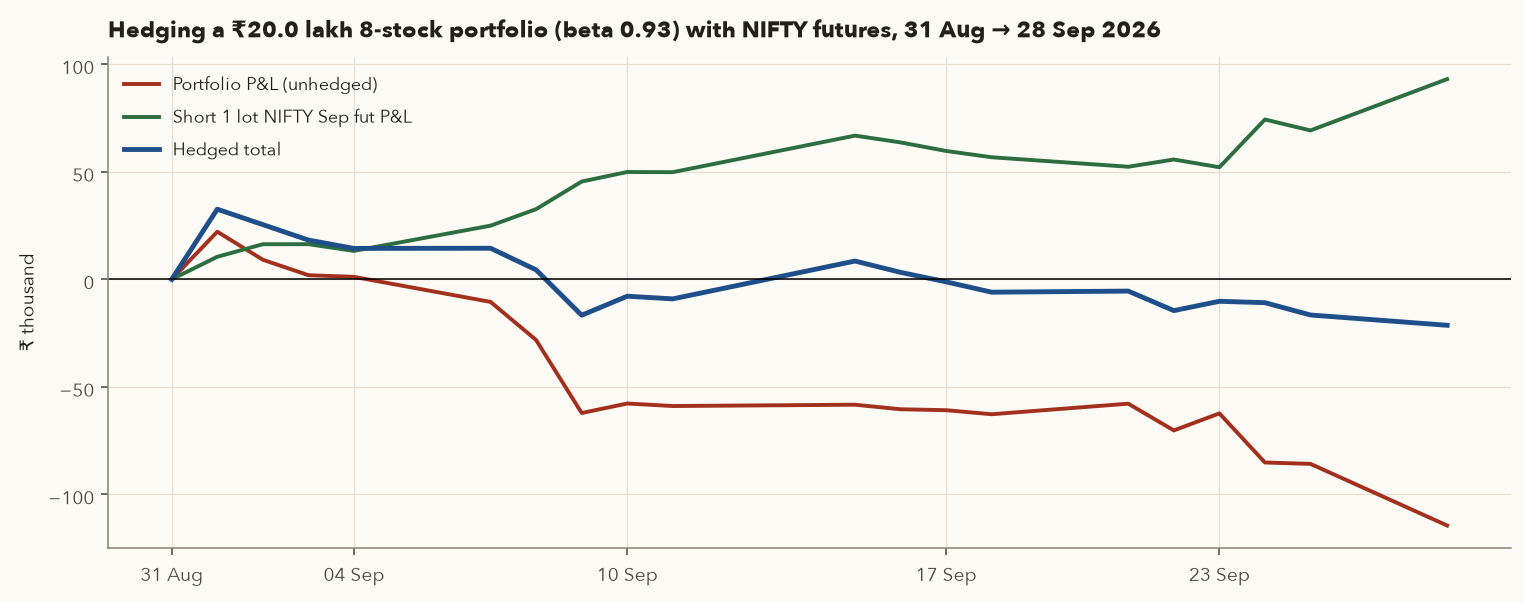
- Multiply the portfolio value by that beta. A ₹20 lakh portfolio with beta 0.93 behaves roughly like ₹18.6 lakh of Nifty.
- Divide by the value of one NIFTY futures lot to get the number of lots to short. You can only trade whole lots, so round, and accept that the hedge will be a little over or under.
Eight large caps, hedged with NIFTY Sep futures
| Stock | Qty | Price 31 Aug | Value 31 Aug ₹ | Weight | Beta | Weighted beta | Price 28 Sep | P&L ₹ |
|---|---|---|---|---|---|---|---|---|
| RELIANCE | 196 | 1,277.00 | 2,50,292 | 12.5% | 0.89 | 0.112 | 1,197.60 | −15,562 |
| HDFCBANK | 353 | 709.00 | 2,50,277 | 12.5% | 1.26 | 0.158 | 719.05 | 3,548 |
| ICICIBANK | 172 | 1,454.00 | 2,50,088 | 12.5% | 0.94 | 0.117 | 1,302.00 | −26,144 |
| INFY | 220 | 1,133.80 | 2,49,436 | 12.5% | 0.79 | 0.098 | 1,003.20 | −28,732 |
| TCS | 104 | 2,399.30 | 2,49,527 | 12.5% | 0.86 | 0.108 | 2,070.70 | −34,174 |
| LT | 62 | 4,044.90 | 2,50,784 | 12.5% | 1.43 | 0.179 | 3,766.40 | −17,267 |
| ITC | 978 | 255.50 | 2,49,879 | 12.5% | 0.65 | 0.081 | 265.20 | 9,487 |
| BHARTIARTL | 138 | 1,811.90 | 2,50,042 | 12.5% | 0.63 | 0.078 | 1,771.40 | −5,589 |
- Portfolio value \(V\) = ₹20,00,325. Weighted beta \(\beta_p\) = sum of the last-but-one column = 0.931.
- Hedge value = 0.931 × 20,00,325 = ₹18,62,937.
- One NIFTY Sep lot on 31 Aug = 24,251.4 × 65 = ₹15,76,341. Lots = 18,62,937 / 15,76,341 = 1.18 → 1 lot (you can only trade whole lots). Margin ≈ ₹1,78,751.
- Result on 28 Sep. Portfolio: −₹1,14,435 (−5.72%; Nifty fell 5.40%). Short 1 lot: (24,251.4 − 22,819.6) × 65 = +₹93,067. Net = −₹21,368.
- Why not zero? With 1 lot the portfolio was under-hedged (1 instead of 1.18). It also fell a little more than its beta implied, mainly because TCS and INFY fell 13–14% on stock-specific weakness. With 2 lots it would have been over-hedged, and the net would have been +₹71,699, which in a rising market would have become a loss.
- One detail helped the hedge. The futures fell 1,431.8 points while spot Nifty fell only 1,300.15, because the Sep basis shrank from 171.0 points (24,251.4 − 24,080.4) to 39.35 (22,819.6 − 22,780.25). That convergence added 131.65 × 65 = ₹8,557 of the ₹93,067. This is normal: a short futures hedge collects the cost of carry, roughly the interest rate, while a long pays it (Sections 11 and 14).
When the risk is company-specific
- Hold 625 TCS shares (₹14,99,563 on 31 Aug at 2,399.3). β = 0.86, so hedge = 0.86 × 14,99,563 / 15,76,341 = 0.82 → 1 lot short NIFTY Sep.
- By 28 Sep TCS was at 2,070.7 (−13.7%). Shares: −₹2,05,375. Futures: +₹93,067. Net: −₹1,12,308.
- Nifty fell 5.4%, but TCS fell 13.7%. The extra fall was unsystematic risk (an IT-sector and company move), which an index hedge cannot cover. Only diversification, or hedging with TCS's own futures, would have helped.
A hedge also removes your upside while it is on. It costs transaction charges, needs margin (₹1.79 lakh here) and needs cash for margin calls if the market rallies, because the short futures then lose money every day. Many investors meet part of the margin by pledging shares they already hold, but the broker counts pledged shares only after a haircut, at least half of the margin must be cash or cash equivalents, and daily M2M losses must always be paid in cash. So keep a cash buffer even for a hedge. Hedge for a specific, time-bound risk, then lift the hedge. Chapter 10 shows how put options can hedge with a known maximum cost.
framework.futures.beta_hedge(portfolio_value, beta, fut_price, lot) returns the exact and rounded number of lots. framework.futures.mtm_ledger(settle, entry_price, lots, lot_size, side, margin_pct, capital) rebuilds the daily M2M tables in Sections 8 and 9, including the full SPAN + ELM required each day and the top-up on every margin call.
16. Positional futures for a beginner: capital, sizing, gaps
16.1 Why the 1% rule is hard with big lots
Chapter 11 recommends risking at most about 1% of capital per trade. For futures, the position-sizing formula becomes:
- Capital
- Your total trading account, in ₹.
- risk %
- The most you are willing to lose on this one trade, as a decimal (1% = 0.01).
- Entry, Stop
- Your planned entry price and stop-loss price, in ₹ or index points.
- \(|\ldots|\)
- The vertical bars mean "ignore the sign": the distance between entry and stop, whether you are long (stop below) or short (stop above).
- lot size
- Units per contract (65 for NIFTY).
- \(\lfloor\ldots\rfloor\)
- Round down to a whole number: 1.9 becomes 1, 0.7 becomes 0.
- Capital × risk % is your risk budget: the rupees you can afford to lose if the stop is hit.
- Stop distance × lot size is what one lot loses if the stop is hit.
- Divide the first by the second and round down. That is how many lots fit inside your budget.
- If the answer is 0, even one lot would risk more than your budget. Skip the trade (or see the options after the table below). Don't raise the risk % or squeeze the stop inside ordinary daily noise just to make one lot fit.
How wide a stop can one NIFTY lot afford?
- Risk budget = 1% × 5,00,000 = ₹5,000.
- Maximum stop distance for one lot = 5,000 / 65 = 76.9 points, which is 0.339% of the futures price.
- Nifty's ATR(14) on 30 Sep was 209.0 points (0.9%). A 77-point stop sits well inside one ordinary day's noise and would be hit by random movement.
- A sensible 2×ATR stop (418 points) risks 418 × 65 = ₹27,173 per lot. That is 1% of ₹27.2 lakh. With ₹5 lakh, the same trade risks 5.4% of capital.
| Contract | Lot | ATR(14) on 30 Sep | ATR % of price | Risk per lot, 2×ATR stop ₹ | Margin per lot ₹ | Capital for 1% risk ₹ |
|---|---|---|---|---|---|---|
| NIFTY | 65 | 209.0 | 0.9% | 27,173 | 1,67,370 | 27,17,330 |
| BANKNIFTY | 30 | 651.5 | 1.2% | 39,089 | 1,86,667 | 39,08,868 |
| RELIANCE | 500 | 20.2 | 1.7% | 20,248 | 1,05,706 | 20,24,821 |
| HDFCBANK | 650 | 14.0 | 2.0% | 18,142 | 82,137 | 18,14,203 |
| SBIN | 750 | 16.7 | 1.7% | 25,071 | 1,28,274 | 25,07,084 |
| INFY | 400 | 26.9 | 2.7% | 21,543 | 77,008 | 21,54,266 |
| TCS | 225 | 59.6 | 2.9% | 26,800 | 84,479 | 26,79,959 |
| ITC | 1,725 | 4.6 | 1.8% | 15,998 | 80,703 | 15,99,767 |
| TATASTEEL | 2,750 | 4.4 | 2.4% | 24,319 | 90,454 | 24,31,877 |
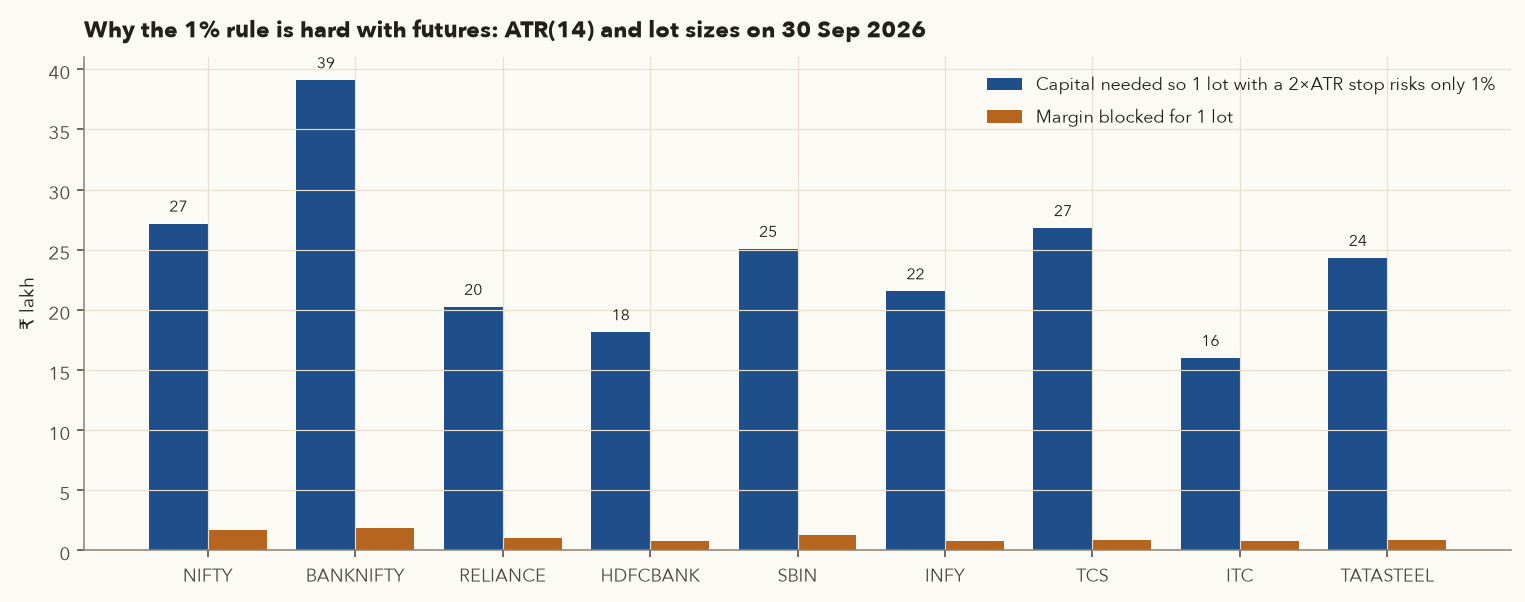
Practical options if your capital is smaller: (a) stay in the cash market for swing trades, where you can buy exactly the number of shares your risk allows; (b) use futures only for occasional hedging; (c) accept a 2% risk per trade and a tighter, structure-based stop, knowing you will be stopped out more often; or (d) build capital first. Never solve the problem by dropping the stop.
framework.risk.position_size(capital, risk_pct, entry, stop, lot_size=65, max_position_pct=None) returns a quantity in units, rounded down to a whole number of lots (divide by 65 to get lots), and 0 when one lot exceeds your risk budget. Pass max_position_pct=None for futures, because the default caps the position at your cash, which only makes sense in a cash account. Treat 0 as "skip this trade". framework.risk.atr_stop gives the ATR-based stop.
16.2 Gap risk: when stops don't protect you
A stop-loss order can only fill when the market trades. If bad news arrives overnight, the market can open far beyond your stop, and you are filled at the open. With leverage, that one gap can cost more than your whole planned risk.
How big can an overnight gap be?
- Nifty opened −5.0% (−1,146 points) on 7 Apr 2025, during the global tariff sell-off. At today's lot of 65, that is −₹74,493 per lot before the market had even traded, about 45% of the current margin.
- Other large Nifty gap-downs: 19 Mar 2026 (−2.44%), 9 Mar 2026 (−2.38%), 2 Feb 2026 (−2.07%), 2 Mar 2026 (−2.06%). 39 of 738 sessions opened more than 1% away from the previous close.
- Single stocks gap harder. HDFCBANK closed at 843.05 on 18 Mar 2026 and opened at 770.00 on 19 Mar (−8.7%) on very heavy volume. One lot (650 shares) lost ₹47,482 at the open.
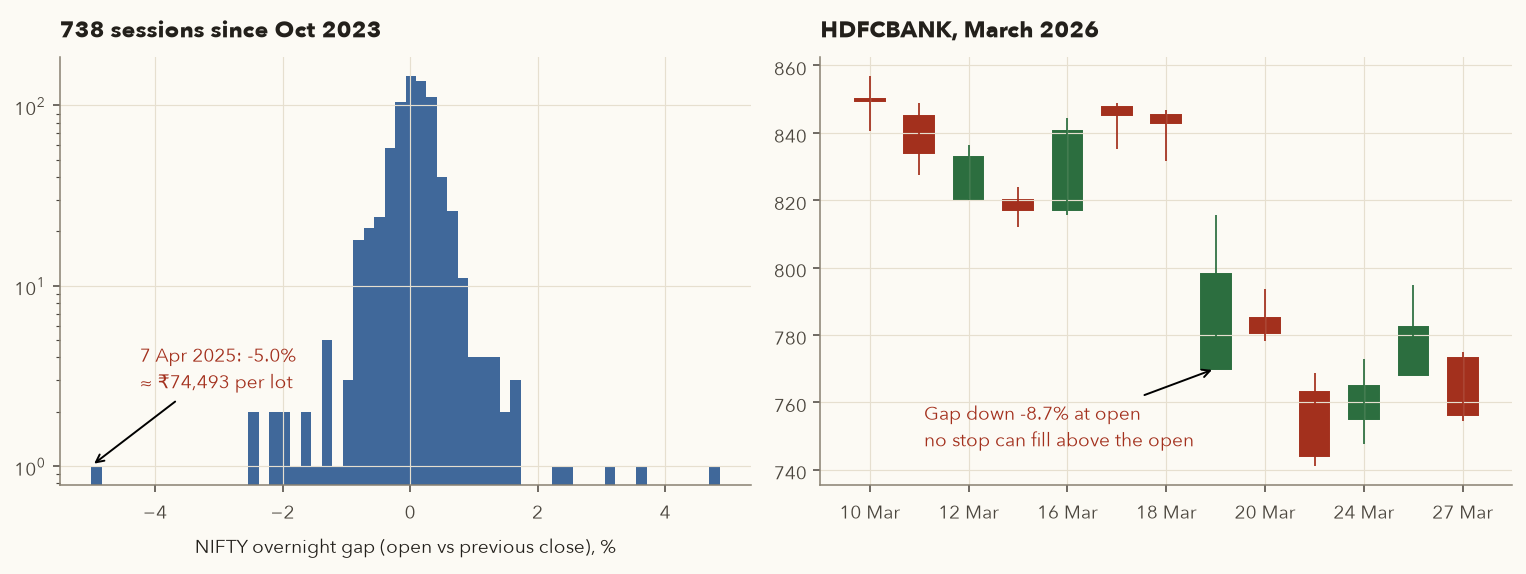
Ways to manage gap risk: hold fewer lots than your risk budget allows before known events (results, policy, elections, budgets); prefer index futures over single stocks, since index gaps are smaller; and keep spare cash for margin calls. If you are long stock futures, consider a protective put (Chapter 10).
16.3 Costs (summary; details in Chapter 13)
From 1 Apr 2026, STT on futures is 0.05% of the sell-side value (up from 0.02%, Budget 2026). On one NIFTY lot (~₹14.8 lakh) that is about ₹738 per round trip in STT alone, before brokerage, exchange and clearing charges, SEBI fees, stamp duty and GST. Rollovers add four legs per month. framework.costs.futures_charges computes them. For tax, futures P&L is generally treated as non-speculative business income. See Chapter 13.
16.4 A beginner's rulebook for positional futures
- Learn on paper first. Paper-trade or trade cash-market equivalents for at least 3 months and keep an M2M ledger like Section 8.
- Start with NIFTY futures only. Most liquid, cash-settled, lowest margin %, no single-company gaps.
- Size by risk, not by margin. Lots = risk budget / (stop distance × lot size). Keep account equity at least 3–5× the margin of the positions you hold.
- Every trade has a pre-defined stop, placed beyond a logical level (swing low/high, 2×ATR). Exit when it's hit. Never add margin to "give it room".
- One or two positions at a time, and never all in the same direction across correlated stocks (five long bank futures is one trade, not five).
- Close or roll stock futures 2–3 days before expiry to avoid physical settlement and expiry-day margin jumps.
- Cut size before known events. Budgets, RBI policy, results, elections.
- Check costs and liquidity: bid-ask spread, depth, STT.
- Track your expectancy (Chapter 11) over at least 30 trades before increasing size.
- Remember the base rate. 66% of individual futures traders and 87.7% of all individual F&O traders lost money in FY26.
17. Try it yourself
These snippets need a copy of the course repository and Python with pandas and numpy (setup steps are in its framework/README.md). Run them from the repository's root folder, for example with .venv/bin/python, because the file paths are relative to that folder. Each snippet reproduces numbers from this chapter. The full analysis is in course/scripts/ch09_figures.py.
17.1 Contract value, basis and implied carry from the bhavcopy
import pandas as pd
f = pd.read_csv("data/fno/futures_aug_sep_2026.csv", parse_dates=["TradDt", "XpryDt"])
d = f[(f.TradDt == "2026-09-30") & (f.TckrSymb.isin(["NIFTY", "RELIANCE", "HDFCBANK", "SBIN"]))].copy()
d["days"] = (d.XpryDt - d.TradDt).dt.days
d["contract_value"] = d.SttlmPric * d.NewBrdLotQty
d["basis"] = d.SttlmPric - d.UndrlygPric
d["fair"] = d.UndrlygPric * (1 + 0.0552 * d.days / 365)          # r = 91-day T-bill
d["implied_carry_%"] = (d.SttlmPric / d.UndrlygPric - 1) * 365 / d.days * 100
pd.set_option("display.width", 200)
cols = ["TckrSymb", "XpryDt", "days", "UndrlygPric", "SttlmPric", "fair", "basis",
        "implied_carry_%", "contract_value"]
print(d[cols].sort_values(["TckrSymb", "days"]).round({"fair": 2, "basis": 2, "implied_carry_%": 2}).to_string(index=False))
# NIFTY Oct: spot 22620.45, settle 22707.3, fair 22712.82, implied 5.19%
17.2 Daily M2M ledger for any futures position
import pandas as pd
f = pd.read_csv("data/fno/futures_aug_sep_2026.csv", parse_dates=["TradDt", "XpryDt"])

def ledger(sym, expiry, side, entry_date, exit_date, lots=1):
    s = f[(f.TckrSymb == sym) & (f.XpryDt == expiry)].set_index("TradDt").sort_index()
    lot = int(s.NewBrdLotQty.iloc[0])
    px = s.SttlmPric.loc[entry_date:exit_date]
    out = pd.DataFrame({"settle": px})
    out["m2m"] = side * px.diff().fillna(0) * lot * lots      # day 1: entry at that day's settle
    out["cum"] = out.m2m.cumsum()
    return out

L = ledger("NIFTY", "2026-09-29", +1, "2026-08-03", "2026-09-29")
print(L.tail(3)); print("Total:", round(L.m2m.sum(), 2))       # -132847.0
S = ledger("INFY", "2026-09-29", -1, "2026-08-03", "2026-09-24")
print("INFY short total:", round(S.m2m.sum(), 2))               # 65600.0
17.3 OI buildup for every stock over a window
import pandas as pd
f = pd.read_csv("data/fno/futures_aug_sep_2026.csv", parse_dates=["TradDt", "XpryDt"])
oi = f.groupby(["TckrSymb", "TradDt"]).OpnIntrst.sum().unstack()       # all expiries summed
spot = f.groupby(["TckrSymb", "TradDt"]).UndrlygPric.first().unstack()
a, b = "2026-08-31", "2026-09-28"
pc = spot[b] / spot[a] - 1
oc = oi[b] / oi[a] - 1
def buildup(p, o):
    return {(True, True): "Long buildup", (False, True): "Short buildup",
            (True, False): "Short covering", (False, False): "Long unwinding"}[(p > 0, o > 0)]
res = pd.DataFrame({"price_%": pc * 100, "oi_%": oc * 100}).dropna()
res["class"] = [buildup(p, o) for p, o in zip(res["price_%"], res["oi_%"])]
print(res.loc[["NIFTY", "TCS", "ITC", "DRREDDY", "HAVELLS"]].round(1))
indices = ["NIFTY", "BANKNIFTY", "FINNIFTY", "MIDCPNIFTY", "NIFTYNXT50", "NIFTYFPI"]
print(res.drop(index=indices, errors="ignore")["class"].value_counts())   # stocks only: 118/68/13/11
17.4 Rollover %, beta and hedge lots
import pandas as pd, numpy as np
f = pd.read_csv("data/fno/futures_aug_sep_2026.csv", parse_dates=["TradDt", "XpryDt"])
g = f[(f.TckrSymb == "NIFTY") & (f.TradDt == "2026-09-29")].set_index("XpryDt").OpnIntrst
print("Rollover %:", round(g.drop(pd.Timestamp("2026-09-29")).sum() / g.sum() * 100, 1))   # 74.3

px = lambda s: pd.read_csv(f"data/ohlc/{s}.csv", index_col=0, parse_dates=True)
n = px("IDX_NSEI").Close.pct_change()
r = px("LT")["Adj Close"].pct_change()
j = pd.concat([r, n], axis=1, keys=["s", "m"], sort=True).loc["2025-09-01":"2026-08-31"].dropna()
beta = np.polyfit(j.m, j.s, 1)[0]
print("LT beta:", round(beta, 2))                                 # 1.43
value, fut, lot = 2000325, 24251.4, 65
print("Lots for beta 0.931:", round(0.931 * value / (fut * lot), 2))   # 1.18
18. Practical checklist
- I know the contract's lot size, contract value, expiry date (last Tuesday, or the previous trading day if it's a holiday) and settlement type (index = cash, stock = physical).
- I checked my broker's current margin (SPAN + exposure) and my account holds at least 3–5× that margin.
- I wrote down entry, stop and target before ordering, and lots = risk budget / (stop distance × lot size) is at least 1.
- I checked liquidity: near-month contract, tight bid-ask, enough depth; I use limit orders outside the most liquid contracts.
- I checked the basis against fair value, and the corporate-action calendar (dividends) for stock futures.
- I checked for known events (results, RBI policy, budget, elections) before expiry, and the F&O ban list.
- I know how I will fund margin calls, and I will exit at my stop rather than add margin.
- I have a calendar reminder to roll or close 2–3 days before expiry (stock futures: always close or roll).
- I record every day's M2M and every trade's R-multiple (the trade's profit or loss divided by the amount I planned to risk; Chapter 11) in a journal.
- For a hedge: I computed portfolio beta, rounded lots consciously (under- vs over-hedge), and set a date to lift the hedge.
19. Key takeaways
- A futures contract is a standardised, exchange-traded forward. The clearing corporation removes counterparty risk using margins and daily mark-to-market.
- NSE futures (Oct 2026): three monthly contracts, expiring on the last Tuesday. NIFTY lot 65, BANKNIFTY 30. Index futures are cash-settled. Stock futures are physically settled.
- Initial margin = SPAN + exposure margin (2% index, 3.5% stocks). On 30 Sep 2026 one NIFTY lot (₹14.76 lakh) needed about ₹1.67 lakh, which is 8.8× leverage.
- M2M settles gains and losses every day against the previous settlement price. A real long NIFTY Sep trade lost ₹1,32,847 (−8.25% price move, −72.8% of margin) and triggered 12 margin calls. A 2×ATR stop would have cut the loss to ₹33,878.
- Futures let you hold shorts overnight. The mechanics are identical to longs with the sign flipped, and losses on shorts are theoretically unlimited.
- Fair value: F = S(1 + r·x/365) − d. NIFTY and RELIANCE traded within 0.02% of fair value on 30 Sep. Dividends cause discounts (MARUTI, Aug 2026). The basis converges to zero at expiry.
- OI counts open contracts. Paired with price it shows long/short buildup, short covering and long unwinding. In our data daily buildups did not predict the next day: use them as context, not as signals.
- Rollover % shows how much OI was carried to the next month (NIFTY 74.3% in Sep). Rollover cost is roughly the interest carry (91.1 points ≈ 5.2% p.a. for NIFTY).
- Hedge a portfolio by shorting β × value / (F × lot) NIFTY lots. It removes market risk, not company risk (TCS, Sep 2026). Basis risk and rounding to whole lots remain.
- Big lots make the 1% rule need ₹15–40 lakh of capital per lot with a 2×ATR stop. Overnight gaps (Nifty −5.0% on 7 Apr 2025, HDFCBANK −8.7% on 19 Mar 2026) can jump past stops.
- 66% of individual futures traders and 87.7% of all individual F&O traders lost money in FY26 (SEBI, Aug 2026). Size small, use stops, and treat futures as a tool, not a shortcut.
20. Quiz and exercises
Q1. Name the four problems with forward contracts and the feature of futures that solves each.
Q2. On 30 Sep 2026 SBIN Oct futures settled at 967.20 with a lot of 750 and SPAN of 14.18%. What are the contract value, initial margin (stock ELM 3.5%) and leverage?
Q3. You are long 2 lots of NIFTY futures. Yesterday's settlement was 23,449.8 and today's is 23,108.6 (24 Sep 2026). What is today's M2M?
Q4. Your account has ₹1,80,000 and you hold 1 NIFTY lot. After today's M2M of −₹12,000 the futures settle at 23,500. With margin at 11.34% of contract value, is there a margin call, and of how much?
Q5. On 30 Sep 2026 RELIANCE spot was 1,187.00 and the Nov contract (54 days to expiry) settled at 1,197.70. Using r = 5.52%, compute the fair value and the implied carry.
Q6. A stock futures contract trades 120 rupees below spot two days before the stock goes ex-dividend for ₹125. Is this a bearish signal? What happens to the basis on the ex-date?
Q7. Over a week a stock's price rises 6% while total futures OI (all expiries) falls 15%. Classify it and say what you would check next.
Q8. On HDFCBANK's expiry day (29 Sep 2026), OI was Sep 2,89,43,850, Oct 36,53,59,800 and Nov 2,42,91,800 shares. What is the rollover %? What does it tell you?
Q9. You hold a ₹30 lakh portfolio with beta 1.15. NIFTY futures are at 22,707.3 (lot 65). How many lots should you short to hedge? What if you round down?
Q10. You have ₹8 lakh and want to risk 1% on a long NIFTY futures trade with a 2×ATR stop, where ATR = 209 points. How many lots can you trade? What should you do?
Q11. Why must you close or roll a long stock-futures position before expiry, even if you are bullish?
Q12. Exercise: using the bhavcopy, build an M2M ledger for a SHORT 1 lot of BANKNIFTY Sep-26 futures from 31 Aug to 28 Sep 2026. What is the total P&L, and what do you notice about the biggest single-day loss vs the initial margin?
ledger("BANKNIFTY", "2026-09-29", -1, "2026-08-31", "2026-09-28"). Entry 57,887.2, exit 54,556.2, lot 30. Total = (57,887.2 − 54,556.2) × 30 = +₹99,930. The worst day was 16 Sep, at −₹9,852. That is about 5% of an initial margin of roughly ₹1.96 lakh (57,887.2 × 30 × 11.31%), from one day's move in a trade that ended up winning. Single bad days are normal even in good trades, which is why you keep spare cash and size by risk.Q13. You hold a ₹15 lakh portfolio with beta 1.0 and short 1 lot of NIFTY Oct futures at 22,707.3 to hedge through a three-week event. Instead of falling, Nifty futures rise 4%. What happens to your account, and was the hedge a mistake?
21. Sources
Zerodha Varsity, Module 4, Futures Trading (concepts; explained here in our own words): 1. Background – Forwards Market · 2. Introducing Futures Contract · 3. The Futures Trade · 4. Leverage & Payoff · 5. Margin & M2M · 6. Margin Calculator (Part 1) · 7. Margin Calculator (Part 2) · 8. All about Shorting · 9. The Nifty Futures · 10. Futures Pricing · 11. Hedging with Futures · 12. Open Interest · 13. Quick note on Physical Settlement.
Rules and rates (checked Oct 2026): SEBI, Study: Profitability of Individual Traders in the Equity Derivatives Segment FY25–FY26 (20 Aug 2026) · NSE Clearing, Equity derivatives margins (SPAN, ELM 2%/3.5%, calendar-spread ELM) · NSE Clearing SPAN risk-parameter file, 30 Sep 2026 · RBI homepage (91-day T-bill 5.5199%, repo 5.25%, as of 2 Oct 2026) · RBI Weekly Statistical Supplement, interest rates (25 Sep 2026) · NSE expiry moved to Tuesday from 1 Sep 2025 · NSE lot-size revision (NIFTY 65, BANKNIFTY 30) from the Jan-2026 series · NSE tick-size revision for derivatives (Apr 2025) · NSE trading holidays 2026 · STT rates from 1 Apr 2026 (futures 0.05%) · SEBI's Oct-2024 index-derivative measures (Zerodha Z-Connect) · History of F&O margin requirements / peak margin (Zerodha Z-Connect) · Zerodha physical-settlement policy · Removal of calendar-spread benefit for stock derivatives on expiry day (5 May 2026) · Why Zerodha stopped bracket orders · SEBI 2025 MWPL / future-equivalent OI changes.
Data: NSE F&O UDiFF bhavcopy, futures, 3 Aug – 30 Sep 2026 (data/fno/futures_aug_sep_2026.csv); SPAN values extracted to data/extra/ch09_span_20260930.csv; daily OHLC from NSE via Yahoo Finance (data/ohlc/). All calculations and figures: course/scripts/ch09_figures.py. Examples are historical analysis for education, not recommendations.