
Reading Financial Statements
1. What you'll learn and why it matters
The first five chapters taught you to read price. This chapter teaches you to read the business behind the price. A company's financial statements are its report card: three tables that, read together, tell you how much it sold, how much it kept, what it owns, what it owes, and whether real cash came in.
By the end of this chapter you will be able to:
- Explain what fundamental analysis (FA) is and how an investor's mindset differs from a trader's or a speculator's.
- Know where to find official numbers in India (annual reports, exchange filings, investor presentations, concall transcripts, screener.in) and which parts of an annual report are worth your time.
- Read a Profit & Loss statement line by line, from revenue through EBITDA, depreciation, interest, exceptional items and tax down to PAT and EPS, and calculate margins and growth.
- Read a Balance Sheet: equity, reserves, borrowings, payables, fixed assets, CWIP, goodwill, inventory, receivables, and the accounting equation that ties them together.
- Read a Cash Flow Statement: CFO, CFI, CFF, free cash flow, and why cash and profit are rarely the same number.
- Trace how the three statements link to each other.
- Understand why a bank's statements look completely different (NII, NIM, CASA, GNPA/NNPA).
- Spot the classic red flags, using real Indian cases from 2023–2026.
Long-term investor: this is your core skill. You are buying a share of a business for years, so you need to know whether the business is any good.
Swing trader: you do not need a full analysis for a 2–6 week trade, but results days move stocks 5–15% in a session. Knowing what "PAT up 18% but CFO down" or "exceptional loss" means stops you from trading blind into earnings, and a quick fundamental filter keeps you away from businesses that can blow up overnight (Gensol, later in this chapter).
Futures trader: a leveraged position in a stock future is badly hurt by a surprise. Knowing a company's debt load, cash generation and red flags tells you how fragile it is before you size a leveraged position.
We will work with real, recent numbers throughout. The main companies are:
| Company | Why it's here | What it teaches |
|---|---|---|
| Asian Paints | Consumer "quality" business | Clean P&L, working capital, a real profit slowdown (FY25) |
| Pidilite Industries | Consumer "compounder" | Steady growth, an acquisition (goodwill/intangibles), a bonus issue |
| Tata Steel | Cyclical, capital-heavy, leveraged | Debt, depreciation, CWIP, exceptional items, cyclicality |
| HDFC Bank | Bank | Why bank statements need different metrics |
| Adani Enterprises, Gensol Engineering, IndusInd Bank | Earnings-quality and governance cases | Red flags: exceptional gains, negative cash flow, debt, pledges, accounting lapses |
All annual figures are consolidated (except HDFC Bank, which we read standalone, for reasons explained in section 9), in ₹ crore, for financial years ending 31 March. "FY26" means the year from 1 Apr 2025 to 31 Mar 2026. Data was taken from screener.in on 2 Oct 2026 and saved under data/extra/screener/, so every number here can be reproduced.
1 lakh = 1,00,000 = 100 thousand. 1 crore = 100 lakh = 10 million. 1,000 crore = 10 billion. Annual reports often use ₹ crore, but some (like Varsity's old Amara Raja example) use ₹ million. Always check the unit line at the top of each statement before comparing numbers.
2. What fundamental analysis is: the investor mindset
2.1 The idea in one paragraph
Fundamental analysis means studying a business (its products, competition, management and, above all, its financial numbers) to judge whether it is worth owning, and roughly at what price. The logic is simple. Over long periods, a share price follows the company's earnings and cash flows, because a share is a claim on those cash flows. Over short periods, price is driven by sentiment, flows and news, and can drift far from the business. FA bets on the long-run link.
Varsity makes two points worth repeating. First, you do not need to be a chartered accountant. You need basic arithmetic, an understanding of what each line in a statement means, and some common sense about the industry. You read statements as a user, not a preparer. Second, FA is about telling apart the businesses that compound wealth from the ones that destroy it. Both kinds leave fingerprints in their statements years before the stock price reflects them.
2.2 Speculator vs trader vs investor
Varsity illustrates three mindsets with a story about an RBI policy announcement. Here is the same idea in a table:
| Mindset | Basis for action | Typical horizon | What they care about |
|---|---|---|---|
| Speculator | A hunch or a TV opinion ("RBI will surely cut rates") | Days | Being right about an unpredictable event |
| Trader | A tested, repeatable edge (price patterns, volatility behaviour) | Days to weeks | Probabilities and risk per trade, not the event itself |
| Investor | The quality and price of a business | Years | Whether the business keeps growing its earnings; short-term news is noise |
This course trains you to be the second and third, and never the first. Note that for an investor, doing nothing (holding through noise) is a deliberate action.
2.3 Compounding: why time is the investor's edge
If profits are reinvested, they earn returns too. This is compounding, and its effect is non-linear: the later years add far more than the early ones.
- \(PV\)
- Present value: the amount you start with, in ₹.
- \(FV\)
- Future value: what that amount grows to after \(n\) years, in ₹.
- \(r\)
- The yearly growth rate (or return), written as a decimal: 20% = 0.20.
- \(n\)
- The number of years.
- \((1+r)^{n}\)
- The small raised \(n\) is an exponent: multiply \((1+r)\) by itself \(n\) times. \(1.2^{3} = 1.2 \times 1.2 \times 1.2 = 1.728\).
- CAGR
- Compound annual growth rate: the one steady yearly rate that turns the start value into the end value over \(n\) years. It comes out as a decimal (0.095 = 9.5% a year).
- Start / End value
- The figure at the start and at the end of the period: revenue, profit, EPS or a share price. Use the same units for both.
- \(^{1/n}\)
- Raising to the power \(1/n\) takes the \(n\)th root. It undoes the compounding: for \(n = 2\) it is the square root.
How it works: the first formula runs forward in time: start with \(PV\) and multiply by \((1+r)\) once for each year. CAGR runs it backwards. Divide the end value by the start value to get the total growth multiple, take the \(n\)th root to turn it into a one-year multiple, then subtract 1 to get the rate. In a spreadsheet: =(End/Start)^(1/n)-1.
Example: in the example below, ₹100 grows to ₹619 in 10 years. CAGR \(= (619/100)^{1/10} - 1 = 0.20\), or 20% a year, the rate we started with.
Reinvest vs withdraw
- Reinvest: \(100 \times 1.2^3 = 172.8 \approx ₹173\) after 3 years; \(100\times1.2^{10} = ₹619\) after 10 years.
- Withdraw the ₹20 profit each year: the principal stays ₹100, so total wealth is \(100 + 20n\): ₹160 after 3 years, ₹300 after 10.
- The ₹100 roughly triples (₹299) around year 6. It then needs only about 4 more years to double again (₹619 by year 10). The second ₹300 arrives faster than the first.
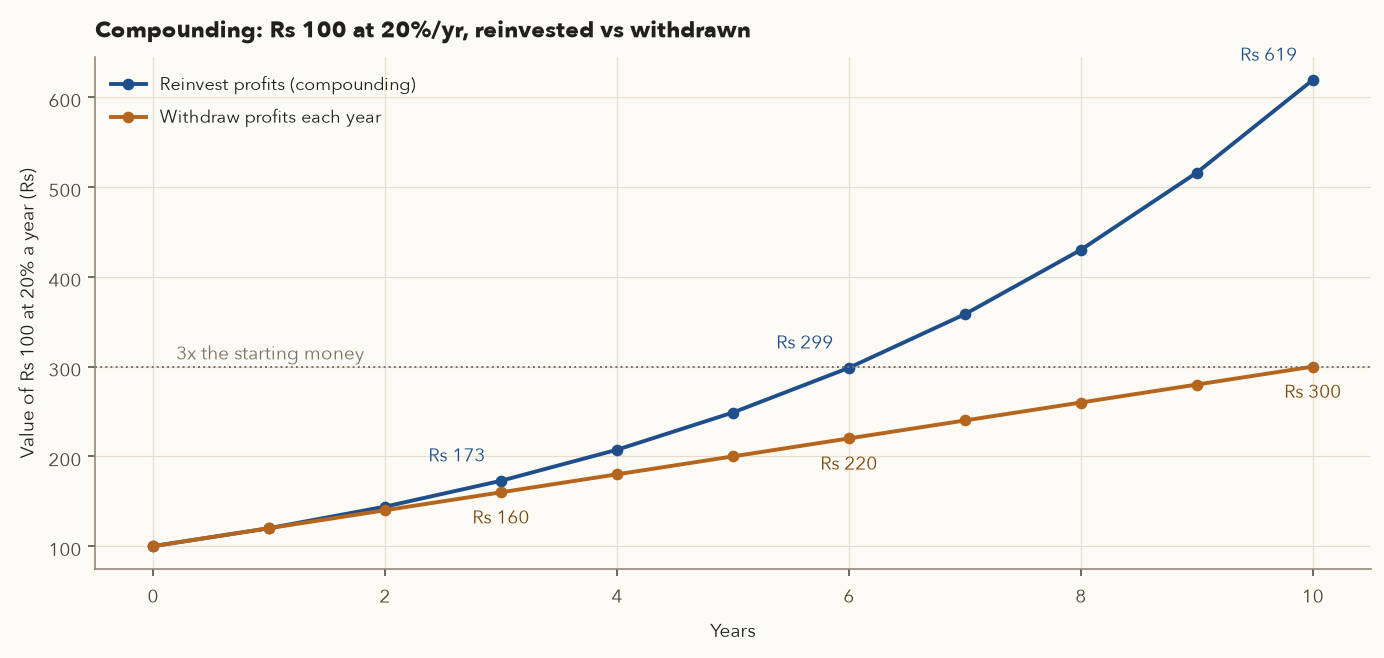
The same thing happens inside a good company. A business that earns high returns on its capital and reinvests profits grows its earnings per share year after year. Investors call these businesses compounding machines. The statements show you whether a company is one.
2.4 Good fundamentals do not mean the price goes up every year
Varsity uses Eicher Motors, which went nowhere for years before a large rally. We can see the same thing in our own data. Below, each company's share price and its EPS (earnings per share) are both indexed to 100 at the start (October 2016 for price, FY16 for EPS):
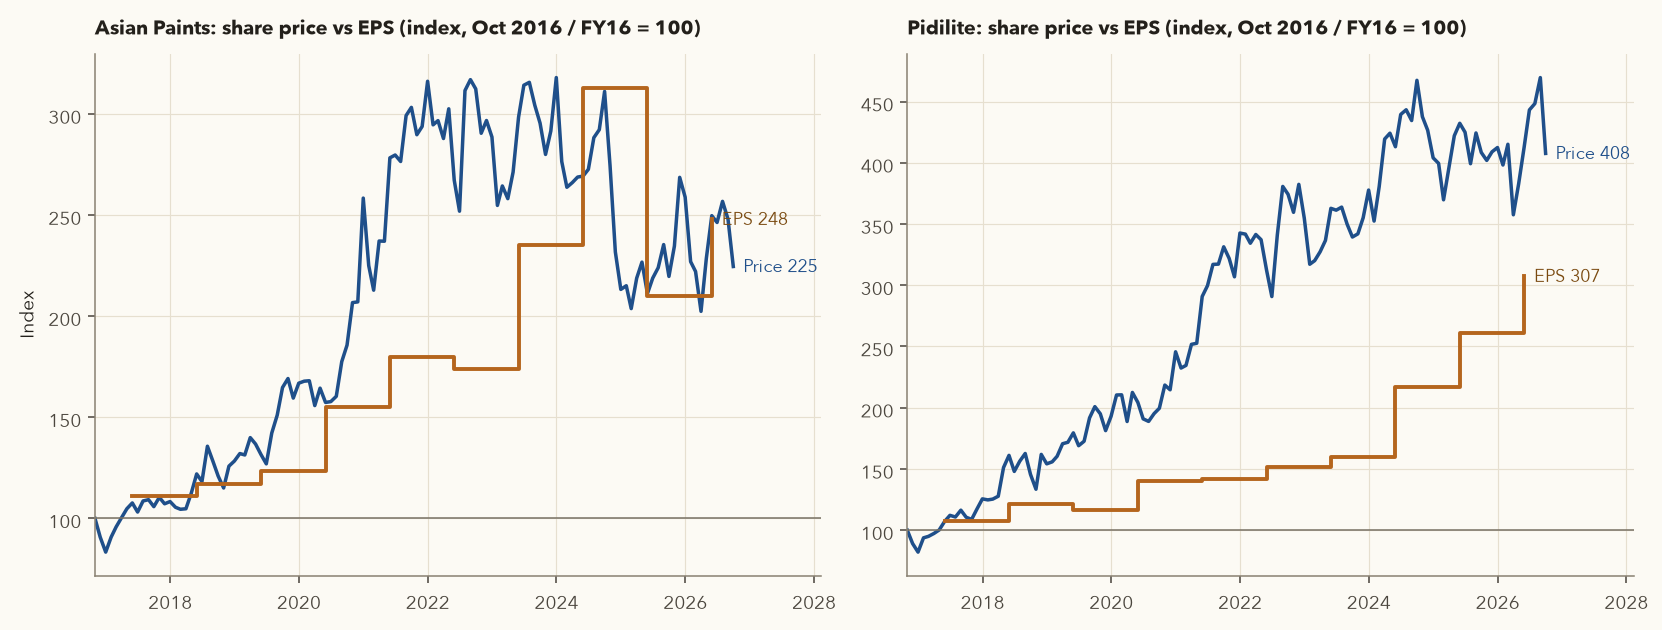
The business grew, the stock fell
- EPS went from ₹32.73 (FY21) to ₹45.09 (FY26), up 37.8%.
- The share price went from ₹3,244.65 (30 Sep 2021) to ₹2,402.60 (30 Sep 2026). Price CAGR = \((2402.60/3244.65)^{1/5}-1 = -5.83\%\) a year.
- Why: in 2021 the market paid a very high multiple of earnings (P/E) for Asian Paints. As growth slowed and new competition arrived, the multiple shrank. Earnings grew, but slower than the multiple contracted. Chapter 8 covers valuation multiples in detail.
- Over the full 10 years (Oct 2016 → Sep 2026), the dividend-adjusted return was 8.17% a year, below the Nifty 50's 9.99% price CAGR over the same window (an index that excludes dividends, so the true gap is wider).
A great business bought at too high a price can give poor returns for years. Reading statements tells you what you own. Valuation (chapter 8) tells you whether the price is sensible. Price action (chapters 2–5) helps with when. Varsity suggests a "core–satellite" split for this reason: a core of long-term fundamental holdings, plus a smaller satellite of shorter technical trades. Chapter 17 builds your own version.
2.5 Investable-grade attributes: qualitative and quantitative
Varsity splits what you check into two groups:
| Qualitative (judgement, mostly from reading) | Quantitative (from the statements) |
|---|---|
| Management background and track record Business ethics, past scams or regulatory actions Corporate governance, board independence Treatment of minority shareholders Related-party transactions Promoter salaries relative to profits Promoter share pledging and selling Who the large shareholders are Dependence on political patronage Promoter lifestyle funded by the company | Revenue and profit growth Margins: expanding or shrinking? Expense control and pricing power Tax rate Dividend history and sustainability Cash flows from operations, investing, financing Debt: level and trend Working capital efficiency Asset growth and capital spending Ratios (chapter 7) |
A single qualitative failure can outweigh excellent numbers. As Varsity puts it, the market eventually finds out about bad related-party dealings and punishes the stock, however good the margins look. Sections 4 and 10 show where these qualitative issues surface in the documents.
3. Where the numbers come from
3.1 Official sources (in order of reliability)
| Source | What it contains | Where / when |
|---|---|---|
| Annual report | Audited statements (standalone and consolidated), notes, auditor's report, MD&A, directors' report, corporate governance report, BRSR (sustainability report) | Company website "Investors" page, and BSE/NSE filings. Under the Companies Act 2013 the AGM (annual general meeting of shareholders) must be held within six months of year-end (so by 30 September for a March year-end), and the audited statements must reach shareholders at least 21 days before it. |
| Quarterly results | Condensed P&L (balance sheet half-yearly), segment results, notes on one-offs | Filed with exchanges under Regulation 33 of SEBI's LODR (Listing Obligations and Disclosure Requirements) Regulations: within 45 days of quarter-end for Q1–Q3, and within 60 days of year-end for Q4 plus the full year. Q1–Q3 carry a "limited review" by the auditor; the annual numbers are fully audited. |
| Investor presentation | Management's slides: segment data, volumes, KPIs (e.g. a bank's CASA ratio and NIM) | Filed with results. Useful, but it is marketing: check it against the audited numbers. |
| Earnings call transcript / recording | Management's explanations; analysts' tough questions | Filed on BSE/NSE within days of the call. |
| Shareholding pattern | Holdings of promoters (the founders/controlling group), FIIs/FPIs (foreign institutions), DIIs (domestic institutions such as mutual funds and insurers) and the public; shares pledged or otherwise encumbered | Quarterly on BSE/NSE. Promoters must also disclose any creation, invocation or release of a pledge within 7 working days (Regulation 31 of SEBI's SAST, the Substantial Acquisition of Shares and Takeovers Regulations). |
| Credit rating rationales | CRISIL/ICRA/CARE/India Ratings views on debt, liquidity, delays | Rating agency websites. Often an early warning (see Gensol, section 10). |
| Aggregators (screener.in, Tijori, Trendlyne) | Ten years of standardised statements, ratios, documents linked in one place | Free tiers. Convenient for comparison, but they reclassify line items (for example, screener folds exceptional items into "Other Income"). Go back to the filing when a number matters. |
BSE (bseindia.com): search the company, open its page, then use Corporate Announcements (results, presentations, concall transcripts, auditor or director resignations, pledge disclosures), Financials → Results, Annual Reports and Shareholding Pattern. NSE (nseindia.com): open the company page, then Corporate Filings (Announcements, Financial Results, Annual Reports, Shareholding Patterns, and Pledged Data for promoter encumbrance). The company's own "Investors" page usually links all of these. Screener.in's "Documents" tab collects annual reports, concall transcripts and credit-rating links in one place.
Getting value from an earnings call: read the transcript rather than a news summary. Note (1) what management says drove volume, price and margin; (2) any guidance (expected growth, margins, capex) and whether last year's guidance was met; (3) the questions analysts keep asking, which often point at the real worry; and (4) answers that dodge a direct question. Keep a one-page note per company and compare it with the next quarter's call.
3.2 Standalone vs consolidated
Each company publishes two sets of statements:
- Standalone: the listed parent company alone.
- Consolidated: the parent plus all subsidiaries (companies it controls), with the share of subsidiaries owned by outsiders shown separately as non-controlling interest (also called minority interest).
Use consolidated by default, because it shows the whole economic group. Varsity's example is a parent that loses ₹1,000 crore while its fully owned subsidiary earns ₹700 crore. Standalone shows a ₹1,000 crore loss; consolidated shows the true group loss of ₹300 crore.
When a group owns businesses of very different types. Since its merger with HDFC Ltd (1 July 2023), HDFC Bank's consolidated statements include insurance subsidiaries, whose premiums and claims inflate "other income" and "expenses" and hide the banking picture. For understanding the bank, standalone is cleaner (section 9). Holding companies are another case.
4. How to read an annual report
An annual report can run to 300–400 pages. Most of it you can skim. Here is what each section is for, and what to look for:
| Section | What it is | What to look for | Time to spend |
|---|---|---|---|
| Financial highlights | Multi-year summary charts | Quick orientation only. Recompute key numbers yourself. | 2 min |
| Chairman's / MD's letter | Management's narrative | Does management admit mistakes and weak spots, or is everything "record" and "transformational"? Compare last year's promises with this year's results. | 10 min |
| Management Discussion & Analysis (MD&A) | Economy, industry, competition, segment performance, risks, outlook | Varsity calls this one of the most important sections. What drives demand? Where is the company gaining or losing share? What risks does management itself list? | 30 min |
| Directors' report | Statutory disclosures | Dividend, capex plans, changes in directors/auditors, ESOPs, managerial pay vs median employee pay | 10 min |
| Corporate governance report | Board composition, committees, attendance, auditor fees | Independent directors resigning mid-term, unusual fees paid to auditors for "other services", related entities | 10 min |
| BRSR (Business Responsibility & Sustainability Report) | Environmental, social, governance disclosures | Relevant for polluting or labour-intensive industries; regulatory and ESG risk | Skim |
| Independent auditor's report | The auditor's opinion on whether the statements are fairly presented | The opinion type (below), Key Audit Matters (KAMs: the areas the auditor found hardest or most judgement-heavy), any "Emphasis of Matter" paragraph, and in the standalone report the CARO 2020 annexure (the Companies (Auditor's Report) Order, a checklist on which the auditor must comment, covering loans to related parties, defaults and fraud reported) | 15 min |
| Financial statements | P&L, balance sheet, cash flow, statement of changes in equity | Sections 5–8 of this chapter | 60+ min |
| Notes to accounts | Accounting policies and the detail behind every line ("schedules") | Revenue recognition, depreciation policy, related-party transactions, contingent liabilities, segment data, borrowings detail, exceptional items | As needed |
4.1 The auditor's opinion: four types
| Opinion | Meaning | Your response |
|---|---|---|
| Unmodified ("clean") | Statements are fairly presented | Normal. Still read the Key Audit Matters. |
| Qualified ("except for…") | Fair except for a specific issue the auditor disagrees with or could not verify | Read exactly what it is. Repeated qualifications are a serious warning. |
| Adverse | Statements are materially misstated | Avoid. |
| Disclaimer of opinion | Auditor could not get enough evidence to form a view | Avoid. |
An Emphasis of Matter paragraph is not a qualification. It points you to something important already disclosed, such as a large pending tax dispute or doubt about the company remaining a "going concern" (able to keep operating and paying its debts for the next year). Read it. An auditor who resigns mid-term is a major red flag; the resignation letter is filed with the exchanges.
4.2 Two notes you must always open
Related-party transactions (RPTs). Sales to, purchases from, loans to, or guarantees for entities owned by promoters or their relatives. Some RPTs are normal (buying from a group company at market rates). The warning signs are large loans or advances to promoter entities, purchases at odd prices, and RPTs growing faster than the business.
Contingent liabilities. Obligations that might become real: disputed tax demands, legal claims, guarantees given for others' loans. They are not on the balance sheet. Compare them with net worth. A contingent liability of 5% of equity is noise; one of 50% could be existential if it goes against the company.
(1) Auditor's report first: if it's qualified, you may stop there. (2) The three statements, looking at multi-year trends (screener.in is faster for this). (3) MD&A to understand why the numbers moved. (4) Notes for RPTs, contingent liabilities, borrowings and exceptional items. (5) Chairman's letter last, comparing it with what the numbers say. Then read one or two competitors' reports: Varsity rightly stresses peer comparison.
5. The Profit & Loss statement, line by line
The P&L (income statement) covers a period, a quarter or a year. It answers: how much did the company sell, what did it cost, and what was left for shareholders? Revenue is called the "top line" and net profit the "bottom line".
5.1 The structure
- Revenue from operations
- Sales of the company's products and services for the year (the "top line"), net of GST. It is the first line of the P&L. All amounts here are ₹ crore for the same year.
- Operating expenses
- The costs of running the business: materials, manufacturing, employees and other expenses. They do not include depreciation, interest or tax.
- EBITDA
- Earnings before interest, tax, depreciation and amortisation: the profit the core business makes. Screener calls it "Operating Profit".
- Other income
- Income from outside the core business: interest on deposits, dividends, gains on selling investments.
- D&A
- Depreciation and amortisation: this year's share of the cost of plants, machines and intangibles (explained in 5.3). No cash leaves the company for it this year.
- Finance cost
- Interest on borrowings and on lease liabilities.
- Exceptional items
- Large one-off gains or losses, such as writing down an asset or profit on selling a business. The \(\pm\) means they can be added (a gain) or subtracted (a loss).
- PBT
- Profit before tax.
- Tax
- The tax expense for the year: current tax plus deferred tax.
- PAT
- Profit after tax, also called net profit or the "bottom line", for the whole group.
- Minority interest
- The part of subsidiaries' profit that belongs to their outside shareholders (non-controlling interest, section 3.2).
- EPS
- Earnings per share, in ₹ per share. The "weighted average" share count is explained with the EPS formula in 5.3.
- Start at the top line and subtract the costs of running the business. What is left is EBITDA.
- Add other income. Subtract the cost of using up the asset base (D&A) and the cost of borrowing (finance cost). Add one-off gains or subtract one-off losses. That gives PBT.
- Subtract tax to get PAT. Then take out the minority shareholders' slice to get the profit that belongs to the company's own shareholders.
- Divide that profit by the number of shares to get EPS, the profit behind each share you own. The table in 5.2 runs every line for Asian Paints FY26.
5.2 Asian Paints FY26, every line
| Line item (consolidated, FY26) | ₹ crore | % of revenue | What it means |
|---|---|---|---|
| Revenue from operations (sales) | 35,584 | 100.0% | Money from selling paints, coatings, home décor. Net of GST (GST is collected for the government, not revenue). |
| Material cost | 17,746 | 49.87% | Raw materials and packaging used, adjusted for changes in inventory |
| Manufacturing cost | 2,936 | 8.25% | Power, fuel, plant running costs |
| Employee cost | 2,811 | 7.90% | Salaries, provident fund, ESOP expense (ESOP: employee stock options, the right to buy company shares at a set price) |
| Other expenses | 5,395 | 15.16% | Advertising, freight, royalty, rent, admin |
| Total operating expenses | 28,884 | 81.17% | (component rupee values are computed from screener's percentages, so they add to 28,888 because of rounding) |
| EBITDA (operating profit) | 6,700 | 18.83% | Profit from the core business before depreciation, interest, tax |
| Other income (net) | 728 | 2.05% | Interest and dividends on investments ₹889 cr, minus exceptional items ₹161 cr (screener nets them together) |
| Finance cost (interest) | 195 | 0.55% | Interest on borrowings and on lease liabilities |
| Depreciation & amortisation | 1,229 | 3.45% | Cost of plants and other assets spread over their useful lives |
| Profit before tax (PBT) | 6,003 | 16.87% | \(6700 + 728 - 195 - 1229 = 6004\) (rounding gives 6,003) |
| Tax | 1,608 | 4.52% | Effective tax rate \(1608/6003 = 26.79\%\) |
| Net profit (PAT) | 4,395 | 12.35% | Bottom line for the whole group |
| Minority share | −69 | Part of subsidiaries' profit belonging to outside shareholders | |
| Profit for EPS | 4,325 | Belongs to Asian Paints' shareholders | |
| EPS | ₹45.09 | \(4325 / 95.92 \text{ crore shares}\) |
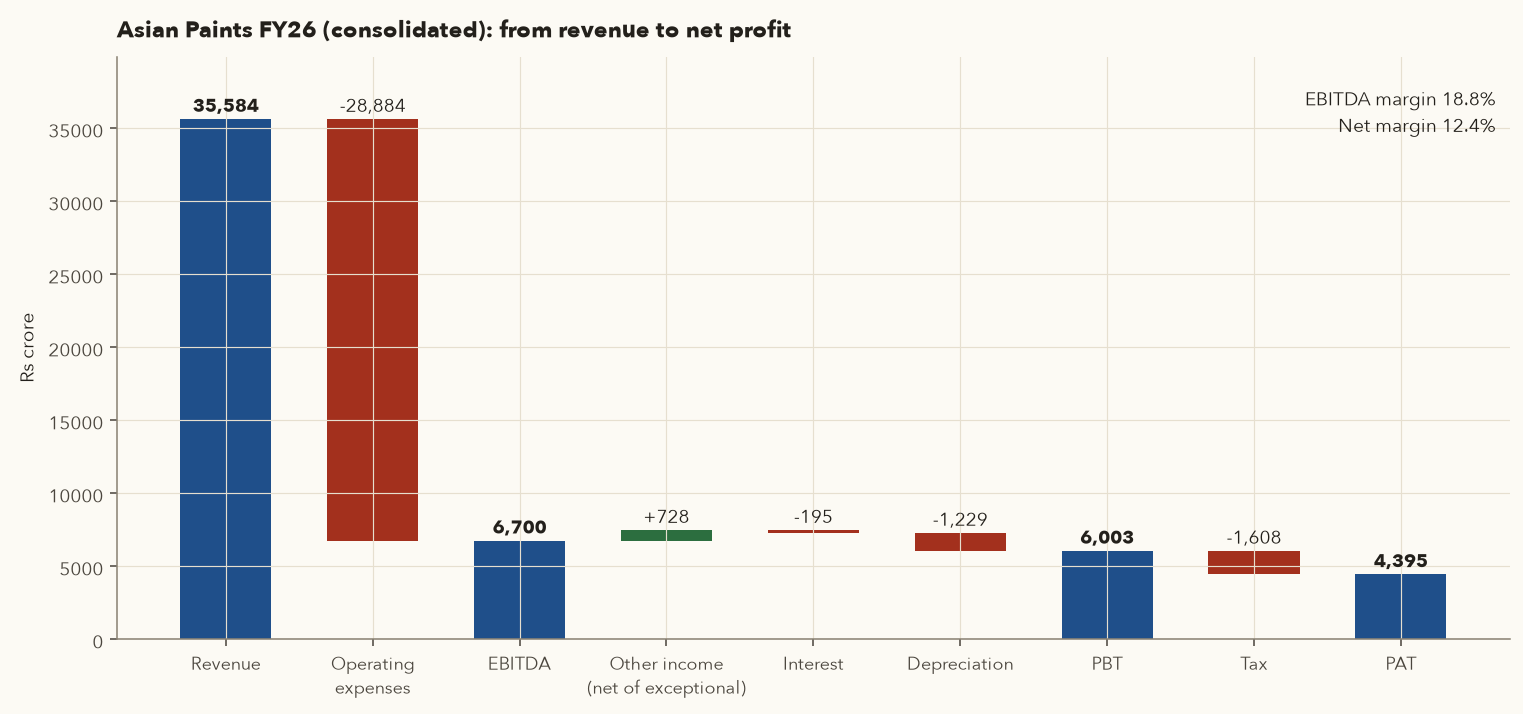
5.3 Each line: what it is, the logic, the traps
Revenue from operations. Sales of products and services from the core business, plus "other operating revenue" such as scrap sales or export incentives. This is the line to watch for growth. Logic: without growing revenue, profit growth eventually runs out (you can only cut costs so far). Trap: revenue booked aggressively (goods pushed to dealers at quarter-end on long credit). This shows up as receivables growing faster than sales (section 10).
Other income. Income that is not from the core business: interest on deposits, dividends, gains on selling investments, rent. It is real money, but it is not the business. Rule of thumb: if other income is a large share of PBT, the operating business is weaker than the headline profit suggests. Asian Paints' other income was 12.1% of PBT in FY26, which is fine for a cash-rich company. For Adani Enterprises in FY26 it was 86.4% (section 10).
Operating expenses. Indian companies present expenses "by nature": materials, employees, finance cost, depreciation, other. The materials line includes "changes in inventories": if the company produced more than it sold, the cost of the unsold goods is moved to inventory on the balance sheet, which reduces this year's expense. That is why a production build-up can flatter margins briefly.
EBITDA (Earnings Before Interest, Tax, Depreciation and Amortisation). Profit from operations before financing and accounting choices. It is useful for comparing operating performance across companies with different debt levels and asset ages.
- EBITDA
- Operating profit for the year (5.1), in ₹ crore.
- PAT
- Profit after tax for the year, for the whole group.
- Revenue
- Revenue from operations (sales) for the same year. This chapter divides by sales alone. Varsity's PAT margin (chapter 7) divides by sales plus other income, so say which one you used.
- Tax
- The tax expense in the P&L for the year (current plus deferred), not the tax paid in cash.
- PBT
- Profit before tax for the year.
How it works: each ratio is a fraction; multiply by 100 for a percentage. A margin tells you how many paise of every ₹1 of sales the company keeps at that level of the P&L. Higher means more pricing power or tighter costs, but compare only with the company's own past years or close peers. The effective tax rate should sit near the headline 25.17% (see Tax below). A rate far from it needs an explanation.
Example (Asian Paints FY26, from the table in 5.2): EBITDA margin \(= 6700/35584 = 18.83\%\). PAT margin \(= 4395/35584 = 12.35\%\). Effective tax rate \(= 1608/6003 = 26.79\%\).
EBITDA ignores capital spending, working capital and interest. For a capital-heavy company like Tata Steel, depreciation was 34.8% of EBITDA in FY26. That is a real cost: furnaces wear out and must be replaced. Use EBITDA to compare operations, never as a stand-in for cash.
Depreciation and amortisation (D&A). When a company buys a machine that will last years, it does not expense the whole cost on day one. It spreads the cost across the machine's useful life. Depreciation applies to tangible assets (plant, buildings, vehicles); amortisation applies to intangibles (software, patents, acquired brands). Logic: match the cost of an asset to the years in which it earns revenue, so that each year's profit is fair.
- Cost
- What the company paid for the asset, including getting it installed, in ₹ crore.
- Residual value
- What the company expects to sell the asset for (often as scrap) at the end of its life. Often taken as zero.
- Useful life
- How many years the company expects to use the asset. It is set by company policy, stated in the accounting-policy note.
- Gross block
- The original cost of all the fixed assets the company still owns, added up (in the fixed-assets note).
- Accumulated depreciation
- All the depreciation charged on those assets since they were bought, added up.
- Net block
- What is left: the book value of fixed assets shown on the balance sheet.
How it works: "straight-line" means the same charge every year. Take the cost, less what you expect to get back at the end, and spread it evenly over the useful life. Each year's charge is an expense in the P&L and is added to accumulated depreciation, so the net block shrinks year by year.
A ₹12 crore machine with an 8-year life
- Cost ₹12 cr, residual value 0, life 8 years → depreciation \(= 12/8 = ₹1.5\) cr a year.
- Year 1 P&L shows a ₹1.5 cr expense, not ₹12 cr. The cash flow statement shows the full ₹12 cr leaving in year 1 as capex (capital expenditure: cash spent on long-lived assets such as plants and machines), under investing activities.
- After 3 years: gross block ₹12 cr, accumulated depreciation ₹4.5 cr, net block ₹7.5 cr on the balance sheet.
- Because depreciation is a non-cash expense, the cash flow statement adds it back when computing operating cash flow.
Finance cost. Interest on borrowings, plus interest on lease liabilities. Since Ind AS 116 (Ind AS = Indian Accounting Standards, the accounting rules listed companies follow; standard 116 covers leases), long leases (for example rented stores or depots) appear on the balance sheet as a "right-of-use" asset and a lease liability. So even a debt-free company can show finance cost. Asian Paints' ₹1,636 cr of lease liabilities is part of its ₹3,929 cr "borrowings".
Exceptional items. Large, unusual gains or losses: impairment (writing down) of an asset or goodwill, restructuring costs, profit on selling a business, a one-time legal settlement. Analysts usually look at profit before exceptional items to judge the ongoing business. Trap: a company that has "one-time" charges every year has an ongoing cost, and it should be treated as one.
Tax. Current tax (payable on this year's taxable income) plus deferred tax (an accounting adjustment for timing differences, for example when tax depreciation runs faster than book depreciation). The headline Indian corporate rate under the concessional regime (Section 115BAA of the Income-tax Act 1961, which applies to income up to 31 March 2026; the Income-tax Act 2025 replaced the 1961 Act from 1 April 2026 with renumbered sections) is 22% + 10% surcharge + 4% cess = 25.17%. Asian Paints' 26.79% effective rate is close to this. When the effective rate is far from 25%, find out why. In FY24 Tata Steel paid a tax charge of about ₹3,763 cr on a pre-tax loss of ₹1,147 cr (screener shows this as "328%"), so the net loss widened to ₹4,910 cr. That happened largely because losses in some countries (such as the UK) cannot be offset against taxable profits elsewhere, so the group pays tax even when its total pre-tax result is negative.
PAT and minority interest. PAT is the group's profit. If a subsidiary is, say, 60% owned, 40% of its profit belongs to others. That slice is deducted as "minority share" (non-controlling interest) to get profit attributable to the parent's shareholders.
Share of profit of associates and joint ventures. When a company owns a significant but non-controlling stake (typically 20–50%), it does not add up that company's revenue and expenses line by line. It adds only its share of the associate's profit, as one line just above PAT (the "equity method"). Example: if a company owns 30% of an associate that earns ₹100 cr, ₹30 cr appears in consolidated profit, but none of the associate's revenue does. Screener shows this as "Profit from Associates" (zero for Asian Paints in FY26). Trap: a large associate share can make PAT grow while the company's own revenue stalls, and the cash stays with the associate unless it pays dividends.
EPS: basic and diluted.
- Profit attributable
- PAT minus the minority share: the profit that belongs to the parent company's shareholders ("Profit for EPS" in the 5.2 table), in ₹ crore for the year.
- Weighted avg. shares
- The average number of shares in issue during the year, weighted by how long each share existed. A share issued halfway through the year counts as half a share. Bonus issues and splits are applied to every year shown (see the tip below).
- Potential shares
- Shares that may be created later from ESOPs, warrants or convertible bonds.
- Profit (adj.)
- Profit attributable, adjusted for what would change if those shares were created (for example, interest no longer paid on bonds that convert into shares).
- EPS
- Earnings per share, in ₹ per share.
How it works: basic EPS divides the year's profit by the shares that actually existed. Diluted EPS asks what EPS would be if every option and convertible became a share. The bottom of the fraction gets bigger, so diluted EPS is always less than or equal to basic EPS. A wide gap means meaningful future dilution.
Basic vs diluted
- Profit for EPS = ₹4,325 cr; EPS reported = ₹45.09 → implied shares \(= 4325/45.09 = 95.92\) crore (matches ₹96 cr equity capital at ₹1 face value).
- Hypothetically, suppose 0.5 crore ESOPs were outstanding: diluted EPS \(= 4325/(95.92+0.5) = ₹44.86\), about 0.5% lower than basic.
Pidilite issued 1:1 bonus shares (record date 23 Sep 2025), and HDFC Bank did the same (record date 27 Aug 2025). The share count doubled and the share price halved; nothing economic changed. Pidilite's equity capital went from ₹51 cr to ₹102 cr. Past EPS figures are restated for comparability: Pidilite's FY25 EPS now reads ₹20.41, not about ₹41. Always compare EPS on the same share basis.
Dividends. Paid out of profit to shareholders. They are not an expense in the P&L; they reduce retained earnings on the balance sheet and appear as a cash outflow under financing. Varsity's old example shows a "dividend distribution tax" paid by the company. That tax was abolished from 1 April 2020, and dividends are now taxed in shareholders' hands (chapter 13).
5.4 Growth: YoY, QoQ and CAGR
- \(X\)
- Whatever you want the growth of: revenue, EBITDA, PAT (₹ crore) or EPS (₹ per share).
- \(X_t\)
- The value in the latest period \(t\): this year, or this quarter.
- \(X_{t-1}\)
- The value one year earlier. For a quarter, use the same quarter a year earlier (YoY), not the previous quarter.
- \(X_{end}\), \(X_{start}\)
- The values in the last and the first year of the window.
- \(n\)
- The number of years between them. FY16 → FY26 is 10 years, not 11.
- CAGR
- Compound annual growth rate, as in 2.3: the steady yearly rate that links the start and end values.
How it works: for YoY growth, divide this period's figure by the same period a year earlier and subtract 1. A result of 0.18 means +18%; −0.05 means a 5% fall. CAGR squeezes a multi-year change into one yearly rate (2.3 explains the root). Count \(n\) as the gaps between years, not the number of columns in the table.
Ten-year growth
- Revenue: ₹14,271 cr (FY16) → ₹35,584 cr (FY26). CAGR \(= (35584/14271)^{1/10}-1 = 9.57\%\).
- PAT: ₹1,803 cr → ₹4,395 cr. CAGR = 9.32%. EPS CAGR (₹18.19 → ₹45.09) = 9.50%.
- FY26 vs FY25: revenue +4.95%, EBITDA +11.56%, PAT +18.46%. Profit grew faster than sales because margins recovered from FY25's dip (EBITDA margin 17.71% → 18.83%).
- Latest quarter (Jun 2026 vs Jun 2025): revenue ₹10,542 cr vs ₹8,939 cr, +17.93%; PAT ₹1,559 cr vs ₹1,117 cr, +39.57%.
Quarterly numbers should be compared YoY (same quarter last year), not QoQ, because many businesses are seasonal. Paint demand, for example, peaks before Diwali, and monsoon quarters are softer.
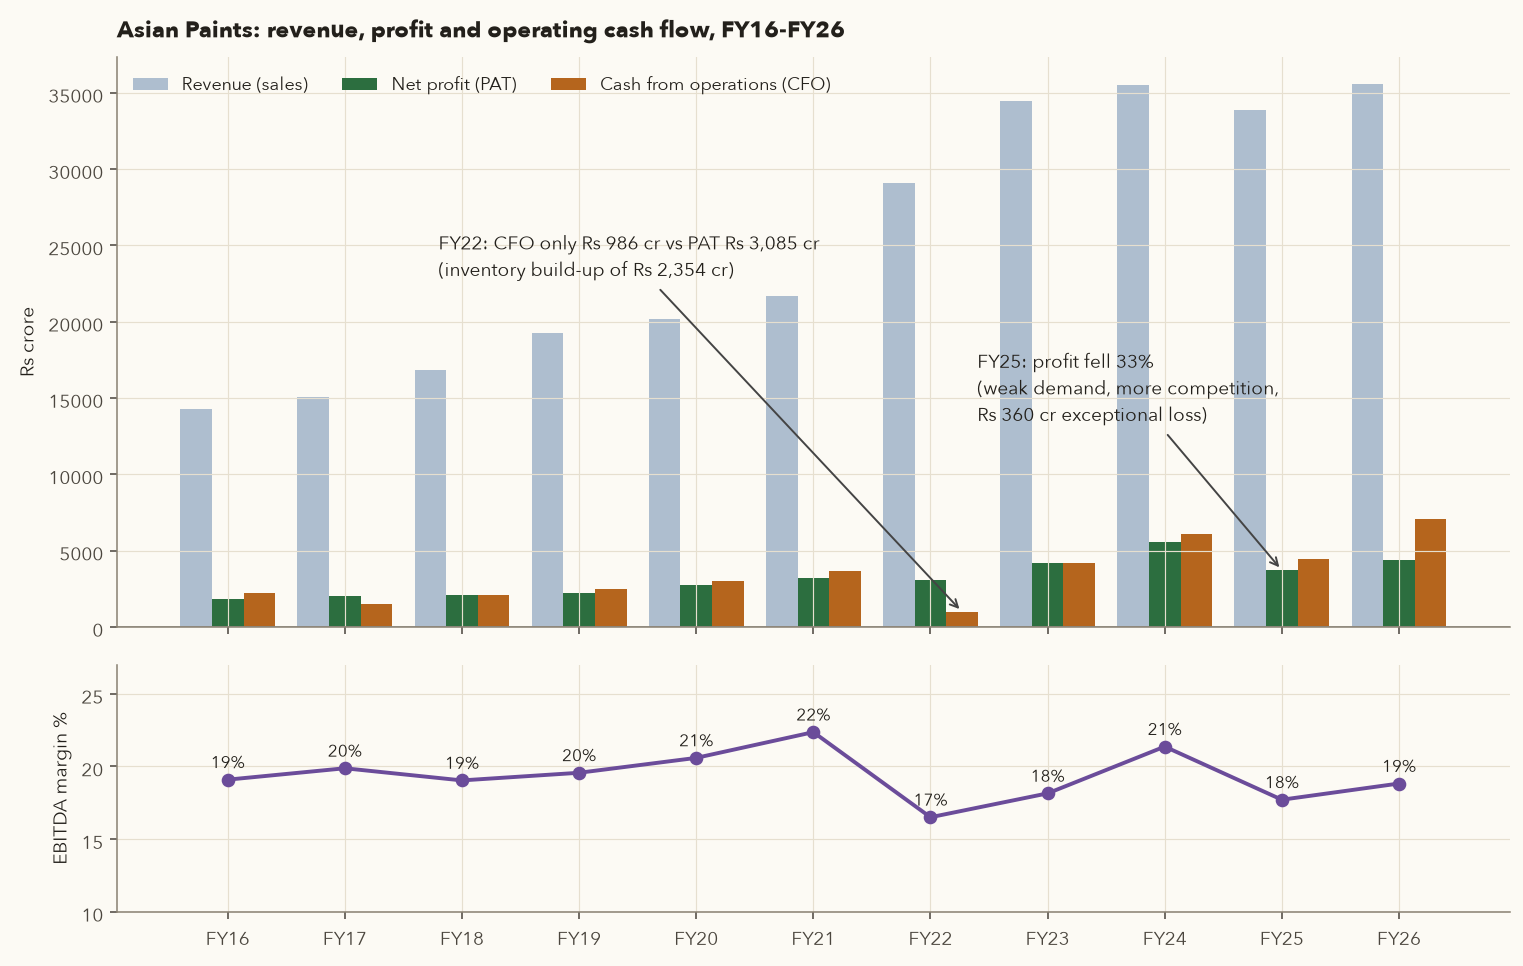
When a quality company stumbles
- FY25 revenue fell 4.48% (₹35,495 → ₹33,906 cr) and PAT fell 33.25% (₹5,558 → ₹3,710 cr).
- Three things hit together: weak demand, more competition (EBITDA margin fell from 21.37% to 17.71%), and ₹360 cr of exceptional charges (screener's pre-tax figure). Per the company's Q4 FY25 disclosure, these included impairment of goodwill on the White Teak and Causeway Paints acquisitions and a loss on disposing of PT Asian Paints Indonesia.
- Note what did not break: CFO stayed above PAT (₹4,424 cr vs ₹3,710 cr), and debt stayed tiny. The business weakened, but its accounts stayed clean. That is the difference between a slowdown and a red flag.
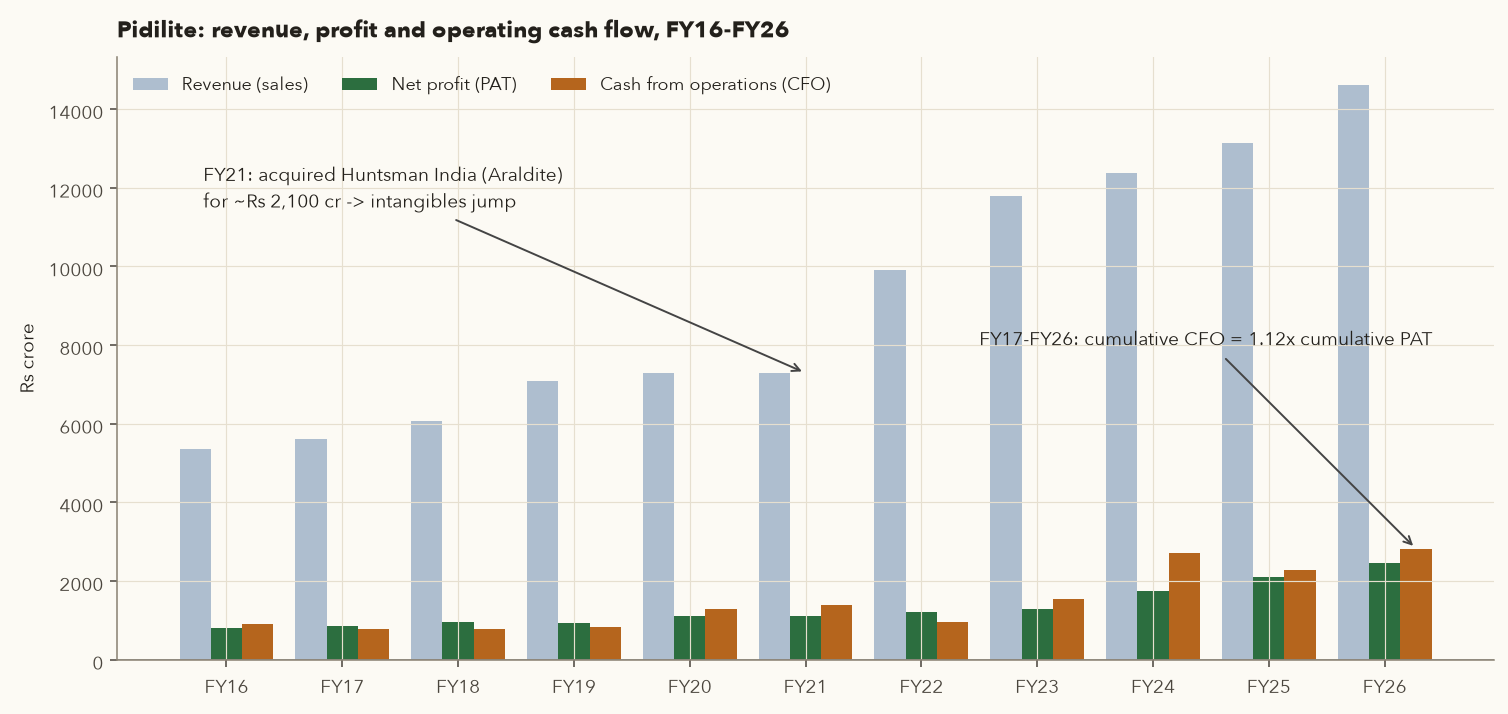
Input costs move margins, even for a strong brand
- Material cost as a share of sales: 46.30% (FY21) → 57.29% (FY23) → 44.44% (FY26). Pidilite's key inputs are petrochemical-based, and their prices spiked in 2021–22.
- EBITDA margin moved inversely: 23.1% (FY21) → 16.8% (FY23) → 24.1% (FY26).
- Lesson: when you read a margin decline, ask whether it is structural (lost pricing power, new competitors) or cyclical (input costs that will normalise). Pidilite's was cyclical: margins came back once input prices fell. Asian Paints' FY25 decline had a structural part (competition).
5.5 Cyclical businesses: Tata Steel
For a commodity producer, the selling price is set by the global market. Profits therefore swing with the cycle, and a single year's P&L means little.
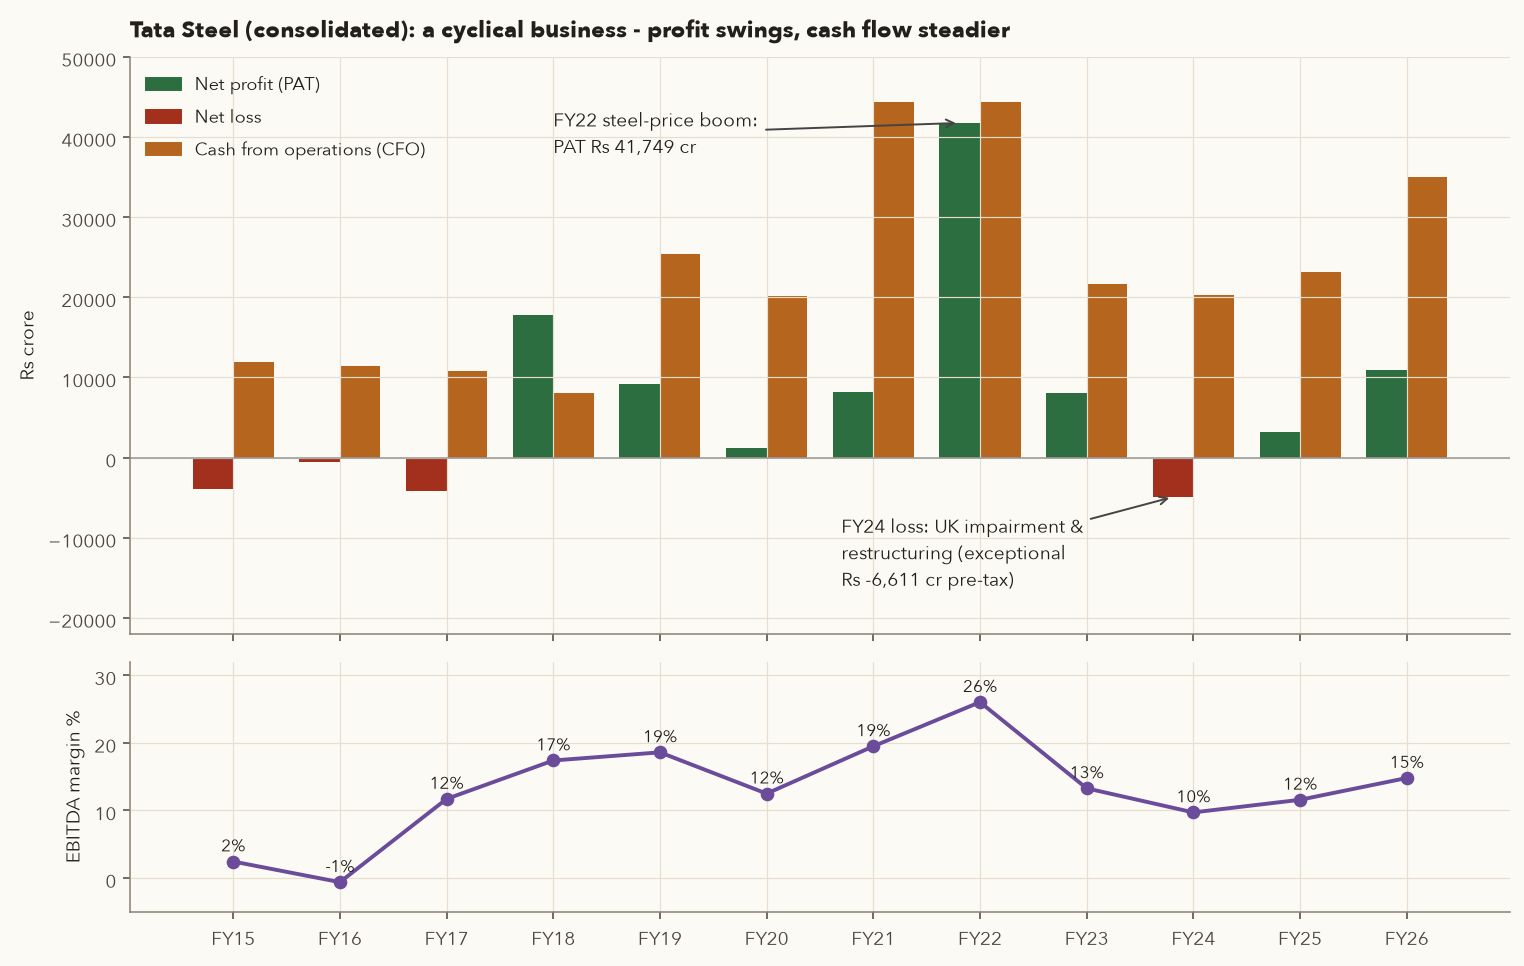
Peak, trough, recovery
- FY22 (steel price boom): revenue ₹2,43,959 cr, EBITDA ₹63,490 cr (26.0% margin), PAT ₹41,749 cr.
- FY24: revenue ₹2,29,171 cr (only 6% lower), but EBITDA ₹22,248 cr, 65% lower. Revenue barely moved while profit collapsed. That is operating leverage: costs are largely fixed, so small price changes produce large profit changes.
- FY24 also carried exceptional charges of ₹6,611 cr (pre-tax), mainly the UK restructuring (the plan to replace Port Talbot's blast furnaces with an electric arc furnace). In the Sep 2023 quarter alone, PAT was −₹6,511 cr after about ₹6,898 cr of exceptional charges (UK asset impairment plus restructuring provisions).
- FY26: EBITDA ₹34,352 cr (14.8% margin), PAT ₹10,886 cr, recovering.
For a cyclical company, the lowest P/E often comes at the peak of the cycle (profits are temporarily huge) and the highest P/E at the bottom. Judge cyclicals on average earnings across a full cycle (5–10 years), on balance-sheet strength to survive the trough, and on cost position. This matters for futures traders too: metal stocks can move 30–40% on commodity prices alone.
6. The Balance Sheet
The P&L is a video of a period; the balance sheet is a photograph on one date (31 March). It lists what the company owns (assets) and how those assets were funded: by owners (equity) or by others (liabilities). It is cumulative, the result of every transaction since the company was incorporated.
- Assets
- Everything the company owns or controls on the balance-sheet date: plants, inventory, receivables, cash, investments. In ₹ crore.
- Liabilities
- What it owes to outsiders: borrowings, money owed to suppliers (trade payables), lease liabilities, provisions.
- Shareholders' equity
- What belongs to the owners: share capital plus reserves. Also called net worth or book value.
How it works: the equation is always true, by construction. Rearranged, equity = assets − liabilities: what would be left for shareholders if every asset were sold at its book value and every debt were paid off. The Asian Paints balance sheet below shows both sides adding to the same total.
Logic: every rupee the company holds came from somewhere, either the owners or lenders and creditors. So the two sides must always be equal. From the company's point of view, even equity is something it owes, to its shareholders. That is why Varsity's (older format) statements show equity on the "liabilities" side.
6.1 Asian Paints balance sheet, 31 March 2026
| Equity and liabilities | ₹ cr | Assets | ₹ cr |
|---|---|---|---|
| Equity share capital | 96 | Fixed assets (net block) | 9,640 |
| Reserves & surplus | 21,276 | Capital work-in-progress (CWIP) | 1,849 |
| Shareholders' equity (net worth) | 21,372 | Investments | 7,062 |
| Borrowings: long-term | 1,247 | Inventories | 5,744 |
| Borrowings: short-term | 1,046 | Trade receivables | 4,462 |
| Lease liabilities | 1,636 | Cash & equivalents | 1,074 |
| Trade payables | 3,863 | Loans & advances | 27 |
| Non-controlling interest | 643 | Other assets | 4,662 |
| Advance from customers | 107 | ||
| Other liabilities & provisions | 4,604 | ||
| Total | 34,519 | Total | 34,519 |
The two sides match: ₹34,519 cr. (Each line is rounded to the nearest crore, so adding the rows by hand gives ₹34,518 and ₹34,520. Screener groups non-controlling interest with "other liabilities"; in the actual filing it sits within total equity.)
6.2 The equity side
Share capital = number of shares × face value. Asian Paints: 95.92 crore shares × ₹1 = ₹96 cr. Face value is a legal number, unrelated to market price.
Reserves & surplus is where the real value sits:
- Retained earnings (surplus): accumulated profits not paid out as dividends. This is the main link to the P&L.
- Securities premium: when shares are issued above face value, the excess goes here. Example: Adani Enterprises' ₹24,930 cr rights issue (Nov–Dec 2025; a rights issue offers new shares to existing shareholders in proportion to their holding) was priced at ₹1,800 a share, of which ₹1 is face value and ₹1,799 premium. Its reserves rose from ₹50,199 cr (FY25) to ₹80,797 cr (FY26).
- General reserve, capital reserve, other comprehensive income (OCI): transfers and items such as foreign-currency translation and actuarial gains/losses on employee benefits.
Rolling reserves forward (P&L → balance sheet)
- Opening reserves (31 Mar 2025): ₹19,304 cr.
- Add profit attributable to shareholders for FY26: + ₹4,325 cr.
- Subtract dividends paid during FY26 (from the cash flow statement): − ₹2,425 cr.
- Expected closing reserves: \(19304 + 4325 - 2425 = ₹21,204\) cr. Reported: ₹21,276 cr.
- The ₹72 cr gap is OCI, ESOP reserves, currency translation and similar items, shown in the "statement of changes in equity". A small gap is normal. A large unexplained one deserves a look.
6.3 Liabilities
| Item | Current / non-current | What it is | What to watch |
|---|---|---|---|
| Long-term borrowings | Non-current (due after 12 months) | Term loans, bonds, debentures | Trend vs equity and cash flow; interest rate; repayment schedule (notes) |
| Short-term borrowings | Current | Working-capital loans, commercial paper, current portion of long-term debt | Heavy reliance on short-term debt = refinancing risk |
| Lease liabilities | Both | Present value of future rent on long leases (Ind AS 116) | Matters for retailers and airlines |
| Trade payables | Current | Money owed to suppliers | Rising payables release cash, but stretching suppliers too far is unsustainable |
| Advance from customers | Current | Cash received before delivery | A sign of bargaining power (real estate, capital goods) |
| Provisions | Both | Estimated obligations: gratuity, leave encashment, warranties | Sudden reversals can inflate profit |
| Deferred tax liability | Non-current | Tax deferred by timing differences | Usually not a concern |
6.4 Assets
Fixed assets (property, plant & equipment). Shown at net block = gross block − accumulated depreciation.
Gross block − accumulated depreciation = net block
- Asian Paints: \(15{,}316 - 5{,}676 = ₹9{,}640\) cr. Matches the fixed-assets line exactly.
- Tata Steel: \(3{,}22{,}978 - 1{,}43{,}070 = ₹1{,}79{,}908\) cr. Matches.
- Accumulated depreciation divided by gross block tells you how "old" the asset base is: Asian Paints 37%, Tata Steel 44%. An old asset base means heavy replacement capex is coming.
Capital work-in-progress (CWIP). Plants and projects under construction. They are not yet depreciated and not yet earning. When a project is commissioned, CWIP moves into gross block and depreciation starts.
CWIP turning into fixed assets
- CWIP fell from ₹41,622 cr to ₹28,497 cr; fixed assets rose from ₹1,50,914 cr to ₹1,79,908 cr; gross block rose by ₹49,950 cr.
- Depreciation rose from ₹10,421 cr (FY25) to ₹11,955 cr (FY26), and to ₹3,640 cr in the Jun 2026 quarter alone (vs ₹2,744 cr a year earlier). New capacity is now being charged to the P&L.
- Lesson: when large CWIP gets capitalised, expect depreciation (and, if debt-funded, interest that was previously capitalised) to rise. Profit grows only if the new capacity produces enough extra EBITDA.
Goodwill and intangible assets. When a company buys another for more than the fair value of its net assets, the excess is recorded as goodwill. Acquired brands and customer relationships are intangibles. Goodwill is not amortised under Ind AS. Instead it is tested for impairment each year, and if the acquired business underperforms, it is written down (often as an exceptional item).
- Pidilite bought Huntsman's Indian business (the Araldite brand) for about ₹2,100 cr in November 2020. Intangible assets in its gross block jumped from ₹575 cr (FY20) to ₹3,048 cr (FY21).
- Asian Paints impaired goodwill and intangibles from its White Teak and Causeway Paints acquisitions in Q4 FY25: overpaid acquisitions eventually show up.
Large goodwill relative to equity means a big share of "assets" depends on acquisitions working out.
Investments. Non-current (strategic stakes, long-term bonds) and current (liquid mutual funds). Cash-rich companies like Pidilite (₹4,350 cr investments vs ₹417 cr borrowings) park surplus here.
Inventory. Raw materials, work-in-progress and finished goods. Trade receivables: money customers owe for goods sold on credit. Cash and equivalents: bank balances and very short-term deposits. Loans and advances: money lent to others, or advances to suppliers. Large loans to related parties are a classic red flag (Gensol, section 10).
6.5 Working capital and the cash conversion cycle
A manufacturer pays for raw materials, holds inventory, sells on credit, and only then collects cash. The time this takes ties up money.
- Receivables
- Trade receivables on the year-end balance sheet: money customers still owe, in ₹ crore.
- Revenue
- Sales for the year.
- Inventory
- Raw materials, work-in-progress and finished goods held at year-end.
- Payables
- Trade payables at year-end: money the company owes its suppliers.
- COGS
- Cost of goods sold for the year: what the goods sold cost to buy or make. Screener uses the material-cost line; other sources add manufacturing cost.
- 365
- Days in a year. Multiplying by it turns "a fraction of a year" into days.
- Debtor days: receivables ÷ a year's sales is the fraction of a year's sales not yet collected. Times 365, it is roughly how many days customers take to pay.
- Inventory days: how many days' worth of production cost is sitting in stock.
- Payable days: how many days the company takes to pay its suppliers. Supplier credit is free funding, so it is subtracted.
- Cash conversion cycle: the number of days the company's own cash is tied up between paying for materials and collecting from customers. Shorter is better; a negative cycle means suppliers fund the business.
These are "approximations" because they use year-end balances. Chapter 7 uses the average of opening and closing balances, which gives slightly different numbers.
Debtor days by hand
- Receivables ₹4,462 cr, revenue ₹35,584 cr.
- Debtor days \(= 4462/35584 \times 365 = 45.8\) days. Screener reports 46.
- Inventory and payable days need COGS (cost of goods sold: what the goods sold cost to buy or make). Screener uses the material-cost line for it: inventory days \(= 5744/17746 \times 365 = 118\), payable days \(= 3863/17746 \times 365 = 79\). Other sources add manufacturing cost to COGS and get lower day counts, so compare companies using one source only.
- Screener's FY26 figures: 118 inventory days + 46 debtor days − 79 payable days = 85 days with these rounded inputs; screener shows 84 days because it rounds only the final answer (FY25: 107 days). A shorter cycle means less cash is locked up.
Tata Steel shows a different pattern: debtor days of only 8 but inventory days of 184. Steel is sold quickly, often against advances, but iron ore, coal and finished steel sit in inventory for months. Chapter 7 covers these turnover ratios in detail.
6.6 Leverage: how much debt, and can it be serviced?
- \(D/E\)
- Debt-to-equity ratio, a plain number such as 0.90.
- Borrowings
- All debt at year-end: long-term and short-term borrowings plus lease liabilities (screener's "Borrowings" line), in ₹ crore.
- Equity
- Shareholders' equity at year-end: share capital plus reserves (6.2).
- Cash
- Cash and equivalents at year-end.
- Net debt
- The debt that would remain if all the cash were used to repay it. A negative figure means more cash than debt.
- PBT
- Profit before tax for the year.
- Interest
- Finance cost for the year, from the P&L.
- EBIT
- Earnings before interest and tax = PBT + interest. This version includes other income; chapter 7 also shows a stricter one without it.
How it works: D/E shows who funds the company. Above 1, lenders have put in more than the owners. Interest coverage adds interest back to PBT to get the profit available to pay interest, then asks how many times it covers the interest bill. Higher is safer. Below about 2× is a warning sign (section 10), and below 1× means operating profit did not cover the interest at all.
Debt-to-equity and coverage
- Equity = ₹1,247 + ₹1,00,920 = ₹1,02,167 cr. Borrowings = ₹92,382 cr (long-term ₹63,754, short-term ₹21,203, leases ₹7,425).
- D/E \(= 92382/102167 = 0.90\). Net debt = \(92382 - 10058 = ₹82,324\) cr.
- Interest coverage FY26 \(= (15969 + 7167)/7167 = 3.23\times\). In FY24 it was \((-1147 + 7508)/7508 = 0.85\times\): operating profit did not cover interest in the trough year.
- Compare Asian Paints (D/E 0.18, coverage 31.8×) and Pidilite (D/E 0.04, coverage 62.5×).
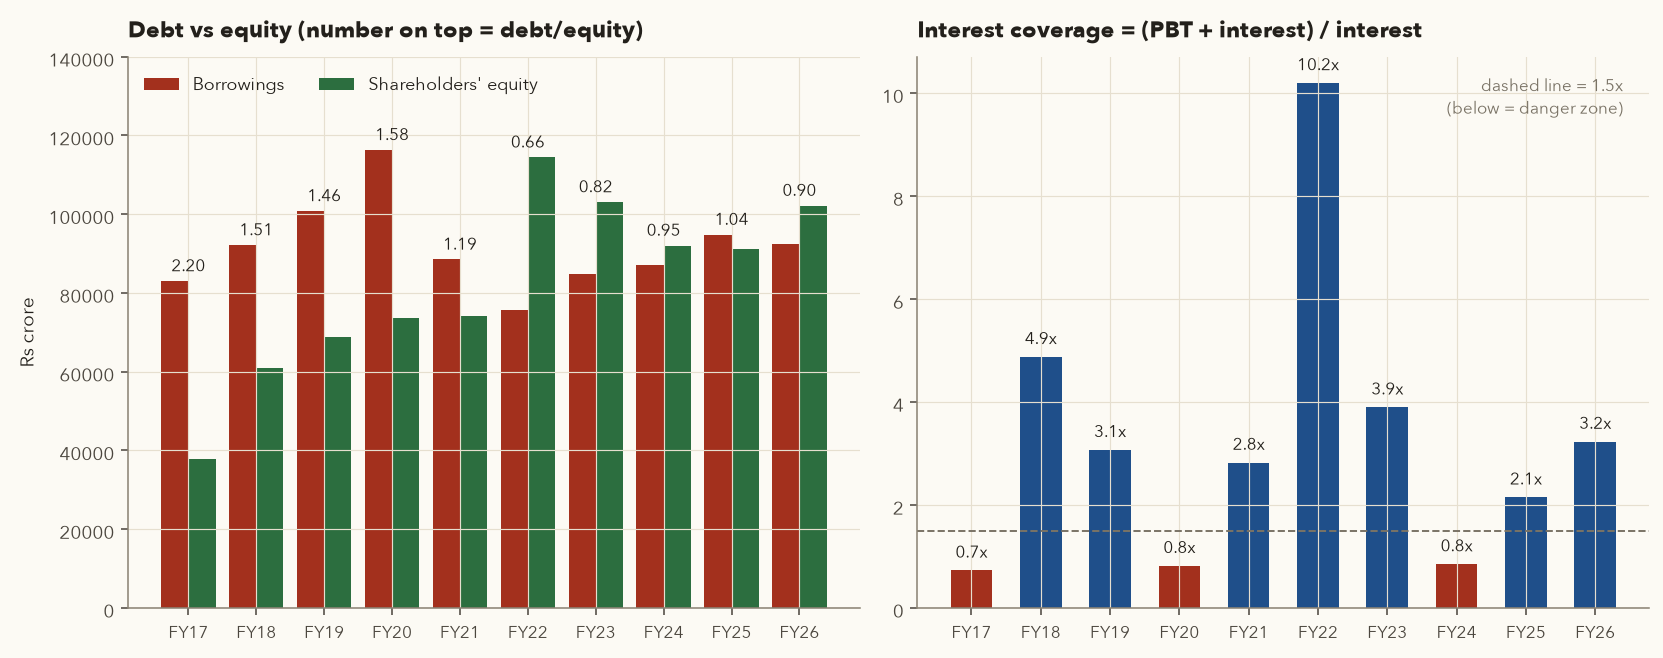
Interest must be paid in bad years too. A company with high debt and volatile profits can be forced to raise equity at the bottom (diluting you) or, in the worst case, default. Debt magnifies returns on the way up and losses on the way down. That is the same lesson as leverage in futures trading (chapter 9).
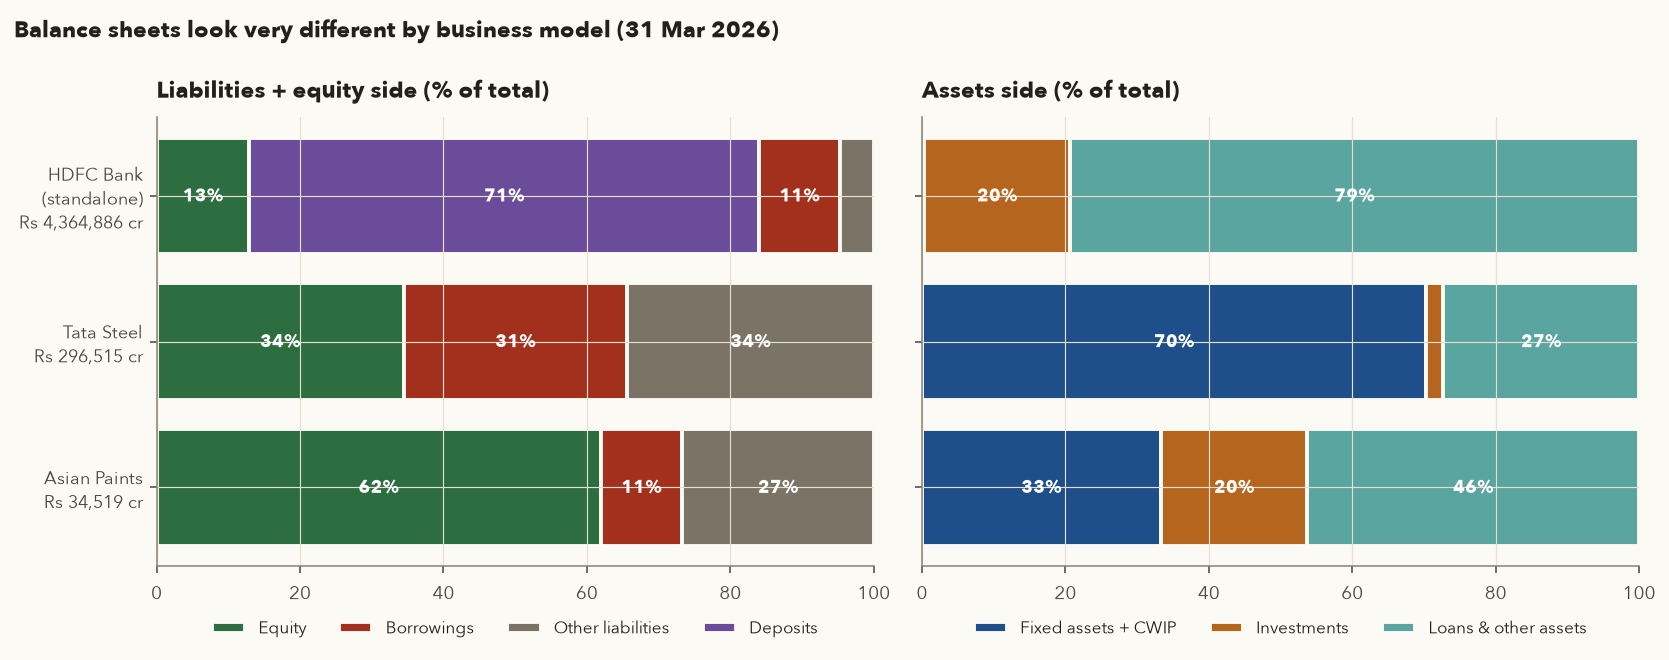
Asset-light vs capital-heavy: the same five lines tell you the business model
An IT services firm sells people's time and needs offices and laptops, not furnaces. A steel maker needs billions of rupees of plant before it sells a single tonne. The statements show the difference at a glance (consolidated, FY26, ₹ crore):
| Measure | TCS (IT services) | Asian Paints (consumer manufacturing) | Tata Steel (heavy industry) |
|---|---|---|---|
| Fixed assets ÷ total assets | 31,343 / 1,81,167 = 17% | 9,640 / 34,519 = 28% | 1,79,908 / 2,96,515 = 61% |
| Revenue per ₹1 of fixed assets | ₹8.5 | ₹3.7 | ₹1.3 |
| Capex (CFO − FCF) ÷ revenue | 4,081 / 2,67,021 = 1.5% | 1,484 / 35,584 = 4.2% | 13,158 / 2,32,140 = 5.7% |
| Depreciation ÷ EBITDA | 5,560 / 72,398 = 7.7% | 1,229 / 6,700 = 18.3% | 11,955 / 34,352 = 34.8% |
| Cumulative CFO ÷ PAT, FY22–26 | 1.01× | 1.09× | 2.45× |
| Inventory | None (inventory days blank) | 118 days | 184 days |
| Dividend payout (FY26) | 81% | 61% | 46% |
- TCS: almost every rupee of profit arrives as cash (CFO/PAT ≈ 1.0) and very little is needed for capex, so most of it is paid out (dividends and buybacks; CFF was −₹42,133 cr in FY26). Its main working-capital item is receivables (93 debtor days), because clients pay after the work is billed.
- Tata Steel: CFO is far above PAT only because depreciation is so large. Much of that cash must go back into plant just to stand still, which is why FCF, not CFO, is the number to watch.
- Takeaway: before judging any ratio, ask "how much capital does this business need to grow?" Asset-light businesses can grow while paying out most of their profit. Capital-heavy ones need debt or retained profit to grow, and that shows up as borrowings and CWIP. Chapter 7 turns this into return-on-capital ratios.
7. The Cash Flow Statement
Profit is an accounting opinion; cash is a fact. The P&L recognises revenue when goods are delivered, even if the customer has not paid. It deducts depreciation, which uses no cash in that year. It ignores the cash spent building inventory. The cash flow statement strips all that away and shows the actual movement in the bank balance, sorted into three buckets.
| Bucket | Includes | Healthy sign |
|---|---|---|
| CFO: cash from operating activities | Cash from customers minus cash paid to suppliers, employees, tax | Consistently positive, roughly in line with or above PAT |
| CFI: cash from investing activities | Capex (buying/selling fixed assets), buying/selling investments, acquisitions, interest and dividends received | Usually negative for a growing company (it is investing) |
| CFF: cash from financing activities | Borrowing and repaying debt, issuing shares, dividends, buybacks, interest paid | Negative for a mature, cash-generating company (it repays and pays dividends) |
- CFO, CFI, CFF
- Cash from operating, investing and financing activities for the year: the three sections of the cash flow statement (table above), in ₹ crore. Cash coming in is positive, cash going out is negative.
- Opening / closing cash
- Cash and equivalents at the start and at the end of the year (on two consecutive balance sheets).
- Capex (net)
- Cash spent buying fixed assets during the year, minus cash received from selling them. Both lines are in the investing section.
- FCF
- Free cash flow: cash the business generates after paying for the assets it needs. It is what is available for dividends, debt repayment or acquisitions.
How it works: because outflows already carry a minus sign, you simply add the three buckets to get the change in the bank balance. FCF takes operating cash and subtracts what had to be reinvested in plant and equipment. Positive FCF year after year means the business funds itself.
Example (Asian Paints FY26, built step by step in 7.1): net change \(= 7088 - 1328 - 2377 = +₹3{,}383\) cr. FCF \(= 7088 - (1487 - 3) = ₹5{,}604\) cr.
7.1 How CFO is built (indirect method)
Most Indian companies start from profit before tax and adjust:
- Add back non-cash expenses: depreciation, impairment, provisions.
- Remove non-operating items: subtract interest and dividend income and gains on selling investments (their cash belongs in CFI); add back finance cost (it goes in CFF).
- Adjust for working-capital changes. This is the part to understand properly:
| Change during the year | Effect on cash | Why |
|---|---|---|
| Receivables ↑ | Cash ↓ | Sales booked, but customers haven't paid yet |
| Inventory ↑ | Cash ↓ | Cash spent on goods not yet sold |
| Payables ↑ | Cash ↑ | Bought on credit, not yet paid |
| Advances from customers ↑ | Cash ↑ | Cash received before delivery |
The general rule, from Varsity: an increase in an asset uses cash; an increase in a liability provides cash. Finally, subtract taxes actually paid.
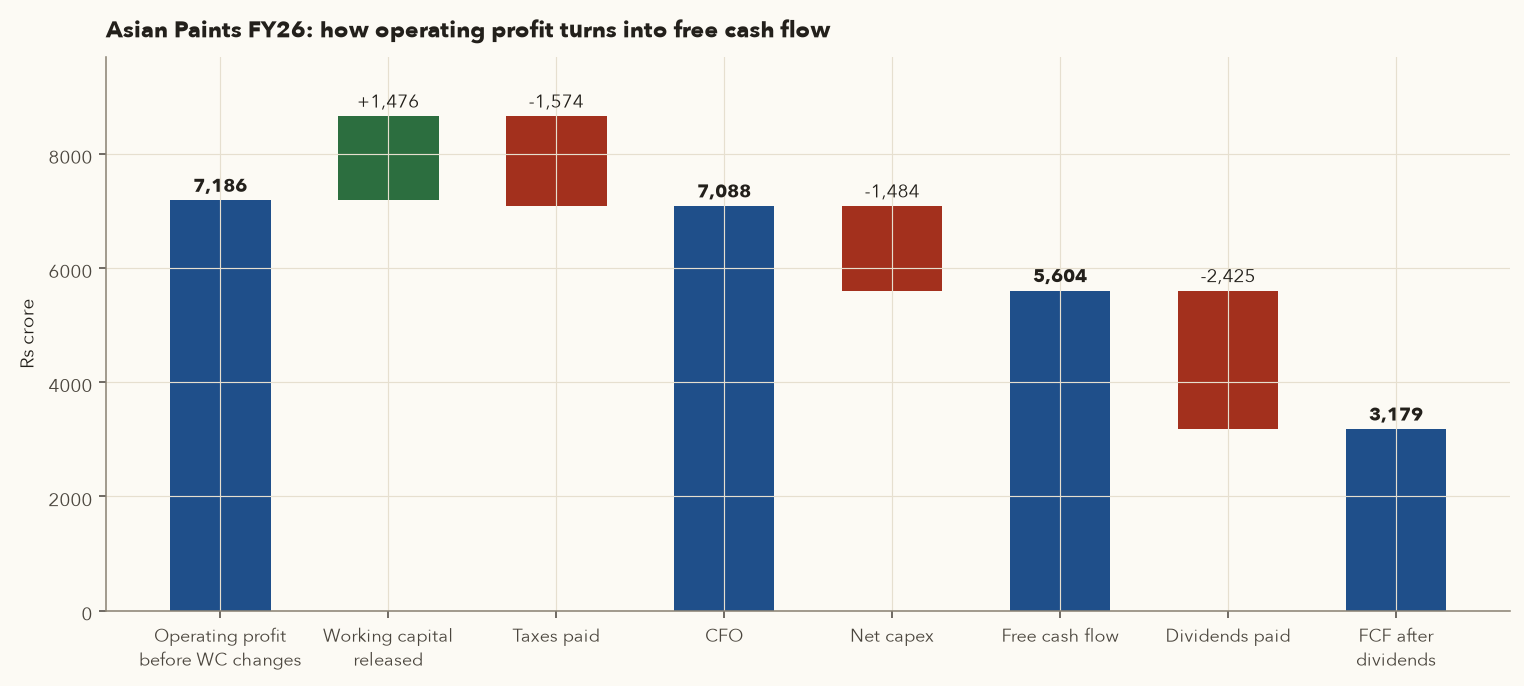
From operating profit to free cash flow
- Operating profit before working-capital changes: ₹7,186 cr.
- Working capital released: +₹1,476 cr (inventory down: +₹976; receivables up: −₹274; payables up: +₹396; other: +₹378).
- Taxes paid: −₹1,574 cr. CFO \(= 7186 + 1476 - 1574 = ₹7,088\) cr.
- Net capex = fixed assets bought ₹1,487 cr − sold ₹3 cr = ₹1,484 cr. FCF \(= 7088 - 1484 = ₹5,604\) cr.
- Dividends paid: ₹2,425 cr. Cash left after dividends: ₹3,179 cr.
- Totals: CFO +₹7,088, CFI −₹1,328, CFF −₹2,377 → net change \(= +₹3,383\) cr.
- CFO/PAT = 7088/4395 = 1.61×, unusually strong because inventory was cut.
The year profit did not turn into cash
- PAT ₹3,085 cr, but CFO only ₹986 cr (32% of PAT).
- Working capital absorbed ₹2,795 cr: inventory −₹2,354 cr, receivables −₹1,326 cr, payables +₹644 cr, other items +₹242 cr. Raw-material prices were soaring and the company stocked up.
- Calculation: \(4957 - 2795 - 1176 = 986\) (operating profit − working capital − taxes).
- Over the next two years CFO recovered to ₹4,193 cr and ₹6,104 cr as the inventory was used up. One weak year with a clear explanation is not a red flag. A persistent gap is.
7.2 CFO vs PAT across companies
The most useful earnings-quality test: over several years, does operating cash flow keep up with reported profit?
- \(\Sigma\)
- "Sigma" means add up: total the yearly figures over the window.
- CFO
- Cash from operating activities for each year, in ₹ crore.
- PAT
- Profit after tax for each of the same years.
- Window
- The same years on top and bottom, at least 3–5, so that one odd year (like Asian Paints' FY22) does not dominate.
How it works: add up CFO over the window, add up PAT over the same years, and divide. A result of 1.0× means every rupee of reported profit arrived as cash. Above 1 is normal for capital-heavy companies, because depreciation is added back. Persistently below 1 needs an explanation, and below 0 means operations used up cash while the P&L showed a profit. The framework's quality scorecard uses the 5-year version.
Example (Gensol FY22–24, from the list below): PAT added up to ₹87 cr, CFO to −₹33 cr. Cash conversion \(= -33/87 = -0.38\times\).
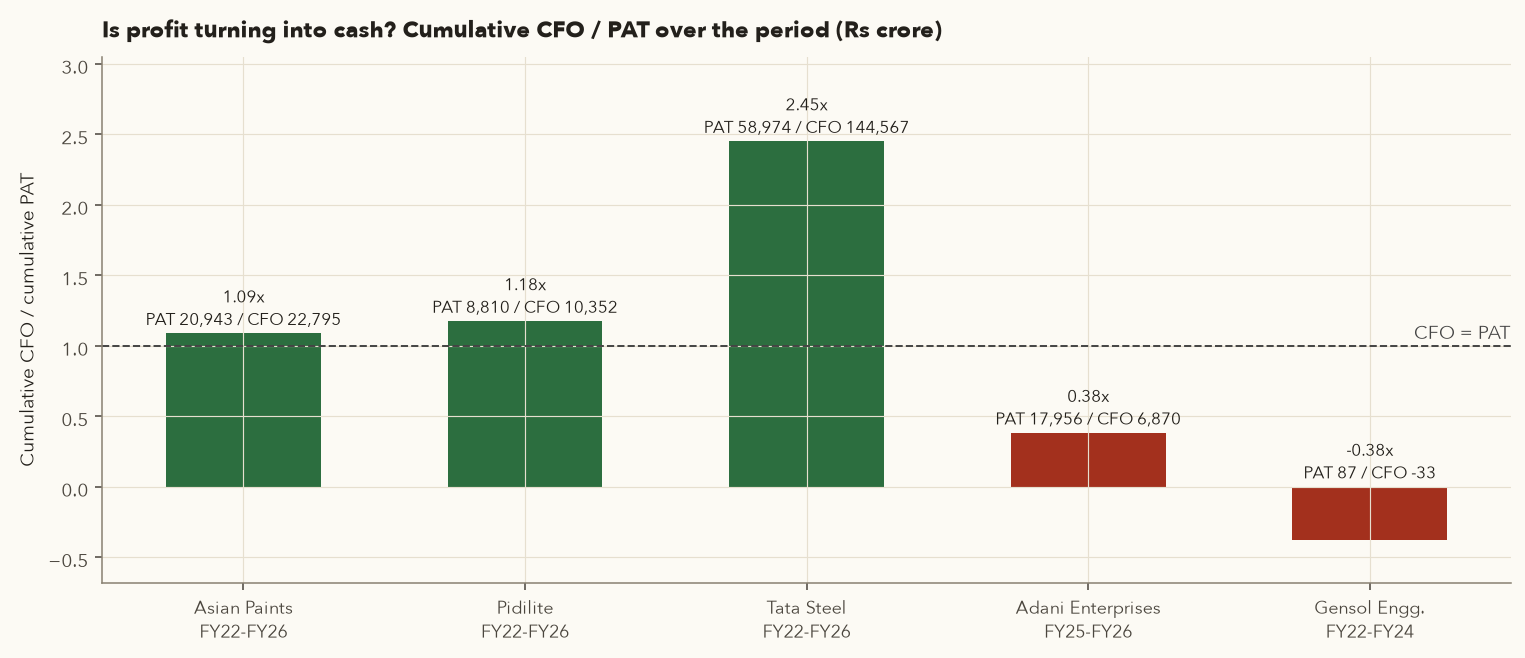
- Asian Paints 1.09×, Pidilite 1.18× (FY22–26). Healthy. Cash slightly exceeds profit because depreciation is added back.
- Tata Steel 2.45×. Normal for a capital-heavy business: ₹9,000–12,000 cr of depreciation a year (FY22–26) is a non-cash charge in the P&L. The real question for Tata Steel is FCF after its heavy capex: FY22–26 cumulative FCF was ₹75,502 cr, used largely to reduce debt and pay dividends. In FY26 it repaid ₹23,916 cr and borrowed ₹15,954 cr.
- Adani Enterprises 0.38× (FY25–26). PAT was ₹8,005 cr and ₹9,951 cr, but CFO was ₹4,513 cr and ₹2,357 cr. The main reason is not hidden: much of the profit came from exceptional gains on selling stakes (in FY26, about ₹9,215 cr per the company, mainly from exiting AWL Agri Business and selling cement units to Ambuja). The cash from those sales is recorded under CFI, not CFO. Over FY22–26 as a whole, its CFO/PAT was 1.48×. This is why you reconcile before you judge (more in section 10).
- Gensol −0.38× (FY22–24). Reported PAT of ₹87 cr; CFO of −₹33 cr. The profits were never collected in cash. That was the prelude to collapse (section 10).
7.3 Reading the pattern of the three buckets
| CFO | CFI | CFF | Typical story | Example (FY26) |
|---|---|---|---|---|
| + | − | − | Mature, self-funding: invests and still repays debt / pays dividends | Asian Paints (+7,088 / −1,328 / −2,377); Tata Steel (+35,064 / −14,397 / −21,387) |
| + | − (large) | + | Expanding faster than internal cash allows: borrowing or raising equity | Adani Enterprises (+2,357 / −27,680 / +28,484) |
| − | − | + | Operations consume cash and growth is funded by debt. Dangerous if it persists. | Gensol FY24 (−98 / −668 / +859) |
| + | + | − | Selling assets to repay debt (could be healthy restructuring or distress) | (context needed) |
A company in a big investment phase (new plants, airports, data centres) will show negative FCF for years. That is not automatically bad: what matters is whether those investments later earn good returns, and whether the balance sheet can carry the debt meanwhile. Adani Enterprises' cumulative FCF over FY22–26 was −₹75,217 cr, funded by debt (borrowings ₹1,06,622 cr in FY26) and equity (the rights issue). Investing in such a phase is a bet on execution. Size any position with that risk in mind.
8. How the three statements connect
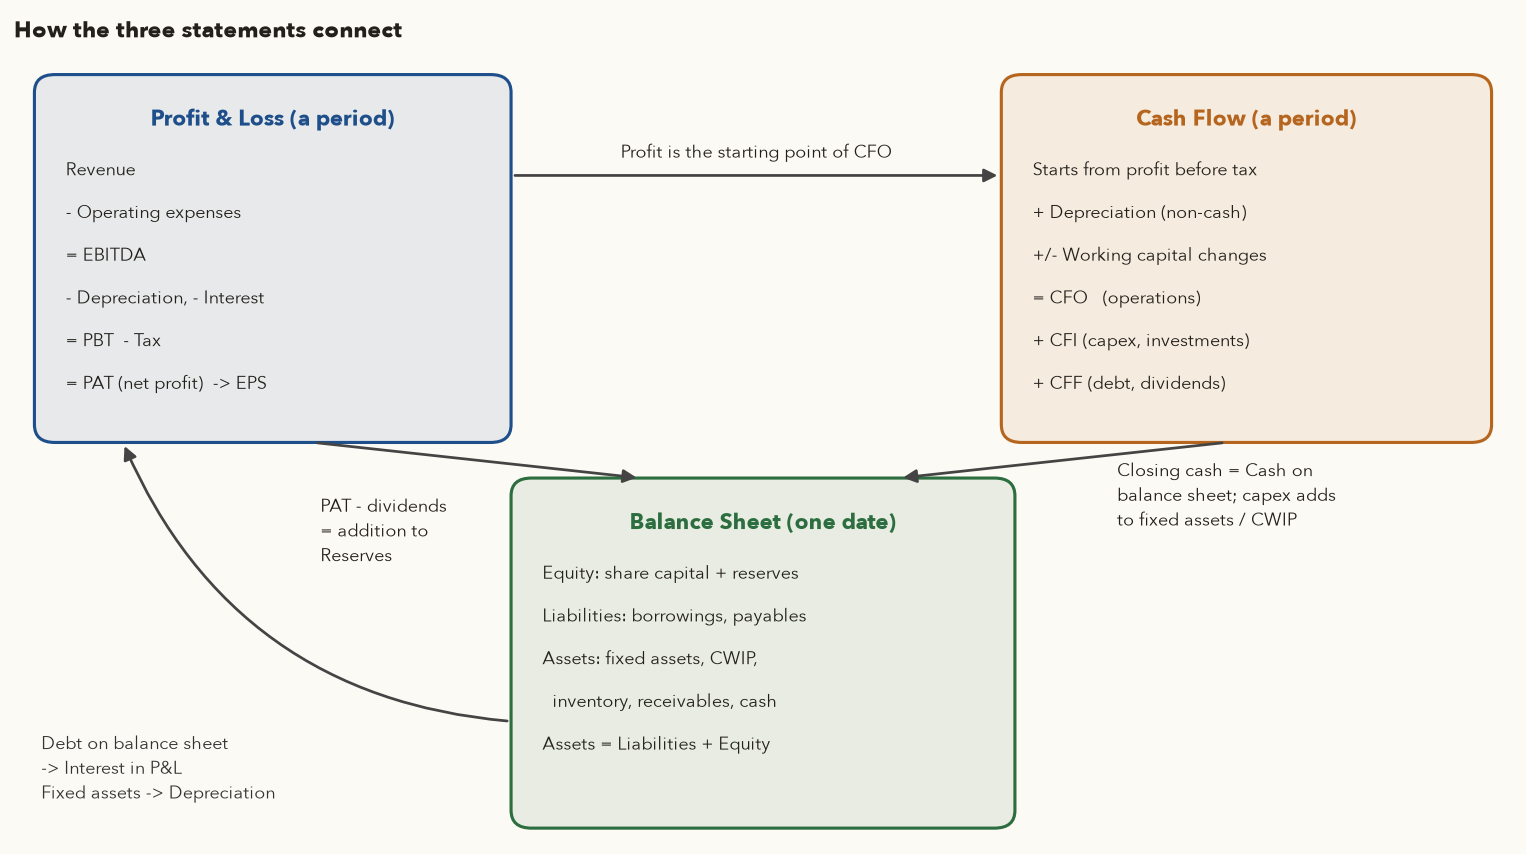
Using Asian Paints FY26 numbers, here are the links Varsity lists, made concrete:
| Event | P&L | Balance sheet | Cash flow |
|---|---|---|---|
| Profit earned, dividends paid | PAT to owners ₹4,325 cr | Reserves ₹19,304 → ₹21,276 cr | Dividends ₹2,425 cr in CFF |
| Sales on credit | Revenue ₹35,584 cr | Receivables ₹4,314 → ₹4,462 cr | Receivables increase reduces CFO |
| Inventory used up | Material cost (via change in inventories) | Inventory ₹6,719 → ₹5,744 cr | +₹976 cr to CFO |
| Capex on plants | Depreciation ₹1,229 cr (slowly) | Gross block ₹14,099 → ₹15,316 cr; CWIP ₹1,849 cr | ₹1,487 cr in CFI (immediately) |
| Borrowing | Finance cost ₹195 cr | Borrowings ₹2,290 → ₹3,929 cr | Proceeds ₹1,279 cr, repayments ₹452 cr, interest paid ₹228 cr in CFF |
| Surplus cash invested | Other income (interest/dividends) ₹889 cr | Investments ₹4,725 → ₹7,062 cr | Investments bought/sold in CFI |
| Net change in cash | — | Cash & equivalents on the asset side | CFO + CFI + CFF |
Changes in balance-sheet items between two years won't always equal the cash-flow figures exactly. Acquisitions bring in a subsidiary's receivables without any cash moving through working capital; currency translation changes values; and definitions differ (some bank balances and liquid investments sit in lines other than "cash and equivalents"). Small differences are normal. The direction and rough size should agree. If they wildly disagree, read the notes.
framework.data.fetch_fundamentals(symbol) will download screener.in's P&L, balance sheet, cash flow, ratios and quarterly tables as DataFrames. framework.fundamentals.ratios(fin) computes the margins, growth, CFO/PAT and leverage numbers from this chapter, and framework.fundamentals.quality_scorecard(symbol) combines them into a checklist score (chapter 7 adds the Piotroski F-score and DuPont analysis). The CLI python -m framework.invest ASIANPAINT prints the scorecard. You will build the full version in chapter 17.
9. Why banks are different (HDFC Bank)
For a manufacturer, money is a means to make products. For a bank, money is the product. Deposits are its raw material, loans are its inventory, and interest is its revenue. Normal metrics break: "debt-to-equity" is meaningless (deposits are technically debt), and "CFO" swings wildly because lending and deposit-taking count as operating activities.
9.1 The bank P&L
- Interest earned
- Interest the bank receives on its loans and investments during the year: its main revenue. In ₹ crore.
- Interest expended
- Interest the bank pays on deposits and borrowings: the cost of its raw material, money.
- NII
- Net interest income: the difference, the bank's core earnings.
- Avg interest-earning assets
- Loans, investments and other assets that earn interest, averaged over the year (for example, opening plus closing, divided by 2). Some banks quote NIM on total assets instead (see the example).
- NIM
- Net interest margin, as a %: the bank's version of a margin.
- Other income
- Fees, commissions, treasury gains and one-offs.
- Operating expenses
- Salaries, branches, technology and depreciation. (Screener shows depreciation on its own line, which is why the example subtracts it separately.)
- Provisions
- Money set aside in the year for loans that may not be repaid. This is a bank's main risk cost.
- Tax
- Tax expense for the year.
- NII is what the bank earns on its loans minus what it pays for the money it lends.
- NIM divides NII by the assets that earned it, so banks of different sizes can be compared. Higher usually means cheaper deposits or higher-yield loans. On interest-earning assets, HDFC Bank's is about 3.4–3.5%.
- PAT adds fee and other income, then subtracts running costs, provisions for bad loans and tax.
NII and an approximate NIM by hand
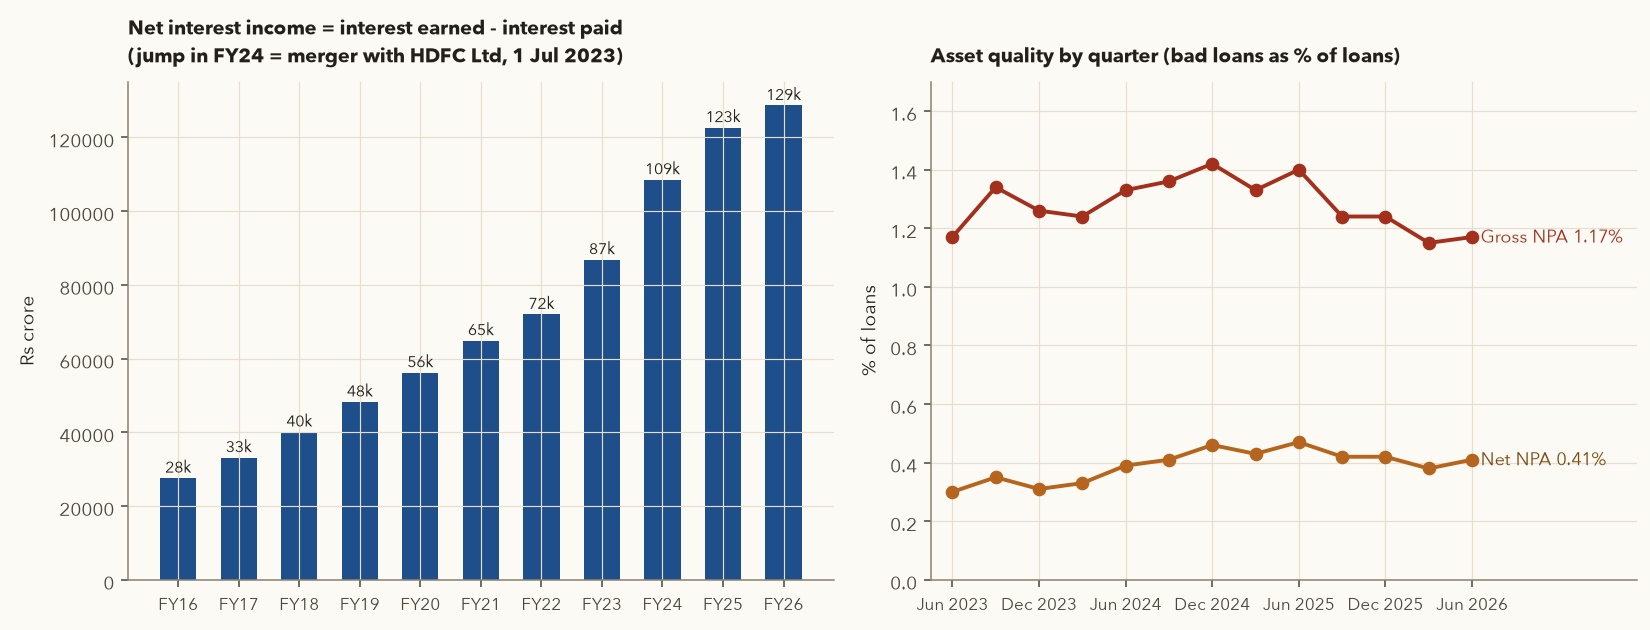
- Interest earned ₹3,07,522 cr − interest expended ₹1,78,836 cr = NII ₹1,28,686 cr, up 4.90% from ₹1,22,670 cr in FY25.
- Average total assets = (₹39,10,199 + ₹43,64,886)/2 = ₹41,37,542 cr. NII/average total assets = 3.11%. That is a proxy, because not all assets earn interest.
- The bank's own reported NIM for Q1 FY27 (Jun 2026 quarter) was 3.26% on total assets, down from about 3.4% in the March 2026 quarter. On interest-earning assets only, the bank shows about 3.4% (Jun 2026) and 3.5% (Mar 2026). That figure is higher because the denominator is smaller, so always check which base a reported NIM uses.
- Other income ₹62,533 cr (fees, treasury, one-offs); operating expenses plus provisions ₹92,392 cr; depreciation ₹3,658 cr. PBT \(= 128686 + 62533 - 92392 - 3658 = ₹95{,}169\) cr; PAT ₹74,671 cr.
- Return on assets ≈ \(74671/4137542 = 1.80\%\). Leverage: total assets/equity = \(4364886/562901 = 7.8\times\). Banks run on thin margins and high leverage, which is why asset quality is everything.
9.2 The metrics that matter for banks
| Metric | Meaning | HDFC Bank (latest) |
|---|---|---|
| CASA ratio | Current + savings deposits ÷ total deposits. These pay little or no interest, so a higher CASA means cheaper funding and a better NIM. | 32% (Jun 2026) vs 34% (Mar 2026) and 35% (Mar 2025): falling, one reason for the lower NIM |
| Gross NPA % | Loans overdue more than 90 days ÷ total loans | 1.17% (Jun 2026) |
| Net NPA % | NPAs after provisions ÷ net loans | 0.41% (Jun 2026) |
| Provision coverage ratio | Provisions held ÷ gross NPAs | See the bank's results presentation (not extracted here) |
| Capital adequacy (CAR / CET1) | Capital ÷ risk-weighted assets; the regulatory safety buffer. CET1 (Common Equity Tier 1) is the highest-quality part: share capital plus retained earnings. | 19.6% CAR, 17.4% CET1 (Jun 2026) |
| Cost-to-income | Operating expenses ÷ (NII + other income) | 39.2% core (Q1 FY27) |
| Credit growth vs deposit growth | Loans growing much faster than deposits strains funding | Deposits +14.39% in FY26 (screener) |
One-offs that cancel out
- In the Jun 2025 quarter, standalone "other income" was ₹21,730 cr against ₹12,028 cr the quarter before, and "expenses" (opex plus provisions) were ₹31,875 cr against ₹20,750 cr.
- The cause: a one-time gain of about ₹9,128 cr (pre-tax, standalone) from selling HDB Financial Services shares in its IPO, while the bank also booked ₹9,000 cr of floating provisions and ₹1,700 cr of additional contingent provisions, a buffer not tied to specific bad loans.
- PAT for the quarter (₹18,155 cr) looked normal, but both the income and the cost lines were distorted. Read the notes to results before comparing quarters.
When a bank's books are wrong
- In March 2025 IndusInd Bank disclosed discrepancies in accounting for its internal derivative trades; an external review put the impact at about ₹1,979 cr (as of 30 June 2024).
- Later reviews found ₹674 cr of microfinance interest income wrongly recorded over three quarters of FY25, and ₹595 cr of unsubstantiated balances in "other assets".
- Q4 FY25 showed a net loss of ₹2,329 cr; the CEO and deputy CEO resigned.
- Lesson: banks are opaque and highly leveraged, so a small accounting hole can wipe out a lot of equity. Unexplained "other assets", and auditor or RBI observations, deserve attention.
Chapter 7 goes deeper into bank ratios (ROA, ROE, credit cost, slippage ratio). For now, remember: for banks, use NII, NIM, CASA, GNPA/NNPA, capital adequacy, not EBITDA, D/E or CFO.
10. Red flags in financial statements
Most frauds and blow-ups give warning signs in the statements well before the price collapses. None of these signals proves wrongdoing; each is a reason to dig deeper, demand a clear explanation, or simply move on. There are thousands of other stocks.
| Red flag | Why it matters | How to check |
|---|---|---|
| Receivables growing much faster than sales | Sales may be booked but not collected, or channel-stuffed | Debtor days trend; receivables growth vs revenue growth |
| CFO persistently far below PAT | Profits not converting to cash; possible aggressive accounting | 3–5 year cumulative CFO/PAT |
| Debt rising faster than the business; low interest coverage | Fragility; refinancing and default risk | D/E, coverage < 2×, short-term debt share |
| Frequent "exceptional" items | Recurring costs disguised as one-offs, or profits propped up by one-off gains | Profit before exceptional items, over years |
| Other income large relative to PBT | The core business may be weak | Other income ÷ PBT |
| Large or rising loans/advances to related parties | Classic route for siphoning cash | Related-party note; "loans and advances" line; CARO report |
| Rising contingent liabilities | Potential future hits not on the balance sheet | Contingent liabilities ÷ net worth |
| Auditor qualification, resignation, or frequent auditor changes | The auditor could not verify or disagrees | Auditor's report; exchange filings |
| Promoter shares pledged, especially rising pledges | A price fall can trigger forced selling by lenders, a downward spiral; also signals promoter cash stress | Quarterly shareholding pattern; SAST Reg 31 disclosures |
| CWIP that never gets capitalised; capitalising expenses | Inflates assets and profits | CWIP trend vs project timelines |
| Changes in accounting policy (depreciation life, revenue recognition) | Can manufacture profit growth | Accounting-policy note; auditor's emphasis |
| Delayed results, rating downgrades, independent directors resigning | Often the last warning before a collapse | Exchange announcements; rating rationales |
- Contingent liabilities
- Possible obligations listed in the notes to accounts: disputed tax demands, legal claims, guarantees given for others' loans. They are not on the balance sheet. In ₹ crore, at year-end.
- Net worth
- Shareholders' equity: share capital plus reserves.
- Shares pledged
- Promoter shares given to lenders as security for loans ("pledged or otherwise encumbered" in the quarterly shareholding pattern). A number of shares.
- Shares held
- The total number of shares the promoter group owns.
How it works: both are fractions; multiply by 100 for a percentage. The first compares what might have to be paid with the owners' capital: about 5% is noise, while 50% could threaten the company (4.2). The second shows how much of the promoters' own stake lenders could sell if the price falls. For both, the trend matters most: a ratio rising year after year (or quarter after quarter, for pledges) is the warning sign.
Contingent liabilities and promoter pledges
- Net worth ₹2,000 cr in both years. Contingent liabilities (disputed tax ₹150 cr, guarantees for a promoter group firm's loans ₹250 cr) total ₹400 cr last year and ₹900 cr this year. The ratio has risen from \(400/2000 = 20\%\) to \(900/2000 = 45\%\). It has more than doubled, and the guarantees for a related party are the worrying part: if that firm defaults, the listed company pays.
- Promoters hold 50 crore shares and have pledged 20 crore of them. Pledge = \(20/50 = 40\%\) of their holding, or \(20/100 = 20\%\) of the company's 100 crore shares.
- Why the pledge matters: lenders often ask for shares worth about twice the loan as collateral. If the share price falls 30–40%, they demand more shares or sell the pledged ones in the market. That selling pushes the price down further, a spiral that hurt many Indian mid-caps (and Gensol, below). A pledge that keeps rising quarter after quarter is the warning sign. A small pledge that is falling is much less of a concern.
10.1 Case: Gensol Engineering (2024–2026)
Gensol was a solar EPC (engineering, procurement and construction: it built solar plants for clients) and EV-leasing company whose stock rose sharply in 2023–24. The statements carried several of the flags above before the collapse.
Warning signs, then the event
- Profit without cash. FY24 revenue ₹963 cr (+142%), PAT ₹53 cr, but CFO −₹98 cr. FY22–24 cumulative: PAT ₹87 cr, CFO −₹33 cr.
- Debt explosion. Borrowings ₹598 cr (Mar 2023) → ₹1,510 cr (Mar 2024) against equity of ₹326 cr: D/E \(= 1510/326 = 4.63\). Interest cost rose from ₹24 cr to ₹110 cr. Coverage \(= (78+110)/110 = 1.71\times\).
- Receivables outpacing sales. In FY24 receivables rose 212% (₹73 → ₹228 cr), faster than the 142% sales growth; debtor days 86.
- Loans and advances. "Loans n advances" jumped from ₹123 cr (Mar 2024) to ₹922 cr (Sep 2024), a 7.5× increase in six months, in a company whose business was not lending.
- Funding gap. FY24 cash flows: CFO −98, CFI −668, CFF +859. Growth was funded entirely by borrowing.
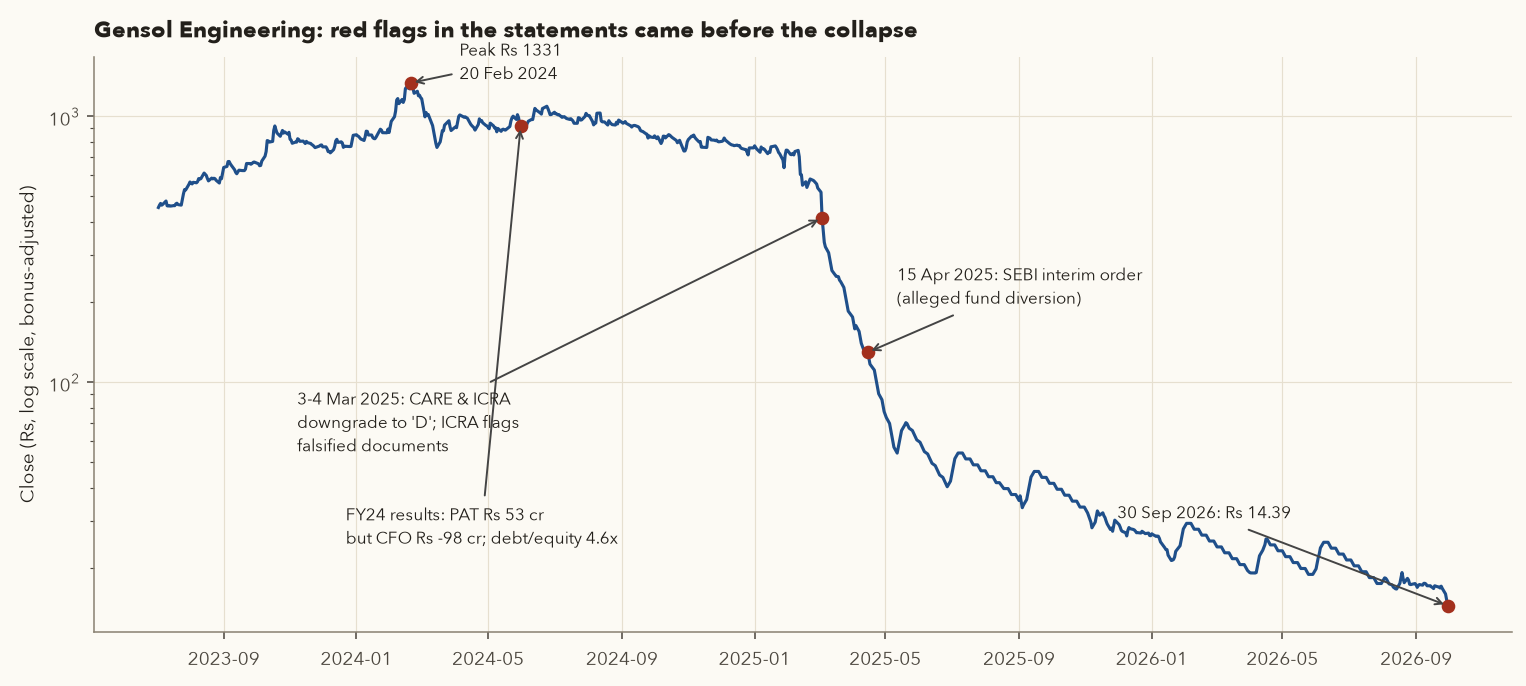
- The events. On 3–4 March 2025, CARE and ICRA downgraded Gensol's debt to "D" (default) over debt-servicing delays; ICRA said documents Gensol had shared about its servicing record appeared to be falsified. On 15 April 2025 SEBI passed an interim order alleging that promoters diverted company funds (including loan money meant for EVs) and barred them from the market. Lenders invoked pledged promoter shares. Screener shows no quarterly results after the Dec 2024 quarter, another flag in itself.
- The price. Peak close ₹1,331 (20 Feb 2024) → ₹129.14 on the day of the SEBI order → ₹14.39 on 30 Sep 2026: \(14.39/1331 - 1 = -98.9\%\).
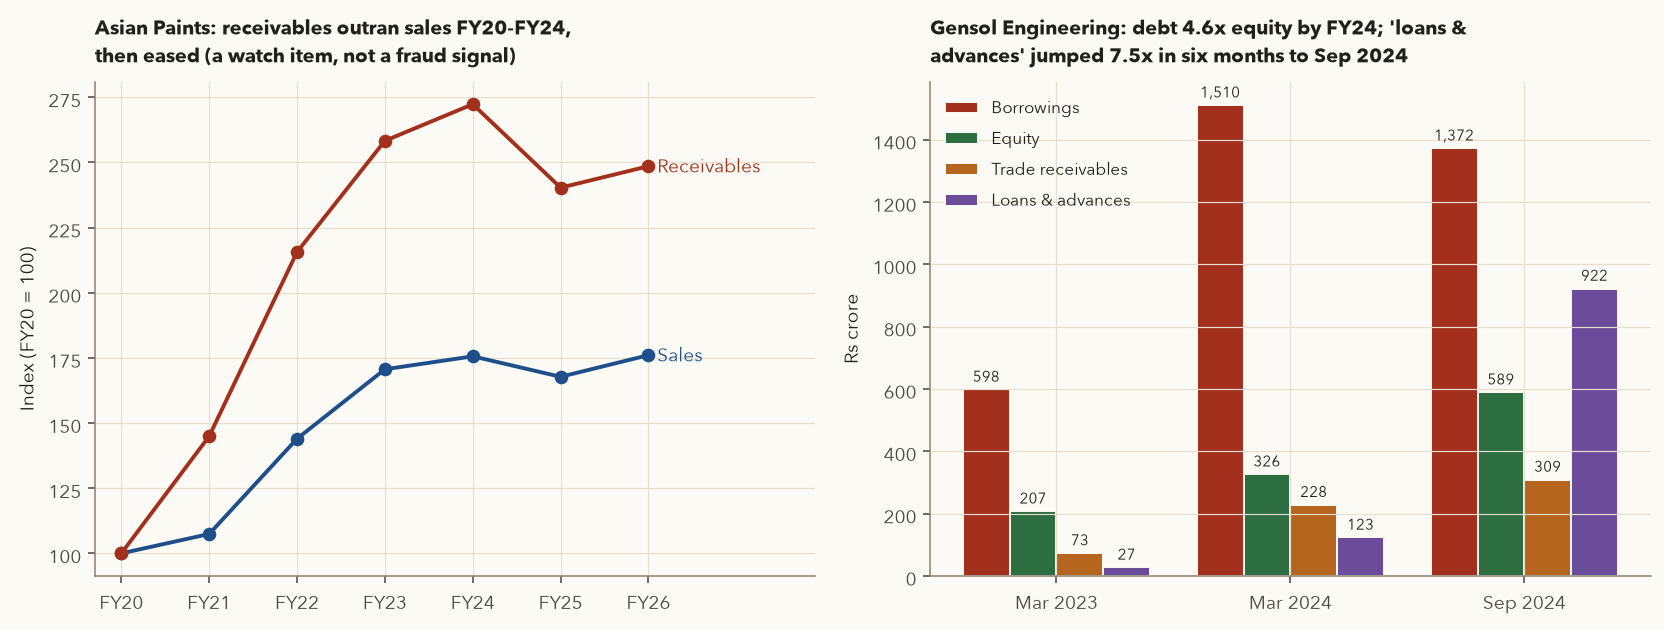
The left panel matters as much as the right. Asian Paints' receivables also outgrew sales for several years, yet its CFO stayed above PAT in most years and its audits were clean. One flag on its own, in a company with strong cash flow and clean audits, is a question, not a verdict. Gensol had many flags at once (negative CFO, exploding debt, related-party-style advances, rating downgrades, pledges). Look for clusters.
10.2 Case: profits from exceptional gains (Adani Enterprises FY26)
Reading through a headline profit
- Reported PBT ₹13,525 cr, of which other income ₹11,688 cr (86.4% of PBT on screener's classification, which includes exceptional items).
- The company's own release: an exceptional gain of ₹9,215 cr on selling its AWL stake and cement units to Ambuja Cements; PBT excluding it was ₹4,309 cr. Check: \(13525 - 9215 = 4310\). It ties.
- Screener's "profit excluding exceptional items" (after tax and minority interest) was −₹2,364 cr for FY26.
- The Q4 FY26 quarter itself showed a net loss of ₹221 cr (per news reports of the results).
- Interpretation: the gains are real cash (from asset sales, recorded in CFI), not an accounting trick. But they are not repeatable, and they say nothing about whether the ongoing businesses earn their cost of capital. For valuation, use the recurring profit, not the headline.
10.3 Case: frequent exceptional items (Tata Steel)
Screener's exceptional items for Tata Steel (pre-tax) are non-zero in every one of the last 12 years (FY15–FY26), in both directions: FY17 −₹4,323 cr, FY18 +₹10,230 cr (a gain), FY20 −₹4,776 cr, FY21 −₹668 cr, FY22 +₹163 cr, FY23 +₹365 cr, FY24 −₹6,611 cr, FY25 −₹386 cr, FY26 −₹792 cr. Most relate to its European operations (impairments, restructuring, pension changes). Something that happens every year is not "exceptional". Add up the items over the cycle (FY17–FY26 net, including FY19's +₹854 cr: −₹5,944 cr, or about −₹594 cr a year) and treat that average as an ongoing cost of owning the business.
Statement analysis lowers your odds of owning a disaster; it does not remove them. Frauds can be well hidden, and good companies can fall for years (Asian Paints). Diversify, size positions so that any single blow-up is survivable (chapter 11), and never use leverage (futures, margin) on a stock whose statements you haven't checked.
11. Try it yourself (Python)
These snippets need a copy of the course repository and Python with pandas and numpy (setup steps are in its framework/README.md). Run them from the repository's root folder, for example with .venv/bin/python, because the file paths are relative to that folder. They use the screener snapshots saved for this chapter.
1. Load a company's P&L and compute margins and growth.
import pandas as pd
D = "data/extra/screener/"

def tab(sym, kind):   # kind: pl, bs, cf, ratios, quarters
    df = pd.read_csv(f"{D}{sym}_{kind}.csv").set_index("item")
    return df.apply(lambda s: pd.to_numeric(s.astype(str).str.replace(",", "").str.replace("%", ""), errors="coerce"))

pl = tab("ASIANPAINT", "pl")
yrs = [c for c in pl.columns if c.startswith("Mar")]
out = pd.DataFrame({
    "Sales": pl.loc["Sales", yrs],
    "EBITDA margin %": 100 * pl.loc["Operating Profit", yrs] / pl.loc["Sales", yrs],
    "PAT margin %": 100 * pl.loc["Net Profit", yrs] / pl.loc["Sales", yrs],
    "Sales YoY %": 100 * pl.loc["Sales", yrs].pct_change(),
})
print(out.round(2).tail(6))
cagr = (pl.loc["Sales", "Mar 2026"] / pl.loc["Sales", "Mar 2016"]) ** (1/10) - 1
print(f"10y sales CAGR: {cagr:.2%}")      # 9.57%
2. Cash conversion and FCF.
cf = tab("ASIANPAINT", "cf")
y5 = [f"Mar {y}" for y in range(2022, 2027)]
cfo, pat = cf.loc["Cash from Operating Activity", y5], pl.loc["Net Profit", y5]
print(pd.DataFrame({"PAT": pat, "CFO": cfo, "CFO/PAT": (cfo/pat).round(2)}))
print("5y cumulative CFO/PAT:", round(cfo.sum()/pat.sum(), 2))   # 1.09
print("5y cumulative FCF:", cf.loc["Free Cash Flow", y5].sum())   # 15070
3. Balance-sheet checks: accounting equation, D/E, interest coverage.
for sym in ["ASIANPAINT", "PIDILITIND", "TATASTEEL"]:
    bs, p = tab(sym, "bs"), tab(sym, "pl")
    c = "Mar 2026"
    eq = bs.loc["Equity Capital", c] + bs.loc["Reserves", c]
    left = bs.loc[["Equity Capital", "Reserves", "Borrowings", "Other Liabilities"], c].sum()
    right = bs.loc[["Fixed Assets", "CWIP", "Investments", "Other Assets"], c].sum()
    cover = (p.loc["Profit before tax", c] + p.loc["Interest", c]) / p.loc["Interest", c]
    print(f"{sym:11s} L={left:,.0f} A={right:,.0f}  D/E={bs.loc['Borrowings', c]/eq:.2f}  cover={cover:.1f}x")
4. Fetch any company fresh from screener.in (be polite: one request every few seconds; for personal study only).
import io, requests, pandas as pd
sym = "PIDILITIND"
html = requests.get(f"https://www.screener.in/company/{sym}/consolidated/",
                    headers={"User-Agent": "Mozilla/5.0"}, timeout=30).text
tables = pd.read_html(io.StringIO(html))
quarters, pl, bs, cf = tables[0], tables[1], tables[6], tables[7]   # order on the page as of Oct 2026
print(pl.head(12))
(If requests is not installed, use curl -A "Mozilla/5.0" URL -o file.html and read the file. The table order on screener's page can change, so check the shapes.)
Run snippet 2 for TATASTEEL and PIDILITIND. Why is Tata Steel's CFO/PAT so much higher? (Hint: compare depreciation with PAT.) Then run snippet 3 for FY24 (c = "Mar 2024") and see Tata Steel's coverage fall below 1×.
12. Practical checklist: reading a company's statements
- Use consolidated statements (standalone for banks with insurance arms, or holding companies). Note the units.
- Auditor's report: unmodified opinion? Any qualification, emphasis of matter, auditor change or resignation?
- Revenue: 5- and 10-year CAGR; last 4 quarters YoY. Is growth from volume, price or acquisitions (MD&A)?
- Margins: EBITDA and PAT margins over 10 years. Stable, rising or falling? Structural or cyclical cause?
- Other income ÷ PBT: below about 20%? Exceptional items: rare, or every year? Look at profit before exceptional items.
- Effective tax rate near 25%? If not, why?
- EPS growth vs PAT growth: is the share count rising (dilution)? Are bonus issues and splits adjusted?
- Cumulative CFO/PAT over 5 years: about 1 or more? Explain any year far below.
- FCF (CFO − capex): positive over a cycle? If negative, is it a planned investment phase with funding in place?
- Pattern of CFO/CFI/CFF signs: self-funding, or dependent on new debt and equity?
- Debt: D/E, net debt, interest coverage (above 3× is comfortable, below 1.5× is dangerous), short-term share of debt.
- Working capital: debtor, inventory and payable days, and the cash conversion cycle trend. Receivables growing faster than sales?
- Balance sheet: goodwill/intangibles vs equity; CWIP size and age; loans and advances to related parties.
- Notes: related-party transactions, contingent liabilities ÷ net worth.
- Shareholding: promoter holding trend; pledged shares (and changes); large holders.
- Rating rationales and exchange announcements for delays, downgrades, resignations.
- Banks: NII growth, NIM, CASA, GNPA/NNPA, capital adequacy, credit vs deposit growth.
- Compare with at least one peer before concluding anything.
13. Key takeaways
- Fundamental analysis judges the business; over long periods price follows earnings and cash flow, but over years it can diverge (Asian Paints: EPS +37.8% from FY21 to FY26 while the price fell 5.83% a year).
- The P&L covers a period: revenue → EBITDA → PBT → PAT → EPS. Watch margins, growth, other income and exceptional items, not just the bottom line.
- The balance sheet is a snapshot: Assets = Liabilities + Equity. Profits retained flow into reserves; debt drives interest; fixed assets drive depreciation; CWIP becomes fixed assets.
- The cash flow statement is the reality check: CFO should track PAT over several years; FCF = CFO − capex shows what is truly free for dividends, debt repayment or growth.
- Working capital moves cash: an asset going up uses cash, a liability going up provides it.
- Cyclicals (Tata Steel) need full-cycle averages and a strong balance sheet; small revenue changes cause large profit swings.
- Banks need their own metrics: NII, NIM, CASA, GNPA/NNPA, capital adequacy.
- Red flags come in clusters. Gensol showed negative CFO, 4.6× debt/equity, surging advances and rating downgrades before a 98.9% fall.
- Always reconcile before judging: Adani Enterprises' CFO fell short of PAT because much of the profit was exceptional asset-sale gains (cash in CFI), not because profit was fake. But that profit isn't recurring either.
14. Quiz and exercises
Q1. Asian Paints FY26: revenue ₹35,584 cr, operating expenses ₹28,884 cr, PAT ₹4,395 cr. Compute EBITDA, EBITDA margin and PAT margin.
Q2. Pidilite's revenue was ₹5,361 cr in FY16 and ₹14,601 cr in FY26. What is the 10-year CAGR, and why did EPS grow faster?
Q3. A company buys a ₹20 crore machine with a 10-year life and no residual value. What are the annual depreciation, the net block after 4 years, and the cash outflow in year 1?
Q4. During a year, receivables rise by ₹300 cr, inventory falls by ₹100 cr and payables rise by ₹50 cr. What is the net working-capital effect on CFO?
Q5. Tata Steel's FY26 PAT was ₹10,886 cr but CFO was ₹35,064 cr. Is this a red flag? Why or why not?
Q6. Using Tata Steel's FY26 numbers (borrowings ₹92,382 cr, equity ₹1,02,167 cr, PBT ₹15,969 cr, interest ₹7,167 cr), compute D/E and interest coverage. What was the coverage in FY24 (PBT −₹1,147 cr, interest ₹7,508 cr)?
Q7. Why would you read HDFC Bank's standalone rather than consolidated statements to judge its banking business? Name three metrics you'd use instead of EBITDA and D/E.
Q8. HDFC Bank FY26 (standalone): interest earned ₹3,07,522 cr, interest expended ₹1,78,836 cr, total assets ₹39,10,199 cr (FY25) and ₹43,64,886 cr (FY26). Compute NII and an approximate NIM. Why does it differ from the reported 3.26%?
Q9. List four red flags that were visible in Gensol Engineering's FY24 numbers or soon after, before the April 2025 SEBI order.
Q10. Asian Paints' reserves were ₹19,304 cr (FY25) and ₹21,276 cr (FY26). Profit attributable to shareholders was ₹4,325 cr and dividends paid ₹2,425 cr. Reconcile the change. What explains the gap?
Q11. Adani Enterprises reported FY26 PAT of ₹9,951 cr but CFO of only ₹2,357 cr. Give the main reason, and say what you'd use as "earnings" for valuation.
Q12 (exercise). Pick any company from data/ohlc that is not covered here (e.g. TITAN or POLYCAB). Using the "Try it yourself" code, compute its 10-year revenue CAGR, latest EBITDA margin, 5-year cumulative CFO/PAT, D/E and interest coverage. Write three sentences on what kind of business the numbers describe.
15. Sources
Zerodha Varsity, Module 3: Fundamental Analysis (concepts explained here in our own words):
Ch 1 Introduction to Fundamental Analysis ·
Ch 2 Mindset of an Investor ·
Ch 3 How to Read the Annual Report of a Company ·
Ch 4 Understanding the P&L Statement (Part 1) ·
Ch 5 Understanding the P&L Statement (Part 2) ·
Ch 6 Understanding the Balance Sheet Statement (Part 1) ·
Ch 7 Understanding the Balance Sheet Statement (Part 2) ·
Ch 8 The Cash Flow Statement.
Financial data: screener.in consolidated pages and schedules for Asian Paints, Pidilite, Tata Steel, Adani Enterprises, Gensol Engineering; HDFC Bank (standalone). Fetched 2 Oct 2026; saved in data/extra/screener/. Prices: NSE via Yahoo Finance (data/ohlc/, data/extra/GENSOL_daily_yf.csv), to 30 Sep 2026.
Company and news disclosures: HDFC Bank Q1 FY27 earnings presentation (NIM, CASA, GNPA, CAR); HDFC Bank Q1 FY26 earnings presentation and Systematix Q1 FY26 note (HDB stake-sale gain, floating and contingent provisions); Adani Enterprises Q4/FY26 results release; Business Today on Adani Enterprises Q4 FY26; Adani Enterprises rights issue terms; Tata Steel Q2 FY24 loss; Asian Paints Q4 FY25 exceptional items; Pidilite–Huntsman acquisition; Pidilite bonus 2025; HDFC Bank bonus 2025; IndusInd Bank Q4 FY25 loss and accounting discrepancies.
Gensol case: SEBI confirmatory order, Gensol Engineering; Business Standard on the SEBI interim order (15 Apr 2025); CARE/ICRA downgrades (Mar 2025); ICRA rating rationale.
Rules (verified Oct 2026): SEBI LODR Reg. 33 results timelines (SEBI LODR master circular, 11 Jul 2023); SEBI SAST Reg. 31 encumbrance disclosure (summary); Companies Act 2013 s.96 (AGM) and s.136 (summary); corporate tax under s.115BAA (ClearTax); Income-tax Act 2025 in force from 1 Apr 2026 (Income Tax Department FAQs on transition).
Figures: course/scripts/ch06_figures.py. All examples are historical analysis for education, not recommendations to buy or sell any security.