
Ratios, Quality & Sector Analysis
1. What you'll learn and why it matters
In Chapter 6 you learned to read the three financial statements. The numbers in them are large and hard to compare. Is a profit of ₹4,395 crore good? It depends on how much was invested to earn it, how much debt it carries, how fast it is growing, and what the market charges you for a share of it. Ratios answer those questions by dividing one number by another, so that a paint company with ₹8,000 crore of sales and an IT company with ₹2.7 lakh crore of sales can be compared on the same scale.
By the end of this chapter you will be able to:
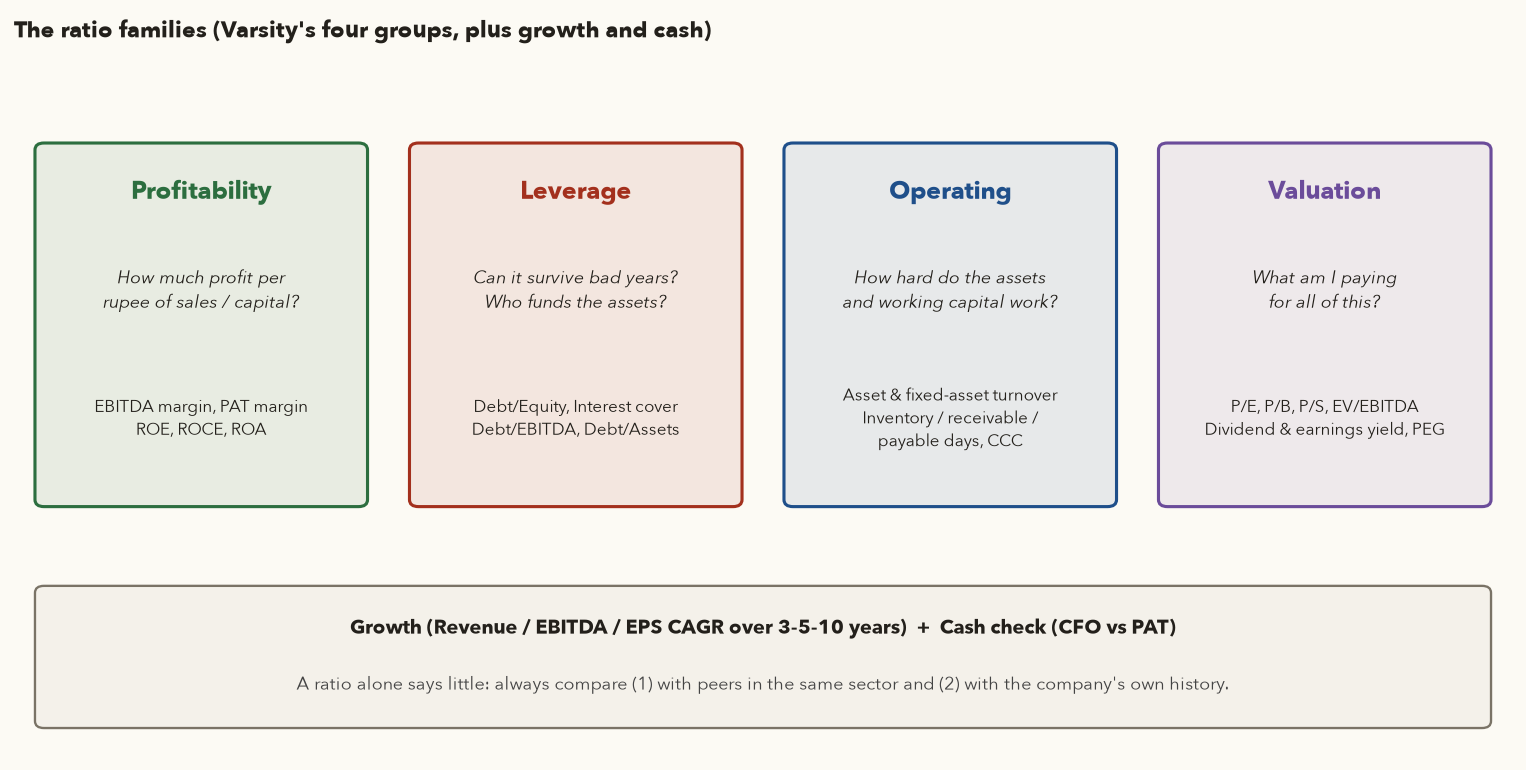
- Calculate and interpret the four ratio families Varsity teaches (profitability, leverage, operating, valuation), plus growth, using real FY2026 data for about 30 Indian companies.
- Break ROE into its three DuPont drivers and tell whether a high ROE comes from margins, efficiency or borrowed money.
- Use the ratios that apply only to banks: NIM, CASA, GNPA/NNPA, PCR, CAR.
- Compute a Piotroski F-score, judge business quality, moats, management and promoter behaviour.
- Run Varsity's three-stage equity-research process as a written checklist with thresholds.
- Know which metrics matter in each sector: banks, IT, FMCG, autos, cement, pharma, metals, retail and others.
Long-term investor: ratios are the main filter. They separate businesses that compound capital from businesses that consume it. Swing / positional trader: when you trade only fundamentally sound stocks, a failed setup is less likely to turn into a permanent loss, and quarterly results stop catching you by surprise. Futures trader: stock futures are leveraged. Knowing a company's debt, cash flow and valuation helps you judge how badly a results-day gap could hurt a position.
Every company example below is a historical analysis for learning. None of it is a buy or sell recommendation. Ratios describe the past, while prices react to what the market expects next. Later sections show real cases where "great ratios" were followed by years of falling share prices.
2. How to read any ratio (and where the numbers come from)
Varsity opens its ratio chapters with a warning that is easy to forget: a ratio on its own tells you very little. A 19% EBITDA margin is excellent for a supermarket and poor for a software exporter. A ratio means something only when you compare it in one of two ways:
- Across peers: companies in the same industry that sell similar things to similar customers, such as TCS against Infosys, or Asian Paints against Berger.
- Across time: the same company's ratio over 5–10 years, which shows whether it is improving, stable or deteriorating.
Conventions used in this chapter
- Data source: annual consolidated figures from screener.in, fetched on 2 Oct 2026 and cached in
data/extra/screener_ch07/. "FY26" means the year ended 31 March 2026. Amounts are in ₹ crore. - Averages: wherever a ratio mixes a P&L item (earned over a year) with a balance-sheet item (a snapshot on one date), we use the average of the opening and closing balance, as Varsity does. Example: ROE = FY26 profit ÷ average of equity at Mar-25 and Mar-26.
- Prices: valuation ratios use the closing price on 30 Sep 2026 and trailing-twelve-month (TTM) profits, which means the four quarters to Jun-2026. Share counts are taken from screener's market cap divided by its price.
- Screener quirks: "Borrowings" includes lease liabilities. Consolidated "Net Profit" includes the minority shareholders' share. "Operating Profit" is EBITDA excluding other income. Different websites define the same ratio slightly differently, so always compare numbers from the same source.
Varsity also warns that accounting policies vary between companies and change over time. Depreciation methods, revenue recognition and one-off "exceptional items" can shift a ratio without any change in the business. Before you conclude that one company is better than another, check that both are measured the same way.
3. Profitability ratios: EBITDA margin, PAT margin, ROE, ROA, ROCE
Profitability ratios ask two questions. How much of each rupee of sales does the company keep (margins)? How much profit does it earn on the capital invested in it (returns)? High and stable profitability is the clearest numerical sign that a company has some advantage over its competitors.
3.1 EBITDA margin (operating margin)
What it is: profit from the core business before interest, tax, depreciation and amortisation, as a share of operating revenue. The logic: it strips out how the company is financed (interest), its tax situation, and its accounting for old investments (depreciation). What remains shows how efficiently management turns sales into operating profit. Other income, such as treasury gains or interest on cash, is excluded because it is not the core business.
- Total revenue
- Sales (revenue from operations) plus other income for the year, in ₹ crore. The top lines of the P&L.
- Other income
- Interest, dividends and treasury gains: money that does not come from the core business.
- Total expenses
- Every expense in the P&L for the year, including finance cost and D&A.
- Finance cost
- Interest on borrowings and lease liabilities.
- D&A
- Depreciation and amortisation: this year's share of the cost of plants, machines and intangibles.
- Operating revenue
- Total revenue minus other income, which is just sales.
- EBITDA
- Earnings before interest, tax, depreciation and amortisation. Screener calls it "Operating Profit" and gets it in one step as Sales − Expenses, because its "Expenses" line already leaves out interest and depreciation.
- Remove other income from total revenue. What is left is sales from the core business.
- Remove finance cost and D&A from total expenses. What is left is the cost of running the business.
- Subtract the second from the first: that is EBITDA. Divide by operating revenue and multiply by 100 for the margin in %. Higher means more of each rupee of sales is kept before financing and asset costs.
Example (Asian Paints FY26, inputs from the worked example after 3.5): total revenue \(= 35{,}584 + 728 = 36{,}312\). Total expenses \(= 28{,}884 + 195 + 1{,}229 = 30{,}308\) (screener's expenses plus interest plus depreciation). EBITDA \(= (36{,}312 - 728) - (30{,}308 - 195 - 1{,}229) = 35{,}584 - 28{,}884 = 6{,}700\). Margin \(= 6{,}700 / 35{,}584 = 18.8\%\).
3.2 PAT margin (net profit margin)
This is the bottom-line profit after every expense, including interest, depreciation and tax. Varsity divides by total revenue (sales plus other income). The DuPont formula in Section 4 uses sales alone. Both are common, so state which one you used.
- Profit after tax
- Net profit for the year, the bottom line of the P&L, in ₹ crore. Screener's consolidated "Net Profit" includes the minority shareholders' share (Section 2).
- Total revenue
- Sales plus other income for the same year.
How it works: the paise of net profit the company keeps from each ₹1 it takes in, after every cost. Multiply by 100 for %. For Asian Paints FY26 it is 4,395 ÷ 36,312 = 12.1%. Dividing by sales alone (4,395 ÷ 35,584) gives 12.35%, the "net margin" used in Section 4.
3.3 Return on Equity (ROE)
ROE shows how much profit the company earns for each rupee that shareholders have put in or left in the business as retained earnings. Varsity calls it one of the most important ratios. It notes that top Indian companies average roughly 14–16%, and the author prefers 18% or more. The logic: a company earning 25% on equity and reinvesting its profits can compound shareholder wealth quickly. A company earning 8% on equity, which is below what you would earn in a fixed deposit after accounting for risk, is quietly destroying value.
- Net profit
- Profit after tax for the year, in ₹ crore.
- Average equity
- (Equity at the start of the year + equity at the end) ÷ 2. For FY26 that means the balance sheets of Mar-25 and Mar-26.
- Share capital
- Number of shares × face value, from the balance sheet.
- Reserves
- Profits kept in the business over the years, plus share premium and other reserves (Chapter 6, section 6.2).
How it works: divide the year's profit by the shareholders' money that was in the business during that year, and multiply by 100. The result is the profit earned for each ₹100 of equity. The average is used because profit builds up over the whole year, while equity is a snapshot on one date. Higher is better: Varsity prefers 18% or more. Always check how much debt sits behind it (3.7). The worked example after 3.5 runs it for Asian Paints.
3.4 Return on Assets (ROA)
ROA asks how much the company earns on everything it owns, whether funded by shareholders or lenders. Varsity adds back after-tax interest, because lenders also fund the assets. This puts a debt-heavy and a debt-free company on the same footing.
- Net profit
- Profit after tax for the year, in ₹ crore.
- Interest
- Finance cost for the year, from the P&L.
- Tax rate
- The effective tax rate, tax ÷ PBT, as a decimal (27% = 0.27).
- After-tax interest
- \(\text{Interest} \times (1 - \text{tax rate})\). Interest lowers taxable profit, so its real cost to the company is less than the amount paid.
- Average total assets
- (Total assets at the start of the year + at the end) ÷ 2.
How it works: adding back after-tax interest gives the profit earned for all funders, lenders as well as owners. Dividing by the assets they funded shows how hard those assets work. Higher is better, but levels differ a lot by industry: for banks about 1% is acceptable (Section 9). Simpler versions skip the interest add-back: the bank examples and the Piotroski test (Section 10) use net profit ÷ assets. The framework's ratios() uses the full formula above, and net profit ÷ average assets for banks. The worked example after 3.5 runs the full version for Asian Paints.
3.5 Return on Capital Employed (ROCE)
ROCE measures pre-tax operating return on all long-term capital, debt plus equity. Because it ignores how the capital is split, it is the fairest way to compare a borrower with a non-borrower. A useful rule: if ROCE is below the company's cost of borrowing, every rupee of debt reduces shareholder returns.
- EBIT
- Earnings before interest and tax = PBT + interest, for the year, in ₹ crore. This version includes other income (see the tip in Section 5).
- PBT
- Profit before tax.
- Interest
- Finance cost for the year.
- Capital employed
- All the long-term money in the business: equity plus all borrowings. Use the average of the opening and closing figures, as the worked example does.
- Equity
- Share capital + reserves.
- Short- / long-term debt
- Borrowings due within a year and after a year. Screener's single "Borrowings" line covers both, and includes lease liabilities.
How it works: profit before paying lenders or the taxman, divided by the money that lenders and owners together have put in, times 100. Because the split between debt and equity does not matter, it compares borrowers with non-borrowers fairly. Higher is better. The framework's quality scorecard treats a 5-year average of 10% as poor and 25% as good. If ROCE is below the interest rate on the company's debt, borrowing is hurting shareholders. The worked example below runs it for Asian Paints.
All five profitability ratios, step by step
Inputs (₹ cr, consolidated): Sales 35,584; Expenses 28,884; Other income 728; Depreciation 1,229; Interest 195; PBT 6,003; Tax rate 27%; PAT 4,395. Equity Mar-26 = 96 + 21,276 = 21,372; Mar-25 = 96 + 19,304 = 19,400. Borrowings 3,929 (Mar-26) and 2,290 (Mar-25). Total assets 34,519 and 30,355.
- EBITDA = 35,584 − 28,884 = 6,700. EBITDA margin = 6,700 ÷ 35,584 = 18.8%.
- PAT margin (Varsity) = 4,395 ÷ (35,584 + 728) = 4,395 ÷ 36,312 = 12.1%.
- ROE: average equity = (21,372 + 19,400) ÷ 2 = 20,386, so ROE = 4,395 ÷ 20,386 = 21.6%.
- ROA: numerator = 4,395 + 195 × (1 − 0.27) = 4,537.4; average assets = (34,519 + 30,355) ÷ 2 = 32,437, so ROA = 14.0%.
- ROCE: EBIT = 6,003 + 195 = 6,198; average capital employed = ((21,372 + 3,929) + (19,400 + 2,290)) ÷ 2 = 23,495.5, so ROCE = 26.4%.
Reading it: each ratio needs a benchmark before it means anything, so compare with the table below. Asian Paints earns higher margins and returns than Berger and Kansai Nerolac but lower than Pidilite. Its FY26 ROE of 21.6% is also below its own 5-year average of about 25% (screener), as large new competitors entered decorative paints.
IT services, paints and FMCG side by side
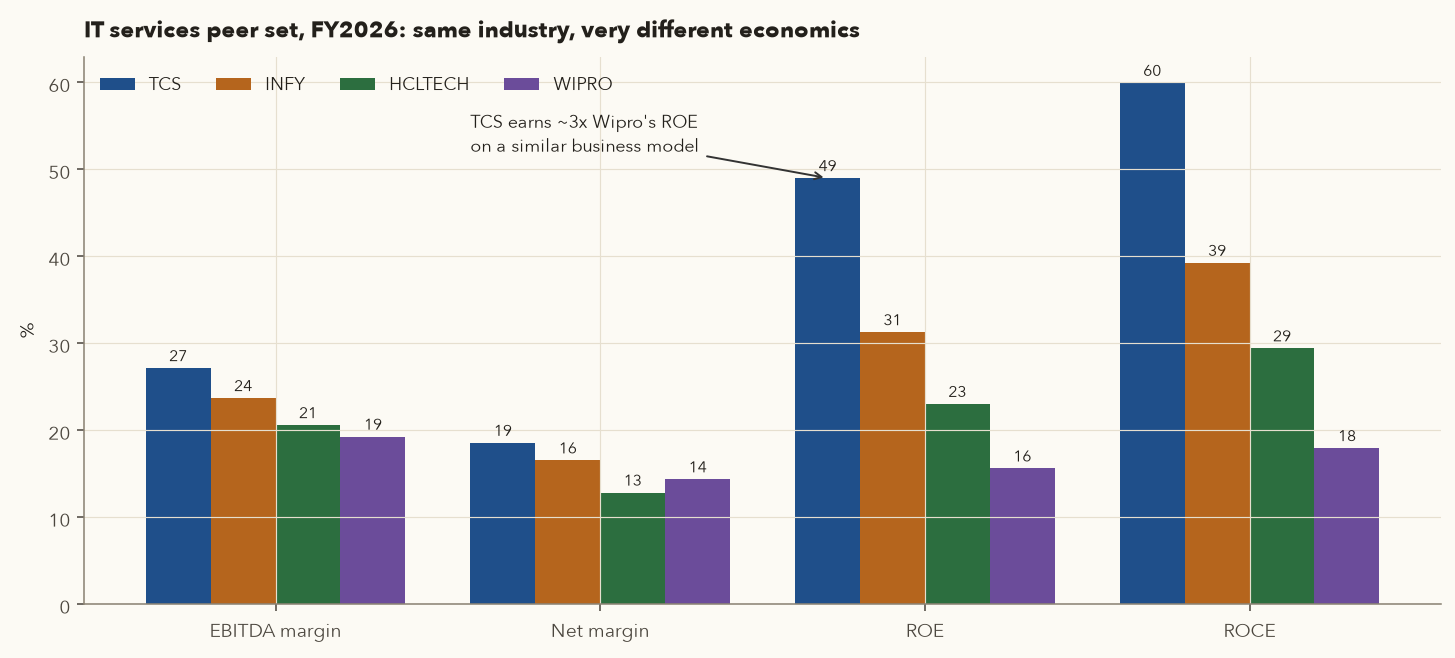
| Company | EBITDA margin | PAT margin | ROE | ROCE | ROA | Gross margin* |
|---|---|---|---|---|---|---|
| IT services | ||||||
| TCS | 27.1% | 18.5% | 49.0% | 59.9% | 29.7% | n.m. |
| INFY | 23.7% | 16.2% | 31.2% | 39.2% | 19.7% | n.m. |
| HCLTECH | 20.6% | 12.7% | 23.0% | 29.4% | 15.8% | n.m. |
| WIPRO | 19.2% | 13.7% | 15.6% | 17.9% | 10.7% | n.m. |
| Paints & adhesives | ||||||
| ASIANPAINT | 18.8% | 12.1% | 21.6% | 26.4% | 14.0% | 41.9% |
| BERGEPAINT | 15.4% | 9.4% | 17.3% | 21.5% | 12.2% | 34.0% |
| KANSAINER | 12.1% | 7.1% | 8.8% | 12.1% | 7.1% | 34.0% |
| PIDILITIND | 24.1% | 16.6% | 24.0% | 31.4% | 17.1% | 50.6% |
| FMCG | ||||||
| HINDUNILVR | 23.3% | 21.7% | 30.7% | 36.8% | 19.3% | 49.6% |
| NESTLEIND | 22.7% | 15.0% | 76.3% | 87.6% | 28.5% | 51.0% |
| ITC | 34.6% | 25.8% | 29.5% | 38.7% | 23.2% | 54.2% |
| BRITANNIA | 18.3% | 13.1% | 53.6% | 56.3% | 28.3% | 35.0% |
*Gross margin = 1 − (material + manufacturing cost) ÷ sales, from screener's expense breakdown. It is not meaningful (n.m.) for IT services, whose main cost is salaries.
What jumps out:
- Within IT, the business models are similar but TCS earns about 3× Wipro's ROE (49.0% against 15.6%). Part of the gap is margin (27.1% against 19.2% EBITDA). Most of the rest is that Wipro carries far more assets (acquisition goodwill, cash) for each rupee of sales (Section 4).
- Nestlé's ROE of 76% is high partly because it pays out almost all of its profit, so its equity base stays tiny. A high ROE built on a shrinking denominator is still genuine, but it tells you less about growth potential.
- ITC has the highest EBITDA margin in the table (34.6%) because cigarettes are a near-monopoly with strong pricing power.
3.6 Trends beat snapshots
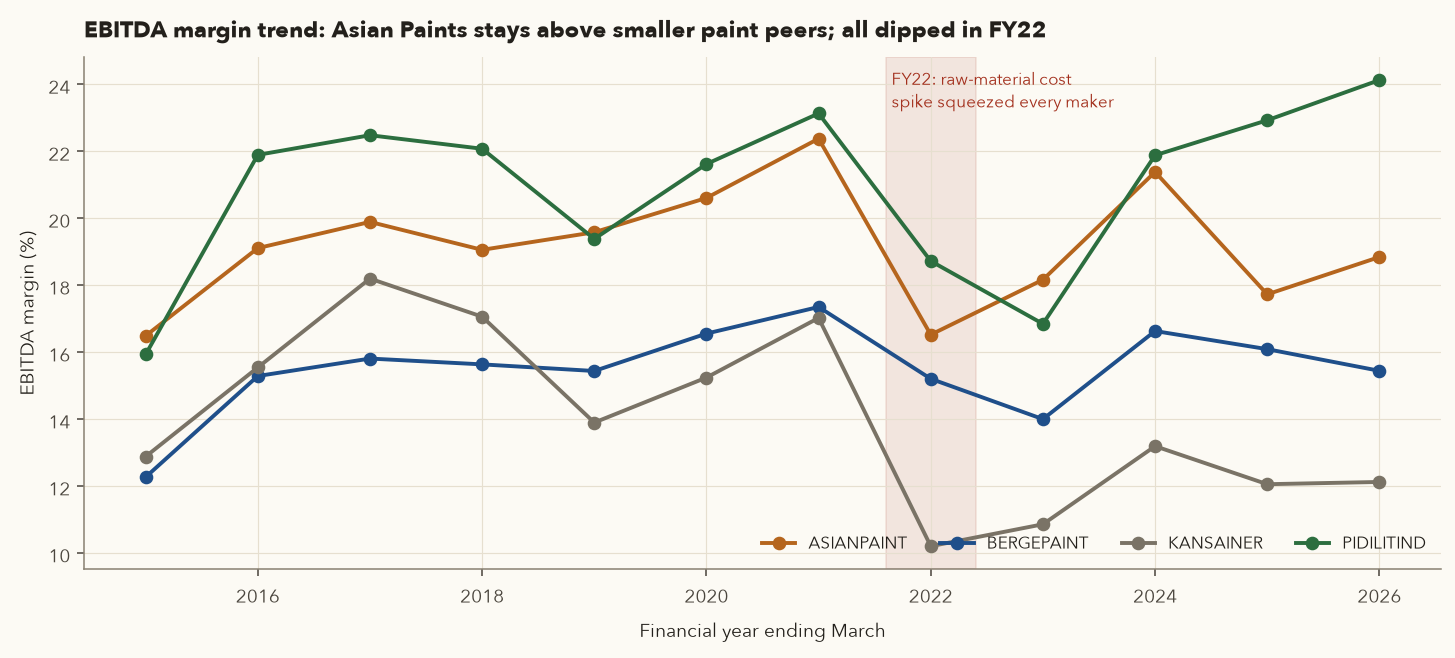
Varsity's Amara Raja example looks at four years of EBITDA margin, not one, because a rising margin shows that management is gaining control over costs. The paint industry over 12 years makes the same point.
Margins move with input costs, and leaders recover first
Asian Paints' EBITDA margin fell from 22.4% (FY21) to 16.5% (FY22). Kansai Nerolac's fell from 17.0% to 10.2%. Both faced the same raw material shock. By FY24 Asian Paints was back to 21.4%, while Kansai reached only 13.2%. Lesson: a one-year margin drop shared by the whole industry is a cyclical event. A margin that stays below peers year after year is a structural weakness.
3.7 How debt flatters ROE: a worked thought experiment
Varsity explains ROE's main weakness with a small pizza-shop example. Here is our own version, which also charges interest on the loan.
Same oven, same profit, three ways to fund it
Asha needs a ₹20,000 oven. Before interest, the bakery earns ₹4,000 a year in a normal year and ₹1,500 in a bad year. Any loan costs 10% a year. (Tax is ignored to keep the arithmetic simple.)
| Funding | Equity | Loan | Interest | ROE, normal year | ROE, bad year |
|---|---|---|---|---|---|
| All own money | 20,000 | 0 | 0 | 4,000/20,000 = 20% | 1,500/20,000 = 7.5% |
| Half borrowed | 10,000 | 10,000 | 1,000 | 3,000/10,000 = 30% | 500/10,000 = 5% |
| Three-quarters borrowed | 5,000 | 15,000 | 1,500 | 2,500/5,000 = 50% | 0/5,000 = 0% |
Debt pushed ROE from 20% to 50% in a good year and from 7.5% to 0% in a bad one. The business stayed exactly the same. Only the risk changed. This is why you never read ROE without checking leverage, and why DuPont analysis exists.
- Comparing margins across industries. A supermarket's 7.5% EBITDA margin (DMart) is excellent. The same margin would be a disaster for a software company.
- Including one-off "other income" or exceptional gains in profit. Hindustan Unilever's FY26 other income was ₹4,923 cr against ₹1,355 cr in FY25, which lifted PAT and ROE for one year (Section 8.6).
- Using closing equity when the company raised capital or paid a large dividend during the year. Average balances avoid that distortion.
- Treating a high ROE as good without checking whether it came from debt or a shrinking equity base.
4. DuPont: taking ROE apart
DuPont Corporation developed this method in the 1920s. It splits ROE into three multiplied parts. When you multiply them, the fractions cancel back to PAT ÷ Equity, so nothing changes mathematically. What you gain is a view of where the return comes from. Varsity calls it the best way to look at ROE because it shows the quality of the return as well as its size.
- PAT
- Profit after tax for the year, in ₹ crore.
- Sales
- Revenue from operations for the year.
- Avg total assets
- (Total assets at the start of the year + at the end) ÷ 2.
- Avg equity
- (Shareholders' equity at the start + at the end) ÷ 2.
- Net margin
- Profit per ₹1 of sales, shown as a %.
- Asset turnover
- ₹ of sales produced by each ₹1 of assets in a year, written as "×".
- Equity multiplier
- ₹ of assets supported by each ₹1 of equity, written as "×". 1.0× would mean no liabilities at all.
- Work out the three pieces separately. The labels under the curly braces name each one.
- Multiply them. Sales and average total assets each appear once on top and once underneath, so they cancel, leaving PAT ÷ average equity, which is ROE.
- Compare each piece with peers and with past years to see which one drives the ROE: margin (pricing power), turnover (efficiency) or the multiplier (borrowing, the riskiest route).
The framework's dupont(fin) uses the same average balances, so it reproduces the figures here.
- Net margin measures pricing power and cost control. A low margin suggests intense competition or high costs.
- Asset turnover measures how hard the assets work. A high number means a lot of revenue from a light asset base, typical of retailers and software firms.
- Equity multiplier (financial leverage) shows how many rupees of assets each rupee of equity supports. A higher number means more borrowed money or other liabilities. It is the ROE driver that carries the most risk.
DuPont with real numbers
- Net margin = PAT ÷ Sales = 4,395 ÷ 35,584 = 12.35%
- Asset turnover = 35,584 ÷ 32,437 (average assets) = 1.097×
- Equity multiplier = 32,437 ÷ 20,386 (average equity) = 1.591×
- ROE = 0.1235 × 1.097 × 1.591 = 21.6%, the same as the direct calculation in Section 3.
Asian Paints' ROE comes mainly from margin. Leverage is modest: about ₹1.59 of assets for each ₹1 of equity, and most of the non-equity part is supplier credit, not bank debt.
Same formula, different businesses
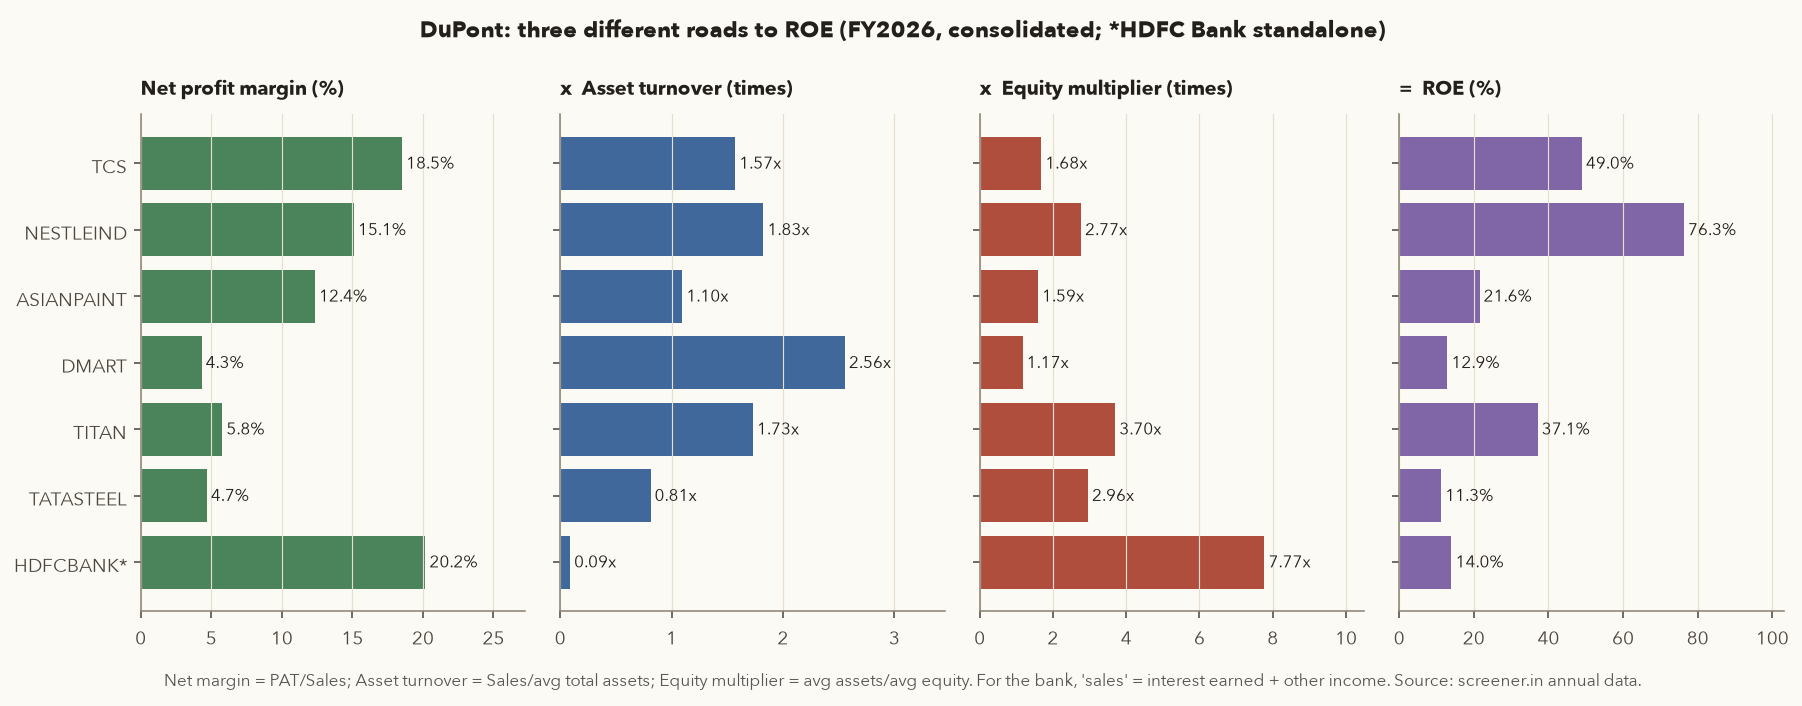
| Company | Net margin (PAT/Sales) | Asset turnover | Equity multiplier | ROE (product) |
|---|---|---|---|---|
| TCS | 18.5% | 1.57x | 1.68x | 49.0% |
| INFY | 16.5% | 1.18x | 1.60x | 31.2% |
| HCLTECH | 12.8% | 1.19x | 1.52x | 23.0% |
| WIPRO | 14.3% | 0.69x | 1.58x | 15.6% |
| NESTLEIND | 15.1% | 1.83x | 2.77x | 76.3% |
| ASIANPAINT | 12.4% | 1.10x | 1.59x | 21.6% |
| DMART | 4.3% | 2.56x | 1.17x | 12.9% |
| TITAN | 5.8% | 1.73x | 3.70x | 37.1% |
| TATASTEEL | 4.7% | 0.81x | 2.96x | 11.3% |
TCS against Wipro: net margin differs modestly (18.5% against 14.3%) and leverage is almost identical (1.68× against 1.58×). The big gap is asset turnover: 1.57× against 0.69×. Wipro carries large goodwill from acquisitions and a lot of cash, so each rupee of assets produces less revenue. DuPont points straight at the cause, which a single ROE number cannot do.
Titan: its 37% ROE looks outstanding, but 3.70× of it is leverage. That leverage comes mostly from gold borrowed for jewellery inventory, which is a normal practice in that business. You only notice it by doing DuPont and then reading the borrowings note in the annual report.
Track the three parts over five years. A rising ROE driven by rising margin or turnover is healthy. A rising ROE driven only by a rising equity multiplier should worry you, because the company is borrowing more to show the same improvement.
5. Leverage ratios: how much risk is in the balance sheet
Varsity calls debt a double-edged sword. Debt helps when the money earns more than the interest it costs. It hurts when profits fall and interest still has to be paid, as the bakery example showed. Leverage (solvency) ratios measure how much debt there is and how comfortably it can be serviced. Liquidity ratios (5.1) check the next twelve months.
- Borrowings / debt
- All borrowings at year-end, short-term (due within a year) plus long-term, in ₹ crore. "Total debt" and "Debt" mean the same thing. Screener's "Borrowings" line also includes lease liabilities.
- Shareholders' equity
- Share capital + reserves at year-end.
- Total assets
- The balance-sheet total at year-end.
- Avg assets / equity
- Averages of the opening and closing figures. Financial leverage is the same number as DuPont's equity multiplier.
- EBITDA
- Operating profit for the year (3.1).
- D&A
- Depreciation and amortisation for the year.
- EBIT
- Here EBITDA − D&A, which leaves out other income (see the tip below).
- Interest / Finance cost
- Interest charged in the P&L for the year.
- Cash
- Cash and equivalents at year-end.
How it works: D/E, Debt/Assets and financial leverage measure how much of the funding is borrowed. Interest coverage measures how many times the year's operating profit covers the interest bill. Debt/EBITDA is roughly how many years of operating profit it would take to repay all the debt; the "net" version subtracts cash first, and a negative value means more cash than debt. All except Debt/Assets (a %) are written as "×". The paragraph after the tip explains what levels are safe, and the Tata Steel example after 5.1 works every one through.
Here EBIT = EBITDA − D&A, which leaves out other income. That is the stricter test, because treasury income can vanish in a bad year. The ROCE formula in Section 3.5 and Chapter 6 use EBIT = PBT + interest, which includes other income. For Asian Paints FY26 the two give 5,471 ÷ 195 = 28.1× and 6,198 ÷ 195 = 31.8×; for Tata Steel, 3.1× and 3.2×. Neither is wrong. Use one version consistently when comparing companies.
Logic of each: D/E shows who funds the company, owners or lenders. A value above 1 means more lending than equity. Interest coverage shows how many times operating profit covers the interest bill, and below about 2–3× one bad year can threaten solvency. Debt/EBITDA is roughly how many years of operating profit it would take to repay all debt, and lenders often become uneasy above about 3×. Net debt subtracts cash, because a company with ₹100 debt and ₹90 cash is not really leveraged.
5.1 Short-term liquidity: current ratio and quick ratio
Leverage ratios ask whether the company can carry its debt over years. Liquidity ratios ask a nearer question: can it pay the bills due in the next 12 months? Current assets are items that turn into cash within a year (cash, receivables, inventory). Current liabilities are amounts due within a year (supplier bills, short-term loans, the current part of long-term debt).
- Current assets
- Items on the year-end balance sheet that turn into cash within 12 months: cash, receivables, inventory. In ₹ crore.
- Current liabilities
- Amounts due within 12 months: supplier bills, short-term loans, the part of long-term debt due this year.
- Inventory
- Raw materials, work-in-progress and finished goods: the slowest current asset to turn into cash.
How it works: divide what will turn into cash within a year by what must be paid within a year. A current ratio of 1.5 means ₹1.50 of short-term assets for every ₹1 due. The quick ratio takes inventory out first, so it is always lower and is the stricter test. Both are written as plain numbers.
Logic: a current ratio above about 1.2–1.5 means short-term assets comfortably cover short-term dues. The quick ratio leaves out inventory, because stock may take months to sell, and it is the stricter test. Read both against the business model. A company with a negative cash conversion cycle (Section 6), whose customers pay it before it pays suppliers, can safely run a current ratio near 1. A falling current ratio at a company with a long cash cycle is the warning sign. Example: using the proxy built in Section 10, Asian Paints' current ratio slipped from 1.76 (Mar-25) to 1.66 (Mar-26). That is still comfortable, but it cost a Piotroski point. Tata Steel's proxy is about 0.67, which is typical for a steelmaker that funds itself partly through supplier credit, but it leaves little room in a bad year. Screener's summary balance sheet does not split current and non-current items, so for exact figures use the balance sheet in the annual report.
Leverage ratios for a capital-heavy business
Inputs (₹ cr): Borrowings 92,382; Equity 1,247 + 1,00,920 = 1,02,167; Total assets 2,96,515; EBITDA 34,352; Depreciation 11,955; Interest 7,167; Cash 10,058.
- D/E = 92,382 ÷ 1,02,167 = 0.90. Lenders fund almost as much as shareholders.
- Debt/Assets = 92,382 ÷ 2,96,515 = 31% of assets financed by debt.
- EBIT = 34,352 − 11,955 = 22,397. Interest coverage = 22,397 ÷ 7,167 = 3.1×.
- Debt/EBITDA = 92,382 ÷ 34,352 = 2.69×. Net debt/EBITDA = (92,382 − 10,058) ÷ 34,352 = 2.40×.
Reading it: these numbers are manageable while steel prices hold. But Tata Steel's EBITDA swung from ₹63,490 cr (FY22) to ₹22,248 cr (FY24) in two years. At FY24's EBITDA, the same debt would be about 4× EBITDA. For cyclical businesses, test leverage against a bad-year EBITDA, not the current one.
| Company | Debt/Equity | Debt/Assets | Fin. leverage (avg A/avg E) | Interest cover | Debt/EBITDA | Net debt/EBITDA |
|---|---|---|---|---|---|---|
| TATASTEEL | 0.90 | 31.2% | 2.96x | 3.1x | 2.69x | 2.40x |
| JSWSTEEL | 0.99 | 36.8% | 2.84x | 2.2x | 3.37x | 1.98x |
| HINDALCO | 0.73 | 28.8% | 2.34x | 7.5x | 2.84x | 2.42x |
| ULTRACEMCO | 0.31 | 16.8% | 1.87x | 6.6x | 1.40x | 1.32x |
| SHREECEM | 0.08 | 5.9% | 1.34x | 8.7x | 0.40x | 0.33x |
| AMBUJACEM | 0.01 | 1.0% | 1.51x | 13.4x | 0.13x | -0.01x |
| TITAN | 1.95 | 50.6% | 3.70x | 6.4x | 3.66x | 3.43x |
| BAJAJ-AUTO | 0.58 | 29.5% | 1.77x | 10.7x | 1.73x | 1.50x |
| ASIANPAINT | 0.18 | 11.4% | 1.59x | 28.1x | 0.59x | 0.43x |
| TCS | 0.11 | 6.2% | 1.68x | 54.5x | 0.16x | -0.02x |
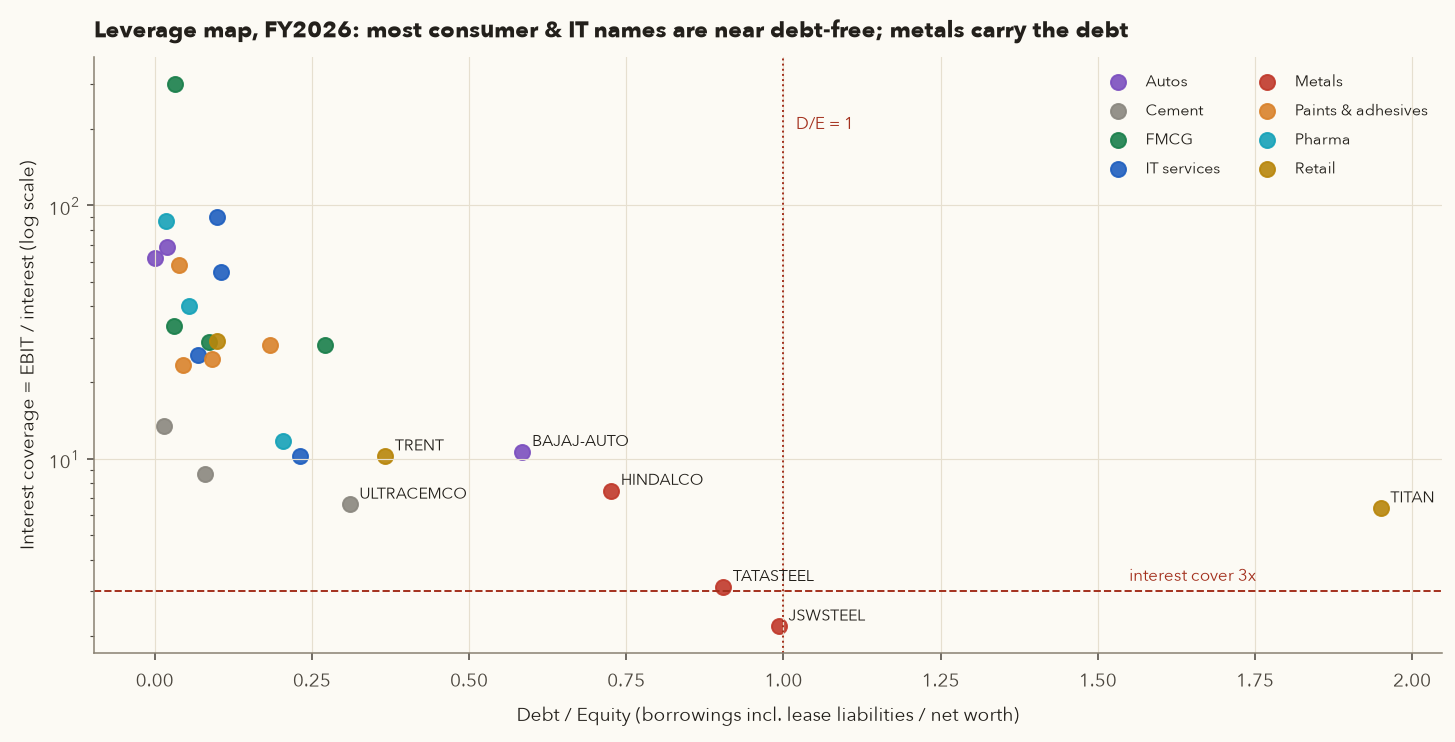
- Consolidated debt can belong to a lending subsidiary. Bajaj Auto's D/E of 0.58 and its low CFO/PAT (cash flow from operations ÷ profit after tax) of 0.25× in FY26 mostly reflect its captive finance arm, whose loans to customers are its business assets. Read the segment notes before you penalise it.
- Lease liabilities (shops, offices) appear in screener's borrowings. For retailers this inflates "debt" even when there is no bank loan.
- Debt is not always bad. A utility with steady cash flow can safely carry D/E of 1.5. A cyclical commodity producer with the same D/E is far riskier.
6. Operating (efficiency) ratios and the cash conversion cycle
Varsity also calls these "activity" or "management" ratios. They measure how efficiently the company uses its assets and its working capital. That is the cash tied up in stock and in money customers owe, minus the credit suppliers give.
- Sales
- Revenue from operations for the year, in ₹ crore.
- Avg (…)
- The average of the opening and closing values of whatever is in the brackets.
- Avg total assets
- Average of the balance-sheet totals at the start and end of the year.
- Net block
- Fixed assets after depreciation (Chapter 6, section 6.4).
- CWIP
- Capital work in progress: plant still being built.
- CA − CL
- Current assets minus current liabilities (5.1), also called net working capital.
How it works: each ratio says how many rupees of sales one rupee of that asset produced in the year, written as "×". Higher means the assets work harder, but compare only within an industry: a retailer turns its assets over far faster than a steel maker.
- COGS
- Cost of goods sold for the year, in ₹ crore. Here COGS = sales × (material cost % + manufacturing cost %) from screener's expense breakdown. Varsity builds COGS from material, purchases, stores and spares, and power and fuel, which is close to the same idea.
- Avg inventory
- (Inventory at the start of the year + at the end) ÷ 2.
- Inventory turnover
- How many times a year the stock is sold and replaced, written as "×".
- Avg receivables
- Average of opening and closing trade receivables: money customers owe.
- Avg payables
- Average of opening and closing trade payables: money owed to suppliers.
- Sales
- Revenue from operations for the year.
- 365
- Days in a year. It turns "a fraction of a year" into days.
- DSO
- Days sales outstanding, another name for receivable days.
- Inventory turnover = COGS ÷ average inventory. Then 365 ÷ turnover gives inventory days. (This is the same as average inventory ÷ COGS × 365.)
- Receivable days: average receivables as a fraction of a year's sales, times 365. It is roughly how long customers take to pay.
- Payable days: the same idea with payables, measured against COGS because suppliers are paid for goods at cost, not at selling price.
- CCC: add inventory days and receivable days, then subtract payable days. The answer is in days; the paragraph below explains how to read it.
The logic: money flows round a loop. The company pays suppliers, holds goods (inventory days), sells on credit (receivable days) and finally collects cash. Supplier credit (payable days) funds part of that loop for free. The CCC is the number of days the company's own cash is locked in the loop. A shorter CCC means less capital is needed for each rupee of growth. A negative CCC means suppliers effectively fund the business.
Working-capital ratios step by step
- COGS = 35,584 × (49.87% + 8.25%) = 20,681
- Average inventory = (5,744 + 6,719) ÷ 2 = 6,231.5. Inventory turnover = 20,681 ÷ 6,231.5 = 3.32×. Inventory days = 365 ÷ 3.32 ≈ 110
- Average receivables = (4,462 + 4,314) ÷ 2 = 4,388. Receivable turnover = 35,584 ÷ 4,388 = 8.11×. DSO = 45 days
- Average payables = (3,863 + 3,848) ÷ 2 = 3,855.5. Payable days = 3,855.5 ÷ 20,681 × 365 = 68
- CCC = 110 + 45 − 68 ≈ 87 days
- Fixed-asset turnover = 35,584 ÷ ((11,489 + 10,474) ÷ 2) = 3.24×
Screener shows 118 inventory days and an 84-day CCC for the same year because it uses a slightly different cost base. Neither figure is wrong. Use one source consistently.
| Company | Asset turnover | Fixed-asset turnover | Inventory days | Receivable days | Payable days | CCC (days) |
|---|---|---|---|---|---|---|
| Paints & adhesives | ||||||
| ASIANPAINT | 1.10x | 3.24x | 110 | 45 | 68 | 87 |
| BERGEPAINT | 1.24x | 2.99x | 111 | 48 | 81 | 77 |
| KANSAINER | 0.95x | 3.19x | 110 | 64 | 78 | 96 |
| PIDILITIND | 0.99x | 2.45x | 87 | 50 | 74 | 62 |
| FMCG | ||||||
| HINDUNILVR | 0.81x | 1.13x | 52 | 20 | 139 | -66 |
| NESTLEIND | 1.83x | 3.44x | 87 | 5 | 93 | ≈0 |
| ITC | 0.87x | 3.35x | 173 | 20 | 53 | 140 |
| BRITANNIA | 2.06x | 6.51x | 38 | 9 | 53 | -7 |
| Autos | ||||||
| MARUTI | 1.31x | 4.30x | 25 | 12 | 53 | -16 |
| BAJAJ-AUTO | 0.96x | 7.31x | 35 | 16 | 64 | -12 |
| EICHERMOT | 0.79x | 5.47x | 47 | 7 | 70 | -16 |
| Retail | ||||||
| DMART | 2.56x | 3.56x | 33 | 1 | 7 | 26 |
| TRENT | 1.90x | 4.08x | 66 | 1 | 32 | 34 |
| TITAN | 1.73x | 15.63x | 182 | 4 | 12 | 174 |
| Pharma | ||||||
| SUNPHARMA | 0.58x | 1.80x | 266 | 89 | 165 | 190 |
| DRREDDY | 0.64x | 1.52x | 179 | 104 | 69 | 214 |
| CIPLA | 0.71x | 2.16x | 192 | 72 | 95 | 169 |
| Metals & cement | ||||||
| TATASTEEL | 0.81x | 1.16x | 115 | 8 | 80 | 43 |
| JSWSTEEL | 0.73x | 1.30x | 88 | 19 | 87 | 20 |
| ULTRACEMCO | 0.64x | 0.85x | 82 | 25 | 83 | 23 |
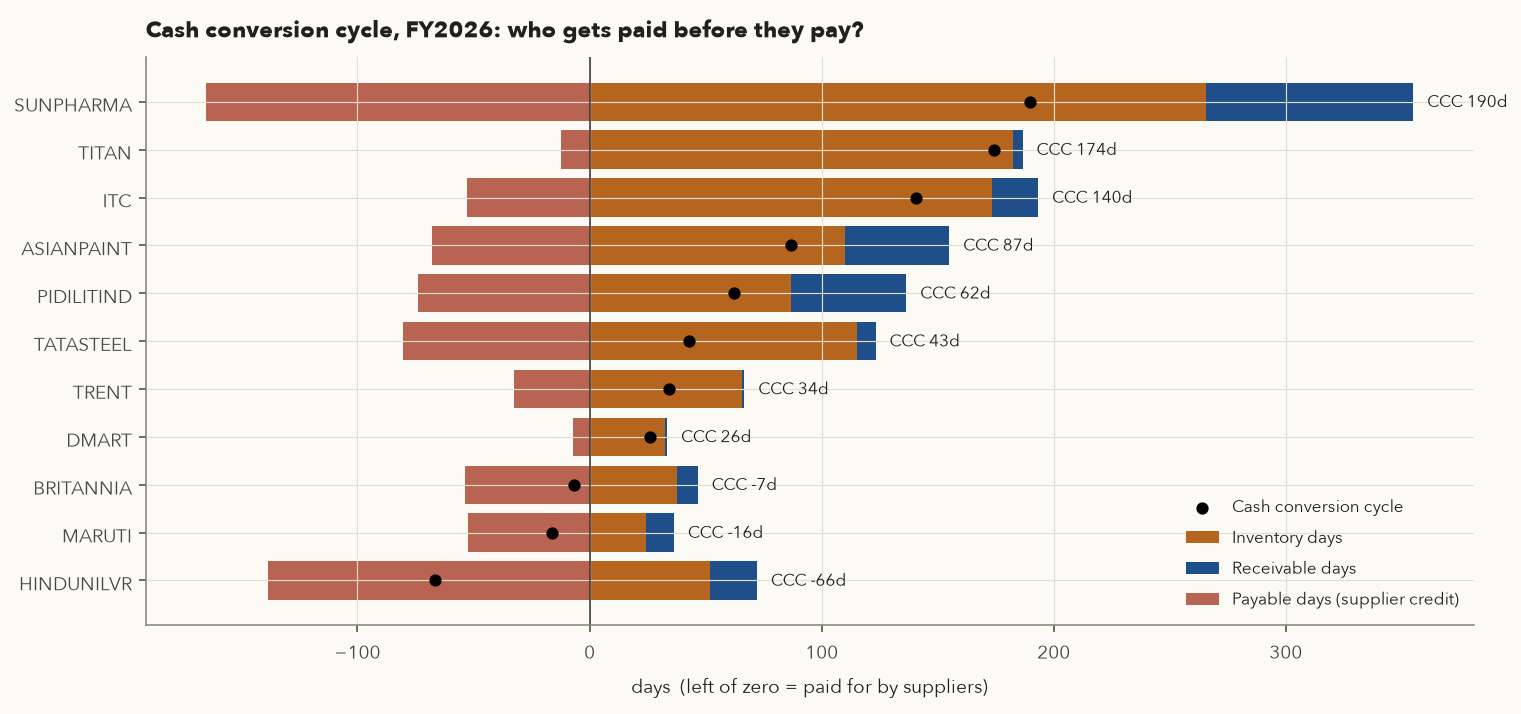
Negative versus very long cash cycles
HUL: inventory 52 days + receivables 20 days − payables 139 days = CCC −66 days. Retailers and distributors pay HUL almost immediately, while HUL takes over four months to pay its own suppliers. When sales grow, HUL's working capital releases cash instead of consuming it. This is one reason FMCG leaders can grow without borrowing.
Sun Pharma: inventory 266 + receivables 89 − payables 165 = CCC ≈ 190 days. Pharma holds months of active ingredients and finished stock for regulated export markets and offers long credit to distributors abroad. That is normal for the industry, so compare Sun with Dr Reddy's (214 days) and Cipla (169 days), not with HUL.
For service companies, receivable days are what matter
| Company | Receivable days (DSO) | Asset turnover | Fixed-asset turnover | CFO / PAT |
|---|---|---|---|---|
| TCS | 87 | 1.57x | 9.11x | 1.05x |
| INFY | 68 | 1.18x | 5.41x | 1.15x |
| HCLTECH | 80 | 1.19x | 3.53x | 1.20x |
| WIPRO | 50 | 0.69x | 1.90x | 1.13x |
IT firms hold almost no inventory, and their payables are tiny compared with material costs, so the CCC formula breaks down. Watch DSO instead. TCS took about 87 days to collect in FY26. On screener's basis, its debtor days rose from 81 (FY24) to 93 (FY26). Rising DSO in IT can mean clients are paying more slowly or work is being billed later. Investigate it, and do not ignore it.
A very high inventory turnover looks great. But it can also mean the company cannot produce enough, perhaps because it is short of funds, lacks access to raw materials, or cannot get bank loans. Whenever inventory ratios look unusually good, read the production and capacity section of the annual report to make sure demand is not simply going unmet.
If receivable days rise year after year while sales grow, the company may be pushing goods onto distributors on easy credit to show growth. Varsity's checklist lists this as a warning sign. Compare the growth in receivables with the growth in sales. Receivables growing much faster is a problem.
7. Growth ratios: CAGR over 3, 5 and 10 years
Varsity's checklist asks for revenue growth that keeps pace with profit growth, and EPS growth that matches net profit growth (Section 12). Many investors, this course included, also want double-digit growth, with 15% a year or more counted as strong. The standard measure is the Compound Annual Growth Rate: the constant yearly rate that takes you from the starting value to the ending value.
- Starting value
- The figure (revenue in ₹ crore, or EPS in ₹) in the first year of the window.
- Ending value
- The same figure in the last year, here FY26.
- \(n\)
- The number of years between them. FY16 → FY26 is 10 years.
- \(^{1/n}\)
- Raising to the power \(1/n\) takes the \(n\)th root: it turns a total multiple into a per-year multiple. The power 1/10 is the same as 0.1.
How it works: divide the ending value by the starting value to get the total growth multiple. Take the \(n\)th root to get the one-year multiple, then subtract 1 to get the yearly rate (0.094 = 9.4%). In a spreadsheet: =(End/Start)^(1/n)-1. It only works when both values are positive, so a loss year gives no CAGR (the "–" in the tables).
One company, three windows
- 10-year: (2,67,021 ÷ 1,08,646)1/10 − 1 = (2.458)0.1 − 1 = 9.4%
- 5-year: (2,67,021 ÷ 1,64,177)1/5 − 1 = (1.626)0.2 − 1 = 10.2%
- 3-year: (2,67,021 ÷ 2,25,458)1/3 − 1 = (1.184)0.333 − 1 = 5.8%
The 3-year number shows a clear slowdown. Global IT spending weakened after the FY22 boom. Long windows show what the business can do over a full cycle, while short windows show the current direction. Always look at both.
When a CAGR flatters
Maruti's EPS was ₹145.30 in FY21, which was hit by the COVID lockdown, and ₹466.90 in FY26. The 5-year EPS CAGR = (466.90 ÷ 145.30)0.2 − 1 = 26.3%, which looks spectacular. Over 10 years from FY16 (₹181.98) it is only 9.9%. The 5-year figure starts from an unusually depressed year. Check whether the starting year was abnormal before trusting any CAGR.
| Company | Revenue 3y | Revenue 5y | Revenue 10y | EPS 3y | EPS 5y | EPS 10y |
|---|---|---|---|---|---|---|
| TCS | 5.8% | 10.2% | 9.4% | 5.7% | 9.2% | 8.2% |
| INFY | 6.8% | 12.2% | 11.1% | 7.7% | 9.8% | 9.5% |
| HCLTECH | 8.7% | 11.5% | – | 3.9% | 8.4% | – |
| WIPRO | 0.8% | 8.4% | 6.1% | 6.8% | 5.0% | 6.4% |
| MARUTI | 15.7% | 21.1% | 12.3% | 19.5% | 26.3% | 9.9% |
| BAJAJ-AUTO | 19.9% | 17.8% | 10.8% | 21.5% | 18.0% | 10.6% |
| EICHERMOT | 17.5% | 21.8% | – | 23.6% | 32.5% | – |
| ASIANPAINT | 1.0% | 10.4% | 9.6% | 1.7% | 6.6% | 9.5% |
| PIDILITIND | 7.4% | 14.9% | 10.5% | 24.3% | 16.7% | 11.9% |
| DMART | 17.1% | 23.3% | 23.1% | 7.5% | 21.8% | 23.1% |
| TRENT | 34.5% | 50.6% | 28.1% | 57.0% | – | 40.1% |
| TITAN | 29.2% | 32.3% | 22.8% | 16.0% | 39.1% | 22.4% |
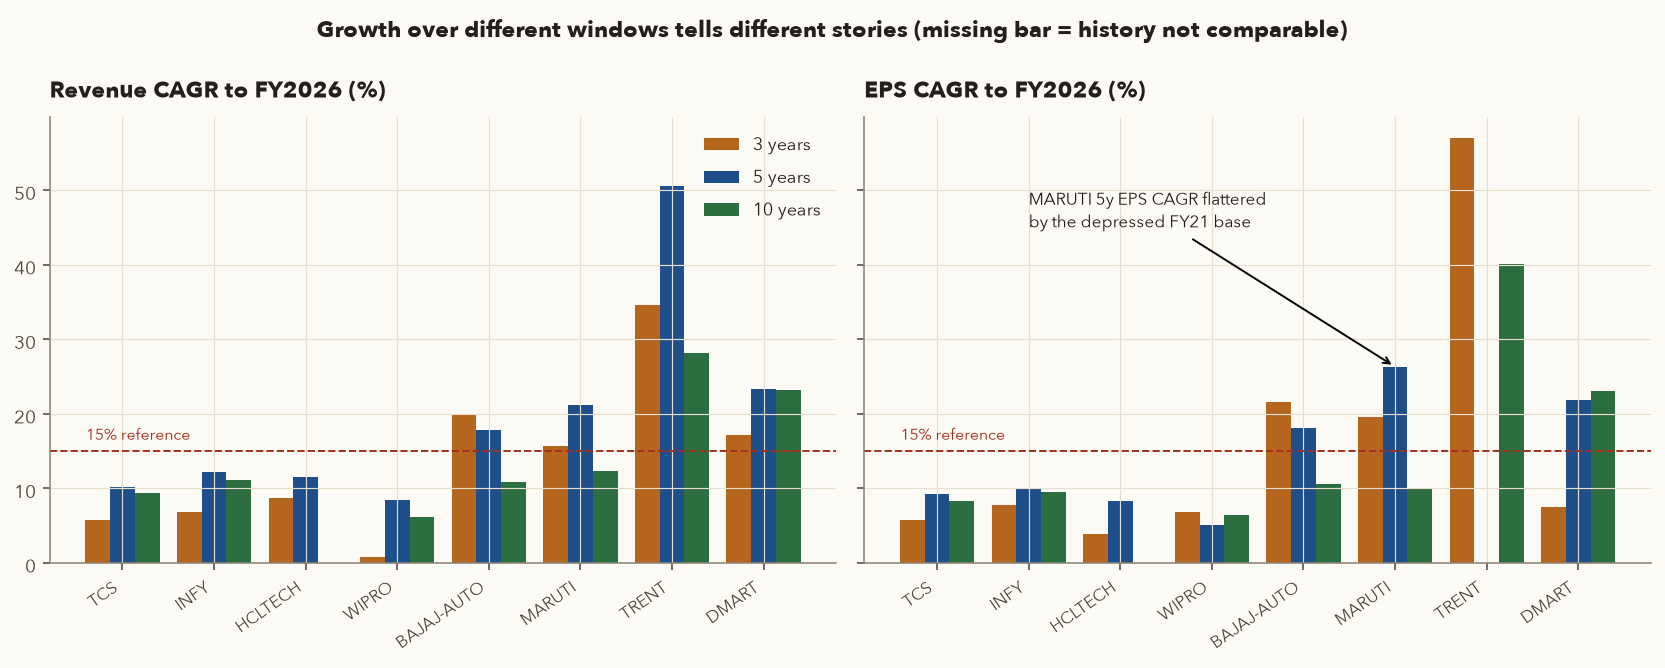
If profit grows 17% but EPS grows only 10%, new shares have been issued and existing owners' slices have shrunk. Pidilite's equity capital doubled from ₹51 cr to ₹102 cr between FY21 and FY26. That was a bonus issue, which is not dilution, so its EPS CAGR (16.7%) still matches its PAT CAGR (17.0%). Comparing growth rates, rather than share capital, handles bonuses and splits automatically.
8. Valuation ratios: what you pay for the business
Varsity puts it plainly: a mediocre business at a very cheap price can be a better investment than a great business at an extreme price. Valuation ratios compare the price with what you receive in return: earnings, book value, sales or cash. Full intrinsic-value methods (DCF, reverse DCF) are covered in Chapter 8. Here we cover the quick multiples.
- Price
- The share price in ₹. This chapter uses the close on 30 Sep 2026.
- EPS
- Earnings per share over the trailing twelve months (TTM: the last four reported quarters), in ₹.
- Market cap
- Price × number of shares, in ₹ crore: what the market values all the company's shares at.
- Net profit
- TTM net profit, in ₹ crore.
- Book value per share
- Shareholders' equity (share capital + reserves) ÷ number of shares, in ₹.
- Sales
- TTM sales, in ₹ crore.
- EV
- Enterprise value: roughly what it would cost to buy the whole business. You pay the market cap, take on its debt, and get its cash.
- Debt, Cash
- Borrowings and cash and equivalents from the latest balance sheet.
- EBITDA
- TTM operating profit (3.1).
- DPS
- Dividend per share paid over the last 12 months, in ₹.
- EPS growth % p.a.
- EPS growth per year, entered as a plain number (9.18, not 0.0918). This chapter uses the 5-year EPS CAGR to FY26.
- P/E, P/B, P/S and EV/EBITDA are multiples, written as "×": how many rupees you pay for ₹1 of profit, book value, sales or operating profit. The per-share and whole-company versions give the same answer, because multiplying top and bottom by the number of shares changes nothing.
- Lower means cheaper, but only when compared with peers, the company's own history and its quality (8.1).
- The two yields turn the price round: the profit or dividend you get for each ₹100 invested, as a %.
- PEG divides P/E by the growth rate. Near 1 is often called "fair" for a growing company.
- P/E is how many rupees the market pays for one rupee of annual profit. It is the most popular ratio, and the easiest to distort, because earnings can be managed.
- P/B is price relative to net worth (book value = share capital + reserves, excluding revaluation reserves). It is most useful for banks and asset-heavy firms. A high P/B is justified only by a high ROE.
- P/S works when earnings are temporarily depressed or negative. A rupee of sales is worth more when margins are higher, so check margin before calling a high P/S expensive.
- EV/EBITDA values the whole business, debt included, against operating profit. That makes it fairer than P/E when comparing a borrower with a cash-rich peer.
- Earnings yield is the inverse of P/E. You can compare it directly with a bond yield. A P/E of 50 is an earnings yield of 2%.
- PEG adjusts P/E for growth. A PEG near 1 is often called "fair" for a growing company. It is only as good as the growth number you plug in.
Every valuation ratio from one set of inputs
Inputs: close ₹2,050.60; shares ≈ 361.91 cr (screener market cap ₹7,50,973 cr ÷ ₹2,075); TTM net profit ₹50,055 cr; TTM EPS ₹137.64; equity ₹1,07,240 cr; borrowings ₹11,283 cr; cash ₹12,908 cr; TTM EBITDA ₹74,079 cr; trailing dividend per share ≈ ₹63.91 (screener yield 3.08% × ₹2,075).
- Market cap = 361.91 × 2,050.60 = ₹7,42,142 cr
- P/E = 7,42,142 ÷ 50,055 = 14.8× (price ÷ TTM EPS = 2,050.60 ÷ 137.64 = 14.9×; the small gap is from rounding and minority interest)
- P/B = 7,42,142 ÷ 1,07,240 = 6.9×. A high P/B like this is supported by a 49% ROE.
- EV = 7,42,142 + 11,283 − 12,908 = 7,40,517. EV/EBITDA = 7,40,517 ÷ 74,079 = 10.0×
- Dividend yield = 63.91 ÷ 2,050.60 = 3.12%. Earnings yield = 1 ÷ 14.83 = 6.7%
- PEG (5-year EPS CAGR 9.18%) = 14.83 ÷ 9.18 = 1.62
| Company | Price 30-Sep-26 (Rs) | P/E (TTM) | P/B | P/S | EV/EBITDA | Div. yield | Earnings yield | PEG (5y EPS) |
|---|---|---|---|---|---|---|---|---|
| IT services | ||||||||
| TCS | 2,050.6 | 14.8x | 6.9x | 2.7x | 10.0x | 3.12% | 6.7% | 1.62 |
| INFY | 994.1 | 13.3x | 4.3x | 2.2x | 8.9x | 4.83% | 7.5% | 1.35 |
| HCLTECH | 1,230.0 | 19.2x | 4.4x | 2.5x | 11.5x | 4.39% | 5.2% | 2.29 |
| WIPRO | 158.5 | 11.9x | 1.8x | 1.7x | 9.2x | 6.92% | 8.4% | 2.36 |
| Paints & adhesives | ||||||||
| ASIANPAINT | 2,402.6 | 47.4x | 10.7x | 6.2x | 32.1x | 1.14% | 2.1% | 7.17 |
| BERGEPAINT | 455.5 | 43.7x | 7.7x | 4.3x | 28.0x | 0.87% | 2.3% | 4.66 |
| KANSAINER | 178.0 | 24.5x | 2.1x | 1.7x | 14.5x | 1.41% | 4.1% | 11.30 |
| PIDILITIND | 1,465.1 | 55.5x | 13.7x | 9.7x | 39.5x | 0.79% | 1.8% | 3.33 |
| FMCG | ||||||||
| HINDUNILVR | 1,879.1 | 29.4x | 9.0x | 6.7x | 28.6x | 2.18% | 3.4% | 2.19 |
| NESTLEIND | 1,310.0 | 66.2x | 48.9x | 10.3x | 44.1x | 0.92% | 1.5% | – |
| ITC | 262.8 | 16.2x | 4.5x | 4.3x | 12.7x | 5.52% | 6.2% | 1.79 |
| BRITANNIA | 4,830.0 | 44.8x | 22.9x | 6.0x | 32.7x | 1.87% | 2.2% | 7.07 |
| Autos | ||||||||
| MARUTI | 11,967.0 | 26.3x | 3.5x | 1.9x | 17.8x | 1.17% | 3.8% | 1.00 |
| BAJAJ-AUTO | 10,874.0 | 25.9x | 7.7x | 4.2x | 22.5x | 1.38% | 3.9% | 1.44 |
| EICHERMOT | 7,150.0 | 34.0x | 7.8x | 7.9x | 31.9x | 1.14% | 2.9% | 1.05 |
PEG uses 5-year EPS CAGR to FY26. "–" means a comparable 5-year history is not available. The numbers are a snapshot on 30-Sep-2026 and change every trading day.
8.1 Valuation must be read with quality: the P/E vs ROE map
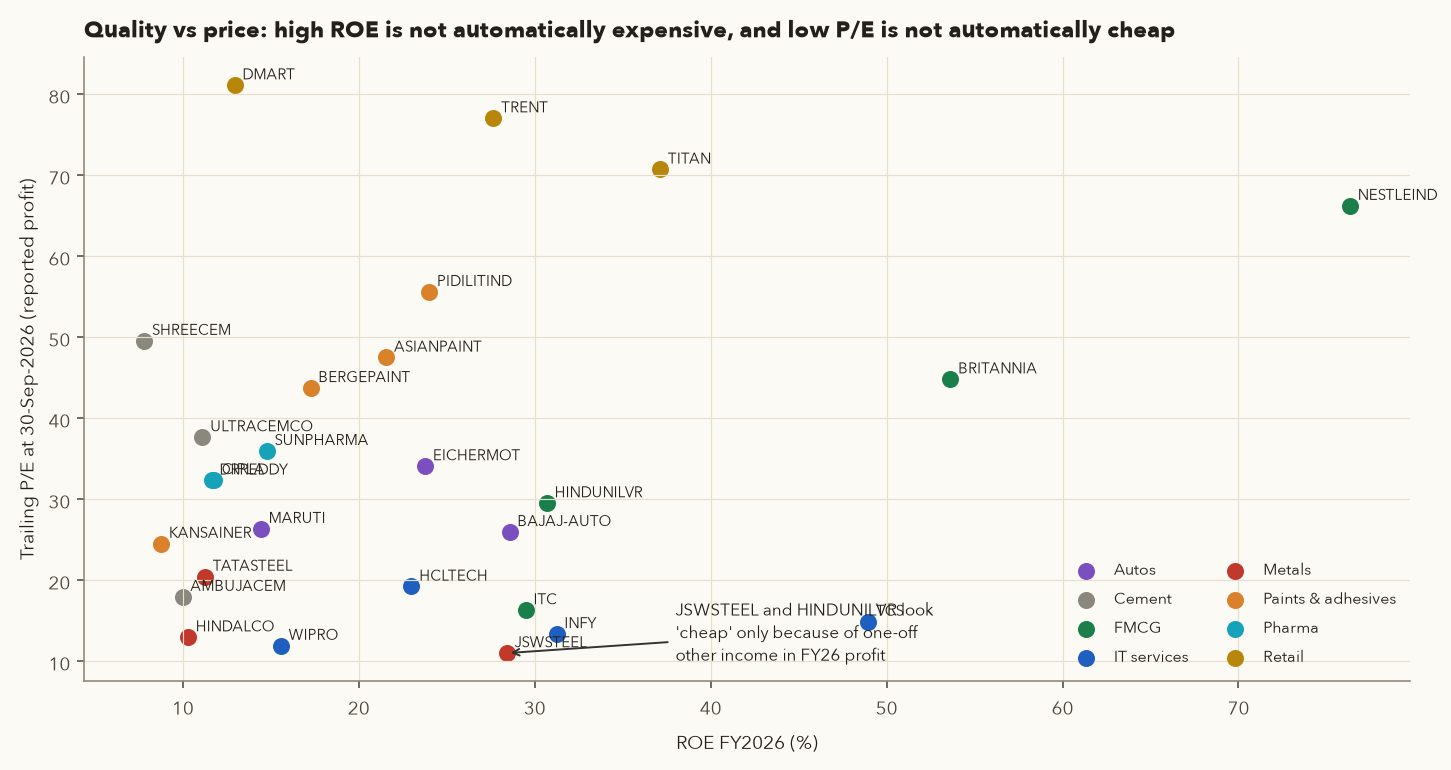
No single P/E is "cheap" or "expensive". The market pays more for earnings that are (a) growing fast, (b) predictable and (c) earned at high ROE with little reinvestment needed. In September 2026 the market was paying about 77× for Trent's 3-year EPS CAGR of 57%, and only about 15× for TCS's 5.7%. Whether either price is right is the job of Chapter 8.
8.2 Multiples change: de-rating and re-rating
A great business can still be a poor investment at the wrong price
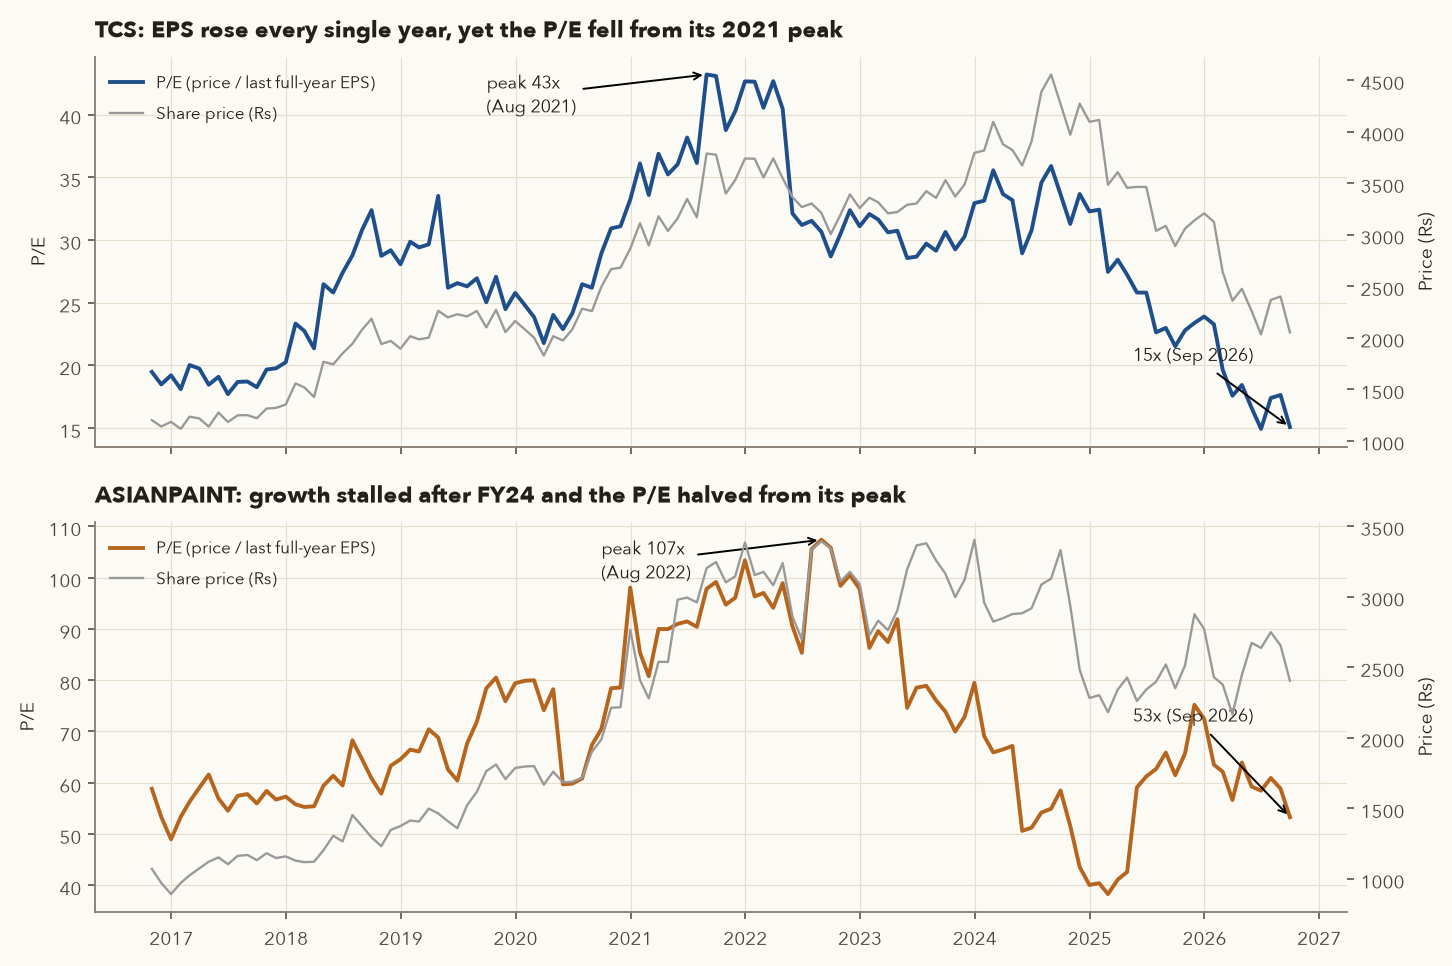
In August 2021 TCS traded at ₹3,786 and about 43× its FY21 EPS of ₹87.67. EPS then rose every single year to ₹136.01 in FY26, a 55% increase. Yet on 30 Sep 2026 the share was at ₹2,050.60, about 15× FY26 EPS. The business improved. The multiple the market was willing to pay collapsed. Paying 43× built in expectations that did not come true. The same thing happened to Asian Paints, whose P/E peaked near 107× in Aug-2022 (on depressed FY22 EPS) and was about 53× by Sep-2026.
8.3 Strip out one-offs before trusting a low P/E
Two "cheap" P/Es that are not what they seem
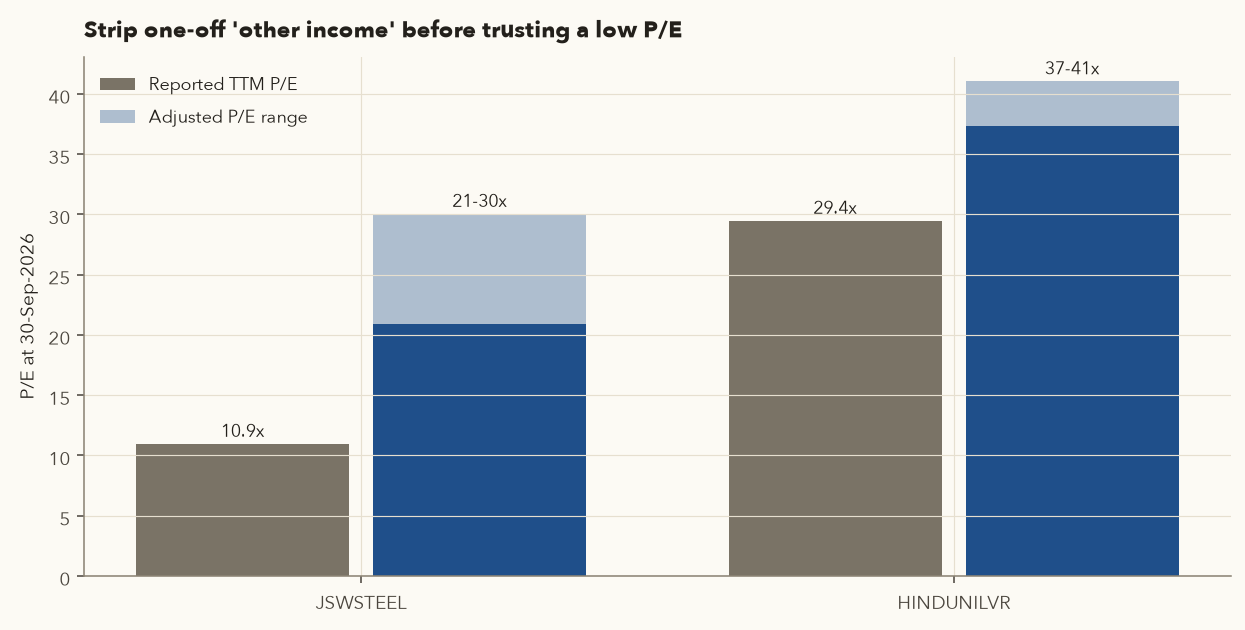
JSW Steel: TTM other income was ₹18,981 cr against an FY22–FY25 average of ₹1,184 cr. That is an excess of about ₹17,798 cr, which must come from a one-time gain. Reported TTM P/E = 3,06,122 ÷ 27,995 = 10.9×. Removing the excess:
- If the gain was untaxed: adjusted profit = 27,995 − 17,798 = 10,198, so P/E = 30.0×
- If it was taxed at 25%: adjusted profit = 27,995 − 17,798 × 0.75 = 14,647, so P/E = 20.9×
HUL: excess other income ≈ ₹4,223 cr. Reported P/E 29.4× becomes 37–41× after adjustment. Screener's own P/E figures (25.0× and 39.1× on 2 Oct 2026) also strip exceptional items, which is why they differ from a simple market cap ÷ net profit.
8.4 Index valuation
Varsity also shows how to value the whole market. NSE publishes the Nifty 50's P/E, P/B and dividend yield every day (on niftyindices.com, under historical data). Varsity's 2014 rule of thumb was to be cautious above about 22× and that the best entry points historically came near 16× or below. Earnings composition and interest rates have changed since then. Treat those numbers as history and compare today's index P/E with its own 10-year range. Chapter 8 covers this in detail.
- Calling a cyclical stock "cheap" at a low P/E at the top of its cycle. Metal stocks often show their lowest P/E when profits are at a peak.
- Comparing P/E across sectors, such as IT at 15× against retail at 77×, without adjusting for growth and capital needs.
- Using a PEG built on a flattering growth window (Maruti's 5-year PEG of 1.0 relies on the COVID-hit base year).
- Ignoring dividend yield. ITC's 5.5% yield and Wipro's 6.9% (30-Sep-2026) are a large part of the total return.
9. Banks need their own ratios
A bank's raw material is money. It borrows from depositors and lends to borrowers, so "sales", "inventory" and "debt" mean something different. A bank with D/E of 7 is normal, and the CCC concept does not apply. Varsity's banking chapters list the metrics to use instead. Banks report most of them every quarter in their investor presentations.
- Interest earned / expended
- Interest the bank receives on loans and investments, and pays on deposits and borrowings, during the year (₹ crore).
- NII
- Net interest income: the bank's core earnings.
- Avg interest-earning assets
- Loans, investments and other assets that earn interest, averaged over the period. Some banks quote NIM on total assets instead.
- NPA
- Non-performing asset: a loan whose interest or principal is more than 90 days overdue.
- Gross NPAs
- The total amount of NPAs before any provisions, in ₹ crore.
- Advances
- The bank's loans. "Gross" advances are before provisions; "net" advances are after subtracting provisions.
- Provisions
- Money the bank has already set aside (charged to its P&L) against expected losses on bad loans.
- Net NPA
- Gross NPA − provisions: the part of bad loans not yet covered.
- PCR
- Provision coverage ratio: the share of bad loans already provided for.
- CASA deposits
- Current + savings deposits: current accounts pay almost no interest and savings accounts pay a little, so this is the cheapest money a bank has.
- Tier 1 / Tier 2
- Tier 1 is core capital, mainly share capital and reserves (its purest part is CET1). Tier 2 is weaker capital, such as certain bonds and general provisions.
- Risk-weighted assets
- The bank's loans and other assets, each scaled by an RBI risk weight, so riskier loans count for more.
- Earnings: NII and NIM work as in Chapter 6, section 9.1. Higher NIM is better.
- Asset quality: the GNPA ratio is the share of loans that have gone bad; the NNPA ratio is what remains after provisions. Lower is better. PCR shows how much of the bad loans is already provided for; higher is more conservative. The "≈" is there because banks' reported PCR can differ from the simple formula (for example, by counting only specific provisions).
- Funding: a higher CASA ratio means cheaper deposits. The CD ratio shows how much of each ₹100 of deposits has been lent out.
- Safety: CAR (also called CRAR) is capital as a % of risk-weighted assets. It must stay above RBI's minimum (see the list below).
Example (ICICI Bank, Jun-2026, from the source note below the bank table): PCR \(\approx 1 - 5{,}908/23{,}847 = 0.75\), so about 75% of its bad loans were already provided for.
- NIM is the spread the bank earns, the bank's equivalent of a margin. Higher is better, and it usually reflects cheap deposits or higher-yield lending.
- CASA deposits are the cheapest funding: savings accounts pay a few percent and current accounts pay almost nothing. A high CASA ratio supports NIM.
- GNPA / NNPA / PCR measure asset quality. NPAs are loans in default, typically more than 90 days overdue. A high PCR means the bank has already set aside money for those losses. That is conservative and lowers current profit.
- CAR / CET1 are capital buffers that absorb losses. Under RBI's Basel III rules, Indian banks must hold a minimum total CRAR of 9%, with CET1 of at least 5.5% and Tier 1 of at least 7%, plus a 2.5% capital conservation buffer in CET1. The effective total is 11.5%, and systemically important banks need more.
- Liquidity: RBI requires a cash reserve ratio (CRR) and a statutory liquidity ratio (SLR). As of RBI's August 2026 policy, the repo rate was 5.25%, CRR 3% and SLR 18% (the next MPC meeting was scheduled for 5–7 Oct 2026, so re-check). Varsity's 2023 chapter quotes CRR 4.5% and repo 6.5%, which have since been cut.
- ROA is the key return measure for banks. About 1% is acceptable, and 1.5–2%+ is very good. Banks typically run 7–10× assets per rupee of equity, so a 1.5–2% ROA becomes roughly a 10–20% ROE.
From the annual P&L to bank ratios
- Interest earned 3,07,522 − interest expended 1,78,836 = NII ₹1,28,686 cr
- Average total assets = (43,64,886 + 39,10,199) ÷ 2 = 41,37,542.5. NII ÷ average assets = 3.11%. This is a proxy for NIM. The bank's reported NIM for Q1 FY27 was 3.26%, which its presentation states is on total assets (the same base as ours). On interest-earning assets only it was about 3.4%. Our full-year figure differs because the bank averages balances through the period, while we only average two year-end totals.
- ROA = PAT 74,671 ÷ 41,37,542.5 = 1.80% (the bank reported 1.85% for Q1 FY27, annualised)
- ROE = 74,671 ÷ ((5,62,901 + 5,01,424) ÷ 2) = 14.0%. Leverage ≈ 7.8× assets per rupee of equity.
- P/B on 30-Sep-2026 = market cap 10,91,479 ÷ net worth 5,62,901 = 1.94×
- CD ratio (Jun-26) = net advances 30,373 bn ÷ deposits 31,708 bn = 95.8%. This is high. It is a legacy of the 2023 merger with HDFC Ltd, whose loans came without deposits, and it also explains HDFC Bank's lower CASA ratio of 32%.
Annual returns and valuation
| Bank | NII FY26 (Rs cr) | NII / avg assets | ROA | ROE | Assets/Equity | Book value/share (Rs) | P/E (TTM) | P/B |
|---|---|---|---|---|---|---|---|---|
| HDFCBANK | 128,686 | 3.11% | 1.80% | 14.0% | 7.8x | 365 | 14.4x | 1.94x |
| ICICIBANK | 88,075 | 3.92% | 2.23% | 15.9% | 7.1x | 470 | 18.2x | 2.81x |
| KOTAKBANK | 30,010 | 4.06% | 1.90% | 11.1% | 5.8x | 136 | 27.9x | 3.06x |
| AXISBANK | 56,048 | 3.21% | 1.40% | 12.7% | 9.1x | 660 | 14.8x | 1.86x |
| SBIN | 173,120 | 2.42% | 1.12% | 16.2% | 14.5x | 590 | 10.8x | 1.62x |
Quarterly bank metrics (as reported for the quarter ended 30-Jun-2026)
| Bank | NIM | Gross NPA | Net NPA | PCR | CASA | CAR (CRAR) | CET1 | Advances/Deposits |
|---|---|---|---|---|---|---|---|---|
| HDFCBANK | 3.26% | 1.17% | 0.40% | ~66% (specific) | 32.0% | 19.60% | 17.40% | 95.8% |
| ICICIBANK | 4.36% | 1.38% | 0.35% | ~75% (computed) | 38.1% | 16.84% | 16.19% | 89.0% |
| KOTAKBANK | 4.53% | 1.18% | 0.27% | 78% | 40.3% | 22.80% | 22.40% | 89.4% |
| AXISBANK | 3.46% | 1.28% | 0.39% | 70% | 38.0% | 16.67% | 14.64% | 91.9% |
| SBIN | 2.86% | 1.47% | 0.38% | 74.2% | 39.2% | 15.67% | 12.89% | 84.0% |
Sources: HDFC Bank Q1 FY27 investor presentation; ICICI Bank performance review and Q1 FY27 results coverage; Kotak, Axis and SBI Q1 FY27 press releases. ICICI's PCR is computed as 1 − NNPA ÷ GNPA amounts (1 − 5,908 ÷ 23,847 ≈ 75%). For SBI the same calculation (1 − 19,158 ÷ 74,272 = 74.2%) matches the bank's reported 74.20%. HDFC's ~66% is its specific PCR read from the deck. SBI's CD ratio uses gross advances.
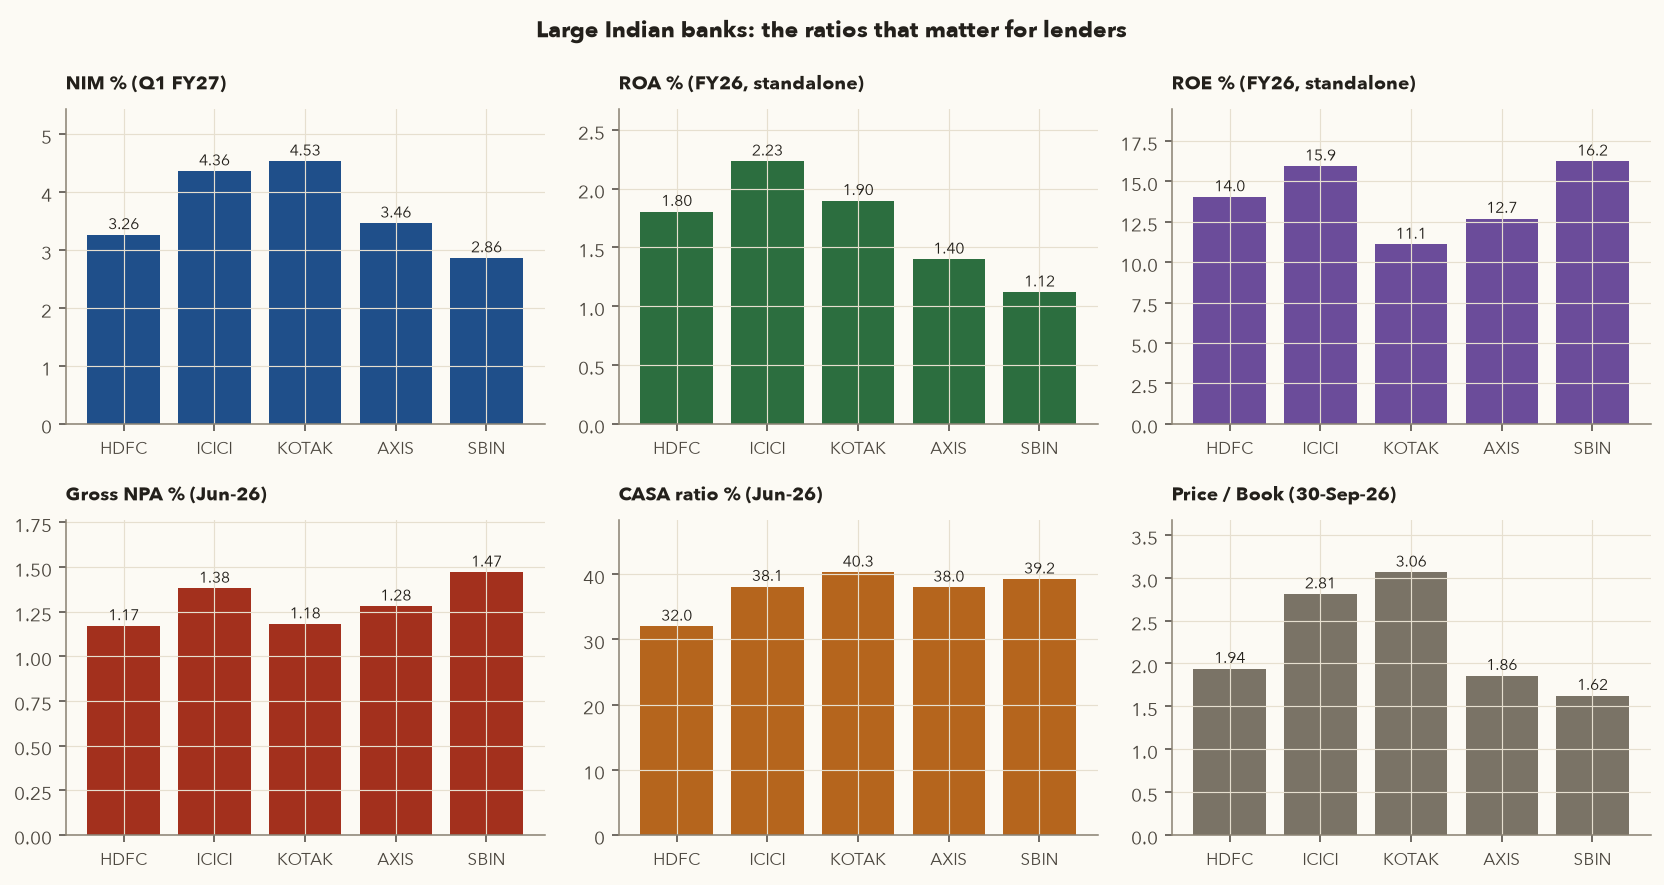
Kotak's standalone P/E of about 28× looks out of line with its 11% standalone ROE. The standalone figures exclude its valuable subsidiaries (securities, asset management, insurance), which the share price includes. For banks with large subsidiaries, use consolidated numbers or value the parts separately. This "sum of the parts" idea is covered in Chapter 8.
10. Piotroski F-score: a nine-point health check
Accounting professor Joseph Piotroski (2000) designed nine simple yes/no tests to find which cheap (low price-to-book) stocks were genuinely improving. Each test scores 1 or 0, giving a total from 0 to 9. In his study, high scorers (8–9) went on to beat low scorers (0–1). The score measures improvement in health, not absolute quality. That is why it suits value and turnaround situations.
| Group | Test (score 1 if true) | What it captures |
|---|---|---|
| Profitability | 1. ROA > 0 2. CFO > 0 3. ROA higher than last year 4. CFO > net income | Is it profitable, is the profit backed by cash, and is it improving? Test 4 penalises profits made of accruals rather than cash. |
| Leverage & liquidity | 5. Long-term debt/assets fell 6. Current ratio rose 7. No new equity issued | Is the balance sheet getting stronger without raising money from shareholders? |
| Efficiency | 8. Gross margin rose 9. Asset turnover rose | Is the business itself running better? |
Implementation notes: ROA = net income ÷ beginning total assets, as in Piotroski's paper. Screener does not split current assets and liabilities, so our current ratio is a proxy: (inventories + receivables + cash + loans and advances + other asset items) ÷ (trade payables + customer advances + other liability items + short-term borrowings). The share-issuance test uses equity share capital, which rises when new shares are issued at an unchanged face value. Bonus issues also raise share capital, so check the reason if it moves.
F-score for a high-quality company that had a soft patch
| Test | Working (FY25 → FY26, Rs cr) | Point |
|---|---|---|
| 1. ROA > 0 | NI/TA(beg) = 4,395/30,355 = 14.5% | 1 ✓ |
| 2. CFO > 0 | CFO = 7,088 | 1 ✓ |
| 3. ROA improved | 12.4% -> 14.5% | 1 ✓ |
| 4. Accruals: CFO > NI | 7,088 vs 4,395 | 1 ✓ |
| 5. Leverage (LT debt/TA) fell | 5.56% -> 8.35% | 0 ✗ |
| 6. Current ratio improved | 1.76 -> 1.66 | 0 ✗ |
| 7. No new shares issued | Equity capital Rs 96 cr -> Rs 96 cr | 1 ✓ |
| 8. Gross margin improved | 40.6% -> 41.9% | 1 ✓ |
| 9. Asset turnover improved | 1.134 -> 1.172 | 1 ✓ |
| F-score | 7 / 9 |
Asian Paints scores 7. Profitability improved after the weak FY25, but it lost points because long-term borrowings and leases rose (test 5) and the proxy current ratio slipped (test 6).
F-score for a cyclical recovery
| Test | Working (FY25 → FY26, Rs cr) | Point |
|---|---|---|
| 1. ROA > 0 | NI/TA(beg) = 10,886/275,459 = 4.0% | 1 ✓ |
| 2. CFO > 0 | CFO = 35,064 | 1 ✓ |
| 3. ROA improved | 1.2% -> 4.0% | 1 ✓ |
| 4. Accruals: CFO > NI | 35,064 vs 10,886 | 1 ✓ |
| 5. Leverage (LT debt/TA) fell | 27.01% -> 24.01% | 1 ✓ |
| 6. Current ratio improved | 0.70 -> 0.67 | 0 ✗ |
| 7. No new shares issued | Equity capital Rs 1,247 cr -> Rs 1,247 cr | 1 ✓ |
| 8. Gross margin improved | 32.8% -> 37.4% | 1 ✓ |
| 9. Asset turnover improved | 0.811 -> 0.843 | 1 ✓ |
| F-score | 8 / 9 |
Tata Steel scores 8 even though its ROE (11%) is half of Asian Paints'. That is exactly what Piotroski designed the score to do: catch a low-return, heavily indebted company whose direction has turned. ROA tripled, cash flow was three times profit, debt fell and margins expanded. Use the F-score as a turnaround detector inside value screens, not as a quality ranking. A cyclical company can score 8 at the top of its cycle, just before things turn down.
11. Qualitative analysis: business, moat, management, promoters
Numbers tell you what happened. Qualitative analysis tells you why and whether it is likely to continue. Varsity's equity research begins with understanding the business, before any ratio, because "the more you know the company, the higher is your conviction to stay put" when prices fall in a bear market.
11.1 Where stock ideas come from
Varsity lists six sources: general observation (what people around you are buying), stock screeners (for example ROE > 20% and PAT margin > 15%), macro trends (an infrastructure push helps cement), sectoral trends (a shift in what consumers prefer), special situations (a new board member, a demerger, a restructuring) and your circle of competence (a doctor understands healthcare better than most analysts do). Keep a watch-list. A company that fails your checklist today may pass in two years.
11.2 Business model: how does the company make money?
Before any ratio, write down in one paragraph: what it sells, to whom, why customers choose it, what the main costs are, and what could break the model. If you cannot fit that on one page, you do not yet understand the business. Varsity says the author does exactly this after about 15 hours of reading.
11.3 Moats: why competitors cannot easily copy the profits
Warren Buffett popularised the term "economic moat". It means a durable advantage that protects profits from competitors. Sustained ROCE well above the cost of capital is the numerical evidence of a moat. The moat itself is one of these:
| Moat type | How it works | Indian examples (illustrative) | Ratio fingerprint |
|---|---|---|---|
| Brand / intangible | Customers pay more or choose by default | Asian Paints, Nestlé (Maggi), Royal Enfield (Eicher), Titan (Tanishq) | High gross & EBITDA margin, stable through cycles |
| Distribution / network | Reach that takes decades to replicate; value rises with more users | HUL and ITC's retail reach; CDSL; exchange and depository networks | Negative CCC, high asset turnover, high ROCE |
| Switching costs | Changing supplier is costly or risky for the customer | IT services on multi-year contracts; core banking software; bank salary accounts | Stable revenue, high client retention, steady margins |
| Cost advantage / scale | Lowest-cost producer survives price wars | DMart's everyday low cost; UltraTech's scale in cement | Thin but stable margin with very high asset turnover; best margin in a commodity industry |
| Licence / regulation | Legal barriers keep competitors out | Cigarettes, liquor, stock exchanges, defence | Very high margins, few competitors |
Moats erode. Varsity's own PVR example notes that the thesis had to be re-checked once new players entered. Paints shows the same thing here: margins and ROE slipped after FY24 as large new entrants arrived. Re-test every moat once a year.
11.4 Management quality and corporate governance
- Track record: did management deliver what it promised in past annual reports and earnings calls? Compare old guidance with actual results.
- Background of promoters: no criminal cases, no heavy political dependence, no history of minority-shareholder abuse (a Varsity Stage-1 question).
- Related-party transactions: large purchases from, or loans to, promoter-owned entities are a red flag. They appear in the related-party note of the annual report.
- Too many subsidiaries: Varsity warns this can be a way to move money out of the listed company. Ask why each subsidiary exists.
- Auditor and bankers: a reputable auditor, no qualified opinions, no sudden auditor resignations.
- Remuneration: promoter pay that grows faster than profit is a warning sign.
- Accounting consistency: frequent changes in depreciation or revenue recognition policies, or profits that rise while cash flow does not (Varsity's earnings-manipulation warning).
11.5 Promoter holding and pledging
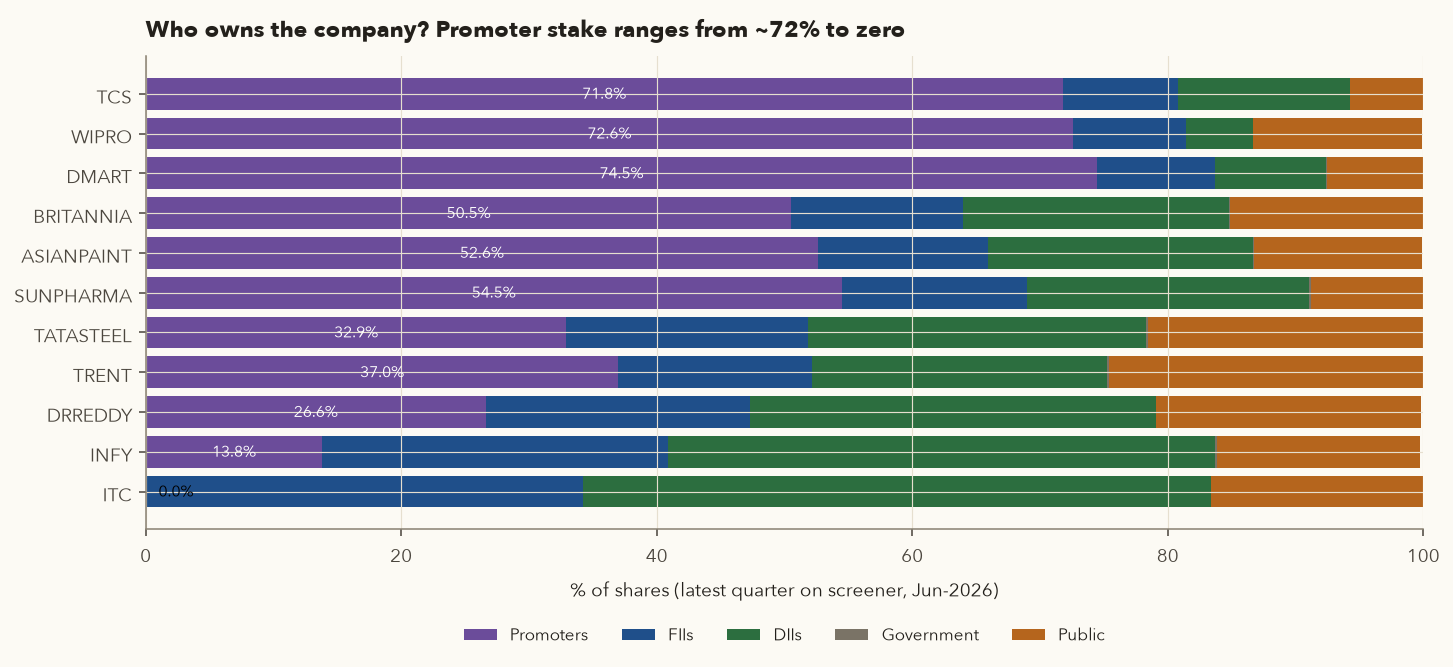
- Level: a meaningful promoter stake (for example 40–75%) aligns owners with minority shareholders. A low or zero stake (Infosys 13.8%, ITC 0%) is not bad in itself, since professional management and strong institutional owners can work very well. But it changes what you need to watch, such as board independence and capital allocation.
- Trend: steady selling by promoters is worth questioning. Over the year to Jun-2026 most companies in our sample were stable. JSW Steel's promoter stake moved from 45.3% to 44.3% and Tata Steel's from 33.2% to 32.9%.
- Pledging: promoters sometimes pledge shares as collateral for loans. If the share price falls, lenders can sell the pledged shares, which pushes the price down further. Under SEBI's Takeover Regulations (Regulation 31), promoters must disclose the creation, invocation or release of any encumbrance (pledge, lien, non-disposal undertaking) within 7 working days. NSE publishes a consolidated "Pledged data" page, and pledges also appear in the quarterly shareholding pattern. Rule of thumb: any pledge deserves an explanation, and a rising pledge combined with a falling price is a serious red flag.
11.6 Capital allocation: what management does with the cash
A company that earns 25% ROCE but reinvests in projects earning 8% destroys value. Look at the last 5–10 years of cash flow statements:
- Reinvestment: did capex (fixed assets purchased) raise revenue and EBIT? Check whether ROCE held up as capital employed grew.
- Dividends and buybacks: mature companies with few growth opportunities should return cash. HUL paid out 64% of FY26 profit and TCS 81%.
- Acquisitions: do they earn their cost? Wipro's low asset turnover (Section 4) partly reflects goodwill from past acquisitions.
- Diversification: Varsity prefers companies with one or two focused business lines. Conglomerates often trade at a discount.
12. Varsity's three-stage research process, turned into a checklist
Varsity organises equity research for retail investors with "limited resources" (annual report, internet, spreadsheet) into three stages. Do not skip any of them.
- Stage 1 · Understand the business. Read at least five years of annual reports and answer questions such as: What does the company do? Who are the promoters? Where are the plants, and are they running at full capacity? What raw materials does it use, and are they regulated or imported? Who are the customers and competitors? What is the revenue mix? How heavy is regulation? What are the entry barriers? Could cheap-labour countries replicate the product? How many subsidiaries are there? Who are the auditors and bankers? If you find a red flag here, stop. Do not go on to Stage 2, however good the numbers look.
- Stage 2 · Apply the financial checklist. Varsity's list includes gross margin > 20%, revenue growth in line with profit growth, EPS consistent with net profit, low debt, a sensible inventory trend, sales not driven by receivables, positive operating cash flow, ROE > 25% (checked together with debt; in the ratio chapters the author says he personally prefers 18% or more), one or two simple business lines, and not too many subsidiaries.
- Stage 3 · Valuation. Even a company that passes every check is a poor investment at the wrong price. Varsity uses DCF with a ±10% intrinsic-value band. See Chapter 8.
12.1 Our adapted Stage-2 checklist with thresholds
| # | Check | Threshold (starting point) | Why |
|---|---|---|---|
| 1 | Gross margin | > 20% (non-financial, non-services) | Pricing power; evidence of a moat |
| 2 | Revenue CAGR (5y and 10y) | > 10% (15%+ is strong) | Business is growing across cycles |
| 3 | PAT CAGR vs revenue CAGR | PAT growth within ~3 points of revenue growth or better | Margins are not being sacrificed for growth |
| 4 | EPS CAGR vs PAT CAGR | Within ~1 point | No dilution of existing shareholders |
| 5 | Debt/Equity | < 0.5 (higher only for utilities or financiers) | Survives a bad year |
| 6 | Interest coverage | > 5× | Interest is comfortably serviced |
| 7 | Inventory days trend | Stable or falling | Products are moving and not piling up |
| 8 | Receivables ÷ sales trend | Not rising | Sales are not pushed through on credit |
| 9 | Cumulative 5y CFO ÷ PAT | > 0.8 | Profits turn into cash |
| 10 | ROE (and 5y average) | > 15% (Varsity checklist: > 25%; ratio chapter: 18%+) with D/E check | Earns well above its cost of equity |
| 11 | Promoter holding | Stable; pledge zero or explained | Owners are not exiting or under stress |
| 12 | Business lines / subsidiaries | 1–2 focused segments; subsidiaries explained | Focus; lower risk of money leaking out |
Five companies through the checklist
| Check (FY2026 unless noted) | PIDILITIND | ASIANPAINT | KANSAINER | TCS | TATASTEEL |
|---|---|---|---|---|---|
| Gross margin > 20% | 51% ✓ | 42% ✓ | 34% ✓ | n.a. (services) | 37% ✓ |
| Revenue CAGR 5y > 10% | 14.9% ✓ | 10.4% ✓ | 9.7% ✗ | 10.2% ✓ | 8.2% ✗ |
| PAT CAGR 5y ≈ revenue CAGR (no margin collapse) | 17.0% ✓ | 6.5% ✗ | 1.8% ✗ | 8.7% ✓ | 5.9% ✓ |
| EPS CAGR ≈ PAT CAGR (no dilution) | 16.7% ✓ | 6.6% ✓ | 2.2% ✓ | 9.2% ✓ | 6.7% ✓ |
| Debt/Equity < 0.5 | 0.04 ✓ | 0.18 ✓ | 0.05 ✓ | 0.11 ✓ | 0.90 ✗ |
| Interest cover > 5x | 57.9x ✓ | 28.1x ✓ | 23.3x ✓ | 54.5x ✓ | 3.1x ✗ |
| Inventory days stable/falling (FY23→FY26) | 98→98 ✓ | 121→118 ✓ | 134→119 ✓ | n.a. | 175→184 ✗ |
| Receivables/Sales not rising (FY23→FY26) | 13%→15% ✗ | 13%→13% ✓ | 16%→18% ✗ | 22%→25% ✗ | 3%→2% ✓ |
| 5y cumulative CFO / PAT > 0.8 | 1.18x ✓ | 1.09x ✓ | 0.79x ✗ | 1.01x ✓ | 2.45x ✓ |
| ROE FY26 > 15% (5y avg in brackets) | 24% (22%) ✓ | 22% (25%) ✓ | 9% (10%) ✗ | 49% (49%) ✓ | 11% (14%) ✗ |
| Promoter stake stable (1y) | 69.3→69.2% ✓ | 52.6→52.6% ✓ | 75.0→75.0% ✓ | 71.8→71.8% ✓ | 33.2→32.9% ✓ |
| Passes | 10/11 | 10/11 | 6/11 | 8/9 | 6/11 |
| P/E at 30-Sep-26 (for Stage 3) | 55.5x | 47.4x | 24.5x | 14.8x | 20.4x |
How to read it: Pidilite and Asian Paints pass most financial checks. Their P/Es of 55× and 47× mean Stage 3 (valuation) will decide whether the price is acceptable. Kansai Nerolac is cheaper at 24× but fails on growth, ROE and cash conversion, which looks like a value trap unless something changes. Tata Steel fails on leverage and ROE, but its Piotroski score (Section 10) says the direction is improving. That suits a cyclical position with a defined exit, not a buy-and-forget holding. TCS passes almost everything and is the cheapest on P/E, but its 3-year growth has slowed sharply. This mix of good quality, low growth and low multiple needs a Stage-3 view on whether the growth will come back.
The course framework implements this chapter as code. framework.data.fetch_fundamentals(symbol) pulls the screener tables. framework.fundamentals.ratios(fin), dupont(fin) and piotroski_fscore(fin) compute what you did by hand here, and quality_scorecard(symbol) applies a checklist like the one above. From the command line, python -m framework.invest ASIANPAINT prints the scorecard. Use it as a first filter. It cannot do Stage 1 for you.
13. Sector analysis: what to measure in each industry
Varsity's Sector Analysis module starts from a simple point: no two sectors can be analysed the same way. Banks are judged on NPAs and capital, airlines on revenue per seat-kilometre, cement on capacity and cost per tonne. General ratios tell you how a company performs. Sector KPIs tell you why, and how it compares with its real competitors.
13.1 Tools for any sector
- Value chain: trace the product from raw material to the end customer and find where the money is made. A company that owns several stages is vertically integrated. Cement makers own limestone mines, plants and distribution. Owning the supply side is backward integration, such as Tata Steel's iron-ore mines. Owning distribution is forward integration, such as oil marketers' own pumps. Lean companies focus on one or two steps, as many FMCG firms do by outsourcing manufacturing.
- PESTLE: Political, Economic (rates, inflation, currency), Social and demographic, Technological, Legal and regulatory, and Environmental factors. Examples: the monsoon for fertilisers and FMCG, USD-INR for IT, carbon rules for cement and steel.
- How companies differ inside a sector: size (scale economies, survival through shocks like COVID), age (networks and relationships, but also legacy inertia), focus (single business against conglomerate, mass market against premium, cost leadership against pricing power) and substitutes (mobile phones replaced cameras, EVs threaten petrol engines).
Why you compare within sectors
| Sector (companies in sample) | EBITDA margin | ROE | ROCE | D/E | Asset turnover | CCC days | P/E |
|---|---|---|---|---|---|---|---|
| IT services (TCS, INFY, HCLTECH, WIPRO) | 22.1% | 27.1% | 34.3% | 0.10 | 1.18x | n.m. | 14.1x |
| Paints & adhesives (ASIANPAINT, BERGEPAINT, KANSAINER, PIDILITIND) | 17.1% | 19.4% | 23.9% | 0.07 | 1.05x | 82 | 45.6x |
| FMCG (HINDUNILVR, NESTLEIND, ITC, BRITANNIA) | 23.0% | 42.2% | 47.5% | 0.06 | 1.35x | -4 | 37.1x |
| Autos (MARUTI, BAJAJ-AUTO, EICHERMOT) | 20.8% | 23.8% | 28.5% | 0.02 | 0.96x | -16 | 26.3x |
| Cement (ULTRACEMCO, SHREECEM, AMBUJACEM) | 19.2% | 10.0% | 10.5% | 0.08 | 0.64x | 30 | 37.6x |
| Metals (TATASTEEL, JSWSTEEL, HINDALCO) | 14.8% | 11.3% | 12.2% | 0.90 | 0.81x | 43 | 12.9x |
| Pharma (SUNPHARMA, DRREDDY, CIPLA) | 20.9% | 11.8% | 15.8% | 0.06 | 0.64x | 190 | 32.3x |
| Retail (DMART, TRENT, TITAN) | 9.5% | 27.7% | 20.3% | 0.37 | 1.90x | 34 | 77.0x |
The medians differ hugely: cement's median ROE is 10% and FMCG's is 42%; retail's median asset turnover is 1.90× and cement's is 0.64×; metals' median D/E is 0.90 and the other sectors' are near zero. An "average" ROE threshold applied to every sector would reject all cement companies and accept every FMCG company, whatever their price. Set thresholds within sectors.
13.2 Sector KPI guide
| Sector | Key metrics (Varsity + standard practice) | Real numbers from our data | Typical red flags |
|---|---|---|---|
| Banks | NII, NIM, CASA, GNPA/NNPA, PCR, CAR/CET1, CD ratio, credit cost, cost-to-income, ROA; loan mix (retail against corporate), digital reach, liquidity (CRR/SLR, LCR = liquidity coverage ratio) | Q1 FY27 NIM 2.86% (SBI) to 4.53% (Kotak); GNPA 1.17–1.47%; HDFC core cost-to-income 39.2% | Rising slippages, falling PCR, CAR near the regulatory minimum, loan growth far above deposit growth |
| IT services | Revenue growth in constant currency (CC), order book / deal wins (TCV), unbilled and unearned revenue, new clients, client concentration, attrition, utilisation, EBIT margin, DSO, USD-INR | DSO 50 (Wipro) to 87 days (TCS); employee cost 53–60% of sales; 3y revenue CAGR 0.8–8.7% | Shrinking deal wins, rising DSO, top-client concentration, margin fall from wage inflation |
| FMCG* | Volume growth against price growth, gross margin (commodity costs such as palm oil and crude derivatives), advertising spend % of sales, distribution reach, rural/urban mix, working capital | HUL CCC −66 days; gross margin ~50% (HUL, Nestlé, ITC); FMCG median P/E 37× | Growth driven only by price hikes, falling volumes, cuts to ad spend to protect margin |
| Autos | Production and sales volumes (monthly), revenue growth against volume growth (realisation per vehicle), product mix (premium share), market share, capacity utilisation, inventory at dealers, EV readiness, commodity and component costs | Maruti material cost 72% of sales; autos median CCC −16 days; Bajaj 3y revenue CAGR 19.9% | Dealer stock building up, volume falls hidden by price hikes, rising discounts |
| Cement | Capacity (MTPA, million tonnes per annum), capacity utilisation, sales volume, realisation ₹/tonne, EBITDA/tonne, input + power & fuel + freight cost as % of revenue, regional presence and market share | See cost-mix table below: manufacturing (incl. power & fuel) 29–33% of sales; asset turnover 0.48–0.70× | Utilisation falling after big capacity additions; fuel cost spikes; price wars in a region |
| Metals / steel | Capacity, production, sales volume, EBITDA/tonne, captive iron ore and coal (backward integration), input/power/freight cost ratios, D/E and net debt/EBITDA, global steel prices | Tata Steel D/E 0.90; JSW Steel interest cover 2.2×; metals median P/E 12.9× (cyclical) | Debt-funded expansion at the cycle peak; EBITDA/tonne collapse; low P/E at peak earnings |
| Pharma* | R&D % of sales, US generics pipeline (ANDA filings and approvals), USFDA inspection outcomes (warning letters, import alerts), India branded growth, price controls (NPPA/DPCO), specialty mix, working capital | Pharma median CCC 190 days; Sun EBITDA margin 28.2%; employee cost ~18–20% of sales | Warning letters at key plants, price erosion in the US, receivables piling up |
| Retail | Store count and area, revenue per sq ft, EBITDA per sq ft, same-store (like-for-like) sales growth, footfall, conversion rate, average bill value, inventory turnover, private-label share, SKUs | DMart revenue/sq ft ≈ ₹35,400 (computed below); asset turnover 2.56×; CCC 26 days | Same-store growth turning negative, store expansion funded by debt, falling revenue per sq ft |
| Insurance | Life: solvency ratio (IRDAI minimum 150%), VNB (value of new business) and margin, persistency (13th/61st month), claims settlement, AUM. General: combined ratio = loss ratio + expense ratio (< 100% means an underwriting profit) | (not in our sample) | Falling persistency, combined ratio rising above 100%, solvency near the minimum |
| Hotels | Keys, occupancy, ADR (room revenue ÷ rooms sold), RevPAR (room revenue ÷ rooms available), food and other revenue share, EBITDA across ownership models | (not in our sample) | Occupancy rising only through discounting (falling ADR) |
| Real estate | Pre-sales (bookings) volume and value, average realisation ₹/sq ft, collections, land bank, net debt; commercial: rental annuity, occupancy, leasing volume; SOTP valuation | (not in our sample) | Collections far below pre-sales, rising debt, stalled projects |
*Varsity's Sector Analysis module covers cement, insurance, IT, automobiles, banking, steel, hotels, retail and real estate. The FMCG and pharma rows are standard industry practice added for this course, not taken from Varsity.
Varsity's cement and steel "cost ratio" check, using screener's expense breakdown
| Company | Material cost | Manufacturing (incl. power & fuel) | Employee cost | Other (incl. freight, ads, royalty) | EBITDA margin |
|---|---|---|---|---|---|
| ULTRACEMCO | 19.42% | 29.10% | 4.72% | 27.55% | 19.2% |
| SHREECEM | 10.31% | 33.29% | 6.22% | 28.04% | 22.1% |
| AMBUJACEM | 16.58% | 33.02% | 3.94% | 30.28% | 16.2% |
| TATASTEEL | 40.33% | 22.32% | 11.20% | 11.35% | 14.8% |
| JSWSTEEL | 52% | 24% | 3% | 6% | 15.9% |
| TCS | 0% | 2% | 58% | 13% | 27.1% |
| INFY | 0% | 19% | 53% | 5% | 23.7% |
| HINDUNILVR | 44.56% | 5.79% | 4.92% | 21.40% | 23.3% |
| MARUTI | 72% | 2% | 5% | 9% | 11.7% |
| SUNPHARMA | 19.75% | 5.78% | 19.53% | 26.72% | 28.2% |
| DMART | 85% | 4% | 2% | 2% | 7.5% |
For cement, Varsity separates input cost, power and fuel, and freight. Screener puts power and fuel inside "manufacturing" and freight inside "other". The pattern is still clear: cement is an energy and logistics business, with manufacturing plus other costs above 55% of sales, while Maruti and DMart are purchased-material businesses (72% and 85%). For finer splits, such as freight per tonne, use the company's quarterly investor presentation, as Varsity suggests.
Revenue per square foot
Avenue Supermarts reported (standalone, as summarised in its FY26 results coverage) revenue of ₹66,968 cr, 500 stores, and retail area that grew from 17.2 mn sq ft (Mar-25) to 20.6 mn sq ft (Mar-26).
- Average area = (17.2 + 20.6) ÷ 2 = 18.9 mn sq ft
- Revenue per sq ft = ₹66,968 cr ÷ 18.9 mn sq ft = ₹6,69,68,00,00,000 ÷ 1,89,00,000 ≈ ₹35,400 per sq ft per year
- The company's own figure is ₹33,422, against ₹33,896 the year before. It weights area by how long each store was open, and 58 of the 85 new stores opened only in Q4.
Lesson: a fast-expanding retailer's revenue per sq ft can dip simply because new stores are still ramping up. Same-store (like-for-like) growth, reported at 8.1% for mature stores, separates expansion from the health of existing stores.
14. An honest check: did quality pay off?
It is tempting to think that buying high-ROE companies guarantees good returns. Our data says otherwise, at least over 2021–2026.
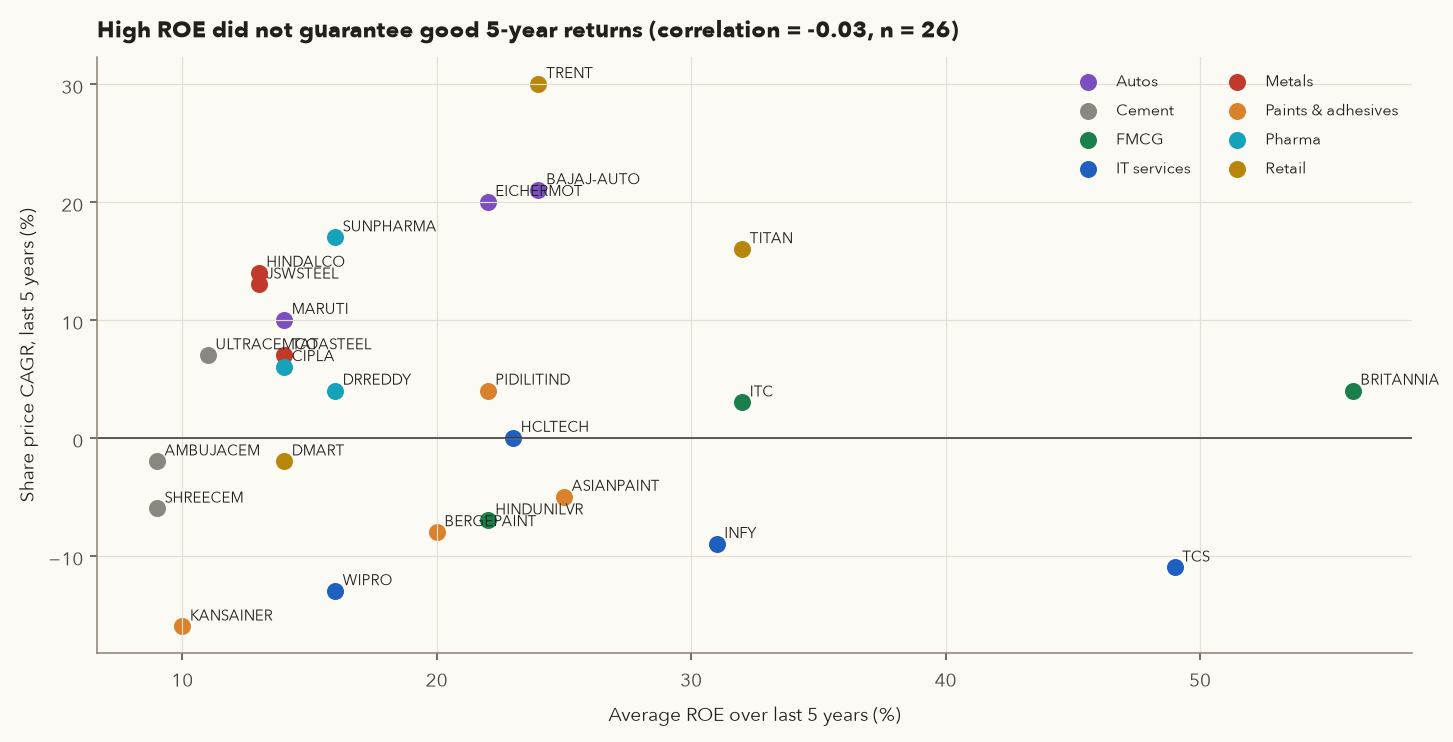
- TCS (5-year average ROE 49%) and Britannia (56%) delivered −11% and +4% a year in price. Both started the period at very high P/E multiples.
- Hindalco and JSW Steel (ROE 13%) delivered +14% and +13% a year. They started cheap, at a cyclical low.
- Trent (24%) delivered +30% a year because its growth exploded beyond what the market had priced in.
Returns come from what happens relative to expectations, and the starting valuation sets those expectations. Quality ratios reduce the risk of permanent loss. They do not guarantee good returns if you overpay. That is why Stage 3 (valuation, Chapter 8) exists, and why many investors combine fundamentals with a technical trend filter (Chapter 5) to avoid buying good companies while they are still falling.
15. Try it yourself (Python)
These snippets need a copy of the course repository and Python with pandas and numpy (setup steps are in its framework/README.md). Run them from the repository's root folder, for example with .venv/bin/python, because the file paths are relative to that folder. They use the cached screener pages and helper functions in course/scripts/ch07_data.py.
(a) ROE, ROCE and DuPont for any cached company
import sys
sys.path.insert(0, "course/scripts")
import ch07_data as D

m = D.company_metrics("PIDILITIND")
print(f"EBITDA margin {m['ebitda_margin']:.1%}  ROE {m['roe']:.1%}  ROCE {m['roce']:.1%}")
print(f"DuPont: {m['net_margin']:.2%} x {m['asset_turnover']:.2f} x {m['equity_multiplier']:.2f} = {m['dupont_roe']:.1%}")
print(f"D/E {m['de']:.2f}  interest cover {m['icr']:.1f}x  CCC {m['ccc']:.0f} days")
(b) A CAGR function and a growth table straight from the P&L
import sys
sys.path.insert(0, "course/scripts")
import ch07_data as D

def cagr(start, end, years):
    return (end / start) ** (1 / years) - 1

pl = D.table("BAJAJ-AUTO", "profit-loss")
for n in (3, 5, 10):
    s, e = pl.loc["Sales", f"Mar {2026 - n}"], pl.loc["Sales", "Mar 2026"]
    print(f"{n}y revenue CAGR: {cagr(s, e, n):.1%}")
(c) Your own peer screen from the computed metrics file
import pandas as pd
m = pd.read_csv("data/extra/ch07_company_metrics.csv", index_col=0)
screen = m[(m.roe > 0.15) & (m.de < 0.5) & (m.cfo_pat > 0.8) & (m.rev_cagr5 > 0.10)]
print(screen[["sector", "roe", "de", "rev_cagr5", "pe"]].sort_values("pe").round(3))
(d) Rolling P/E from price history and annual EPS
import sys
sys.path.insert(0, "course/scripts")
import pandas as pd, ch07_data as D

px = pd.read_csv("data/ohlc/INFY.csv", index_col=0, parse_dates=True)["Close"].resample("ME").last()
pl = D.table("INFY", "profit-loss")
eps = {int(c[-4:]): pl.loc["EPS in Rs", c] for c in pl.columns if c.startswith("Mar 20")}
pe = pd.Series({d: p / eps.get(d.year if d.month >= 5 else d.year - 1, float("nan")) for d, p in px.items()})
print(pe.loc["2021":].resample("YE").last().round(1))
Exercise: change the thresholds in (c) to sector-specific ones (for example ROE > 10% for cement) and see how the list changes. To refresh the data, re-download a page with curl -A "Mozilla/5.0" https://www.screener.in/company/SYMBOL/consolidated/ into data/extra/screener_ch07/SYMBOL.html.
16. Practical checklist
- Stage 1 first: can I describe the business, its customers, competitors, costs and moat on one page? Any red flag in promoters, governance or subsidiaries means stop here.
- Pick the right peer set (same products, same customers), and use the same data source and definitions for all of them.
- Profitability: EBITDA and PAT margin against peers and against the company's own 10-year trend. ROE and ROCE above about 15%, or above the sector median for low-return sectors.
- DuPont: is ROE driven by margin and turnover, or by leverage? Is the equity multiplier rising?
- Leverage: D/E, interest cover and net debt/EBITDA, tested against a bad-year EBITDA for cyclical companies. Check what the debt really is: leases, gold loans, a lending subsidiary.
- Working capital: inventory and receivable days stable, receivables not growing faster than sales, CCC compared with peers.
- Cash: 5-year cumulative CFO ÷ PAT above 0.8; free cash flow positive in most years.
- Growth: 3/5/10-year revenue and EPS CAGR, with abnormal base years checked and EPS growth close to PAT growth (no dilution).
- Valuation snapshot: P/E (after stripping one-offs), P/B, EV/EBITDA and dividend yield against peers and the company's own history. Then do a full valuation (Chapter 8).
- Banks: NIM, CASA, GNPA/NNPA/PCR, CAR/CET1, CD ratio, ROA. Use the bank's latest investor presentation.
- Sector KPIs: the 3–5 metrics specific to the industry (Section 13.2).
- Promoters: holding trend and pledge status (NSE pledged-data page, quarterly shareholding pattern).
- Piotroski F-score for turnaround or value candidates; treat 8–9 as "improving", not "high quality".
- Write down the thesis, what would prove it wrong, and the date of the next review (after each quarterly result).
17. Key takeaways
- A ratio means nothing on its own. Compare it with peers in the same sector and with the company's own history, using one data source and consistent definitions.
- Profitability (margins, ROE, ROA, ROCE) shows how much the business earns. DuPont shows how: margin, asset turnover or leverage. High ROE built on leverage is the weakest kind.
- Leverage ratios (D/E, interest cover, debt/EBITDA) decide whether a company survives a bad year. Test cyclical companies on bad-year earnings.
- Working capital matters. A negative cash conversion cycle (HUL −66 days) lets a company grow on its suppliers' money. A long one (pharma about 190 days) consumes cash.
- CAGR depends on the window you choose. Check 3, 5 and 10 years, watch for depressed base years, and confirm EPS growth tracks PAT growth.
- Valuation multiples must be read with quality and growth. Strip one-offs before trusting a low P/E. Multiples can shrink for years, as TCS went from about 43× to 15× while EPS kept rising.
- Banks need bank ratios: NIM, CASA, NPAs, PCR, CAR, CD ratio, ROA.
- The Piotroski F-score detects improvement and works best for cheap or turnaround stocks.
- Qualitative work (business model, moat, management, promoter holding and pledges, capital allocation) is Stage 1, and a red flag there ends the analysis.
- Over 2021–2026 in our sample, high ROE alone did not predict returns (correlation −0.03). The price you pay matters.
18. Quiz and exercises
Q1. A company has sales ₹10,000 cr, total expenses ₹8,600 cr (including ₹200 cr finance cost and ₹400 cr depreciation) and other income ₹300 cr. What is its EBITDA margin?
Q2. Company A: net margin 5%, asset turnover 3.0×, equity multiplier 1.2×. Company B: net margin 15%, asset turnover 0.8×, equity multiplier 2.5×. Compute both ROEs. Which ROE is riskier and why?
Q3. Using the FY2026 numbers in Section 5, what would Tata Steel's debt/EBITDA have been if EBITDA fell back to its FY24 level of ₹22,248 cr with the same debt?
Q4. A distributor has inventory days 40, receivable days 55 and payable days 30. What is its cash conversion cycle? If sales are ₹365 cr a year (₹1 cr a day), roughly how much working capital is tied up?
Q5. Maruti's EPS was ₹181.98 (FY16), ₹145.30 (FY21) and ₹466.90 (FY26). Compute the 5-year and 10-year EPS CAGR. Which is a better guide to sustainable growth?
Q6. A stock trades at ₹500. EPS is ₹25, of which ₹8 comes from a one-time land sale (after tax). Book value per share is ₹125. Compute reported P/E, adjusted P/E, P/B and earnings yield on adjusted EPS.
Q7. A bank has gross NPAs ₹2,000 cr on gross advances ₹1,00,000 cr, and has provided ₹1,400 cr. Compute the GNPA ratio, net NPA amount, and PCR. What happens to profit if regulators make it raise PCR to 80%?
Q8. Why can Tata Steel score 8/9 on Piotroski in FY26 while Asian Paints scores 7/9, even though Asian Paints has twice the ROE? Does this make Tata Steel the "better" company?
Q9. Which sector KPIs would you check first for (a) a cement company, (b) an IT services company, (c) a retailer?
Q10. Exercise: Using the Try-it code (a), compute ROE, DuPont and CCC for BRITANNIA and NESTLEIND. Why are both ROEs above 50%? Is that good, and what should you check?
19. Sources
Zerodha Varsity, Module 3 – Fundamental Analysis:
Financial Ratio Analysis (profitability, DuPont) ·
Financial Ratios Part 2 (leverage & operating) ·
Financial Ratios Part 3 (valuation & index valuation) ·
Investment Due Diligence (stock ideas, moat, checklist) ·
Equity Research Part 1 (Stage 1 questions, Stage 2 checklist) ·
Equity Research Part 2 (Stage 3, DCF – used in Ch 8).
Zerodha Varsity – Sector Analysis:
Overview ·
Cement ·
Insurance 1 ·
Insurance 2 ·
Information Technology ·
Automobiles 1 ·
Automobiles 2 ·
Banking 1 ·
Banking 2 ·
Steel 1 ·
Steel 2 ·
Hotels 1 ·
Hotels 2 ·
Retail 1 ·
Retail 2 ·
Real Estate 1 ·
Real Estate 2.
Data: Company financials and shareholding: screener.in consolidated pages (standalone for banks), fetched 2 Oct 2026 and cached in data/extra/screener_ch07/. Prices: NSE daily closes via Yahoo Finance (data/ohlc/; extra peers in data/extra/ch07_extra_closes_yf.csv), close of 30 Sep 2026. Computed metrics: data/extra/ch07_company_metrics.csv, data/extra/ch07_bank_metrics.csv. Scripts: course/scripts/ch07_data.py, ch07_figures.py, ch07_tables.py.
Bank Q1 FY27 metrics (quarter ended 30 Jun 2026): HDFC Bank Q1 FY2027 investor presentation (data/extra/HDFCBANK_Q1FY27_earnings_presentation.pdf);
ICICI Bank performance review, Q1 FY27 and DSIJ results summary;
Kotak Mahindra Bank Q1 FY27 press release;
Axis Bank Q1 FY27 press release (18 Jul 2026);
SBI Q1 FY27 press release (7 Aug 2026).
Regulation: RBI Basel III capital regulations (minimum CRAR 9%, CET1 5.5%, Tier 1 7%, CCB 2.5%) — RBI master circulars; policy rates (repo 5.25%, CRR 3%, SLR 18% after the Aug 2026 MPC) — rbi.org.in, as summarised by ClearTax (verify after the 5–7 Oct 2026 MPC). Promoter encumbrance disclosure — SEBI (SAST) Regulations 2011, Reg. 31 (sebi.gov.in; explainer: Vinod Kothari); NSE pledged data.
Other: DMart FY26 retail metrics as summarised by scanx.trade (check the company's investor presentation for the original). Piotroski, J. (2000), "Value Investing: The Use of Historical Financial Statement Information to Separate Winners from Losers", Journal of Accounting Research 38 (Supplement).